In the realm of technical analysis and charting techniques, Heiken Ashi Candles found a place as an outstanding resource to follow trending markets as well as spot reversals. In the crypto markets, traders can look for specific signals based on these candles.
In this article, we will explore those potential signals and how they work for specific trading concepts like trend reversals, support and resistance, and chart patterns. In the same manner, this article emphasizes the role of the doji and the series for the Heiken Ashi approach.
Understanding Heikin Ashi
Heikin Ashi is a charting technique widely used to trade financial assets by detecting trends primarily.
These types of candles are characterized by presenting a chart view a little different from the traditional candlesticks. This is a consequence of a different calculation for the open, close, high, and low price points in the candle body.
Heikin Ashi candles consist of a mathematical formula for each of those price points that average and smooth the price fluctuations of the market expressed in the chart.
Breaking Down The Formula
For the candle body, we have:
- Open = (Open(previous bar) + Close(previous bar)) / 2
- Close = (Open(current bar) + High(current bar) + Low(current bar) + Close(current bar)) / 4
Where:
The opening price of the bar results from calculating the average of the opening and closing prices of the previous candlestick.
The closing price, for this part, is calculated by averaging the open, high, low, and close prices of the current period.
For the wicks:
- High = Maximum [High(current bar), Open(current bar), Close(current bar)]
- Low = Minimum [Low(current bar), Open(current bar), Close(current bar)]
Where:
The highest price reached by the bar is determined by taking the maximums from the current period's high, open, and close prices.
The lowest price reached by the bar is determined by taking the minimums from the current period's low, open, and close prices.
Distinctions: Candlesticks Vs. Heikin Ashi
When trading with Heikin Ashi signals, it can be helpful to spot the differences between traditional candles and HA candles from a comparative point of view to understand the relevance and essence of Heikin Ashi signals.
If we use a comparative table, it would look as follows:
| Formation | Calculation | Meaning |
|---|---|---|
|
Traditional candlesticks describe the specific open and close prices with a body followed by wicks denoting the high and low price points reached in a precise period. |
Traditional candlesticks calculate the open, high, low, and close prices based on a specific period. |
Traditional candlesticks provide precise information concerning price movements, including the open, high, low, and close. |
| A Heikin Ashi candle results from an average calculation that shapes a colored body, a shadow, and a wick. The color of the body in this candle discloses the direction of the trend. |
Heikin Ashi candles derive from the open and closed prices of the previous candles, as well as the open, high, low, and close of the current candle. |
Heikin Ashi candles are smoother reflections of the price and focus on the prevailing trend direction. |
How To Interpret Heikin Ashi Charts: Key Concepts
Before diving into trading the HA signals, traders should learn to spot and interpret the particularities of these candle charts. We can disclose two key concepts that address the bullish and bearish sides of the markets as well as the indecisions preceding a trend reversal.
The series
This concept is crucial for detecting potential trends, and consists of the following:
- A series of green bars typically will represent a bullish signal.
- A series of red bars typically will represent a bullish signal.
The Doji
Similar to traditional candlestick charts, the doji indicates indecision in the market sentiment, and may potentially precede a trend reversal move.

Trading Heikin Ashi Signlas
Trend Trading
By identifying the Heikin Ashi series, traders can spot the underlying trend of the market and enter trades in the direction of the trend or choose to stay in an already open position.
For instance:
- Traders may consider a long position after a series of green candles.
- Traders can consider a short position after a succession of red candles.
Reversal Trading
Weakness in specific price areas of the market can represent signals of a trend reversal. For example:
- If a green candle follows a red candle or vice versa, this could indicate a potential trend reversal.
- Also, a doji candle may indicate indecision or a possible trend change.
Chart and Candle Patterns
In regards to indicating indecision or potential reversals, we have:
- Spinning top patterns, which are small candlesticks with long upper and lower shadows that signal potential reversal movements.
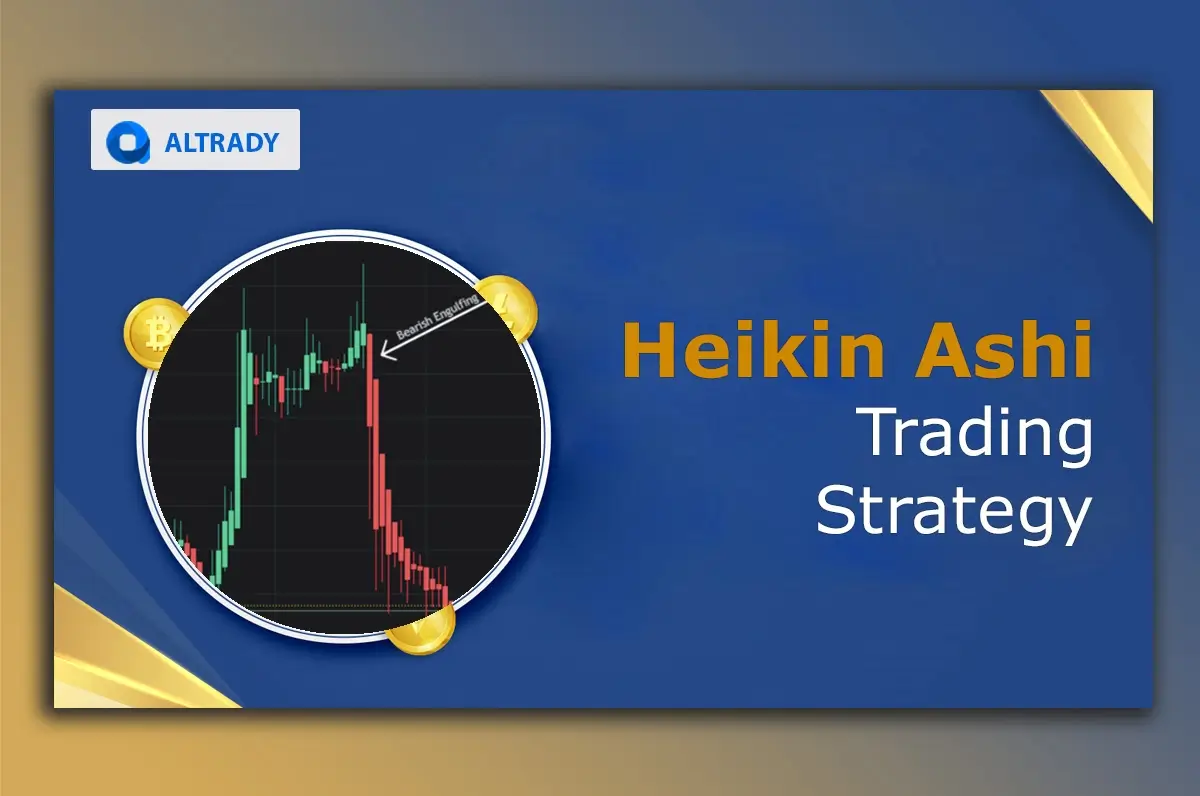
- Bullish engulfing patterns when a candle fully engulfs a previous one, indicating an uptrend momentum. On the other hand, a bearish engulfing pattern signals a potential downtrend momentum.

Support and Resistance
These levels represent supply and demand areas. With the smoothing character of Heikin Ashi candles, traders can identify refined support and resistance levels.
For instance:
- When a candle's direction turns near a support or resistance level, it suggests reversal movements. The color of the HA candle reflects the potential direction.
- Areas where the HA candles have tested the price multiple times indicate strong supply or demand.
Additional Tips For Trading Heiken Ashi Signals
- Combining other indicators: Heikin Ashi candles can be combined with other technical indicators, such as moving averages or RSI, to provide additional confirmation. As a confirmation of your analysis, use other technical indicators, such as moving averages. These indicators will help you gauge the direction of the market's momentum.
- Risk Management: To manage risks effectively, traders should use stop-loss and take-profit orders. The Heiken Ashi historical price data may give insights into meaningful levels to place these orders.
- Practice On Demo: Before starting to trade with real money, consider practicing with a demo account. Demo accounts allow traders to test their trading strategies without taking any risks.

Conclusion
Throughout this article, the Heikin Ashi charting technique has proven to be a valuable resource for analyzing markets and trade signals, especially those concerning trending seasons.
We spotted two critical chart formations, like the series and the doji, which suggest potential trends and reversals, respectively. Those formations serve as the basis for further strategies implementation.
To start trading Heikin Ashi candles, you can open a trading account in Altrady with a free trial offer to practice paper trading and test all the mentioned signals risk-free.