Have you ever heard or read about "manipulation, order blocks, fair value gaps"? If so, you might have come across these terms in discussions about Inner Circle Trading (ICT) and found them intriguing yet confusing. This article aims to demystify ICT trading concepts, providing a clear understanding of strategies developed by Michael J. Huddleston.
Whether you're a novice trader struggling to grasp these ideas or an experienced trader looking to refine your approach, this comprehensive overview will guide you through the essential elements of ICT trading.
Why did the price move in the way it did? ICT tries to answer that question. It has been beneficial for traders because these concepts help to keep a systematic behavior in front of the market.
Key takeaways
- ICT concepts help resolving complexities in the market, providing a terminology for several scenarios of trading.
- Smart Money is correlated with ICT, and ICT leverages this correlation to create a basis for its own concepts.
- Manipulation and institutional trading in general plays a key role for the understanding of Inner Circle Trading.
Understanding the ICT Mindset
ICT builds its basis on top of the "smart money" interpretation, which is trying to address institutional buying and selling order flow. ICT states this is key to understanding the market structure and potential manipulation of the price action.
This trading method not only traces resistance and support levels but also makes an effort to decipher how institutional traders will behave over those levels. Likewise, ICT traces the subsequent liquidity and gaps left after institutional traders accomplish their goals.
According to ICT, the market structure is the result of frequent manipulation of the price action that leads to significant movements. This is true since institutional traders to achieve their goals need to generate false expectations for the rest of the participants like retail traders and novices to induce them to execute trades that can be triggered later by the smart money participants.
Through this method, manipulators will focus on "stop hunts" trying to induce the rest of the traders to fall into wrong trades through tactics like "false breakouts" of resistance and support levels that later, with the accumulated liquidity in those levels, "buy-side" and "sell-side" will emerge.
So What Is Market Structure After All?
According to ICT, it is the result of the overall patterns left by the behavior of the institutional traders during uptrends, downtrends, and general market conditions as a result of their need to induce other traders into triggerable trades after implementing manipulation tactics.
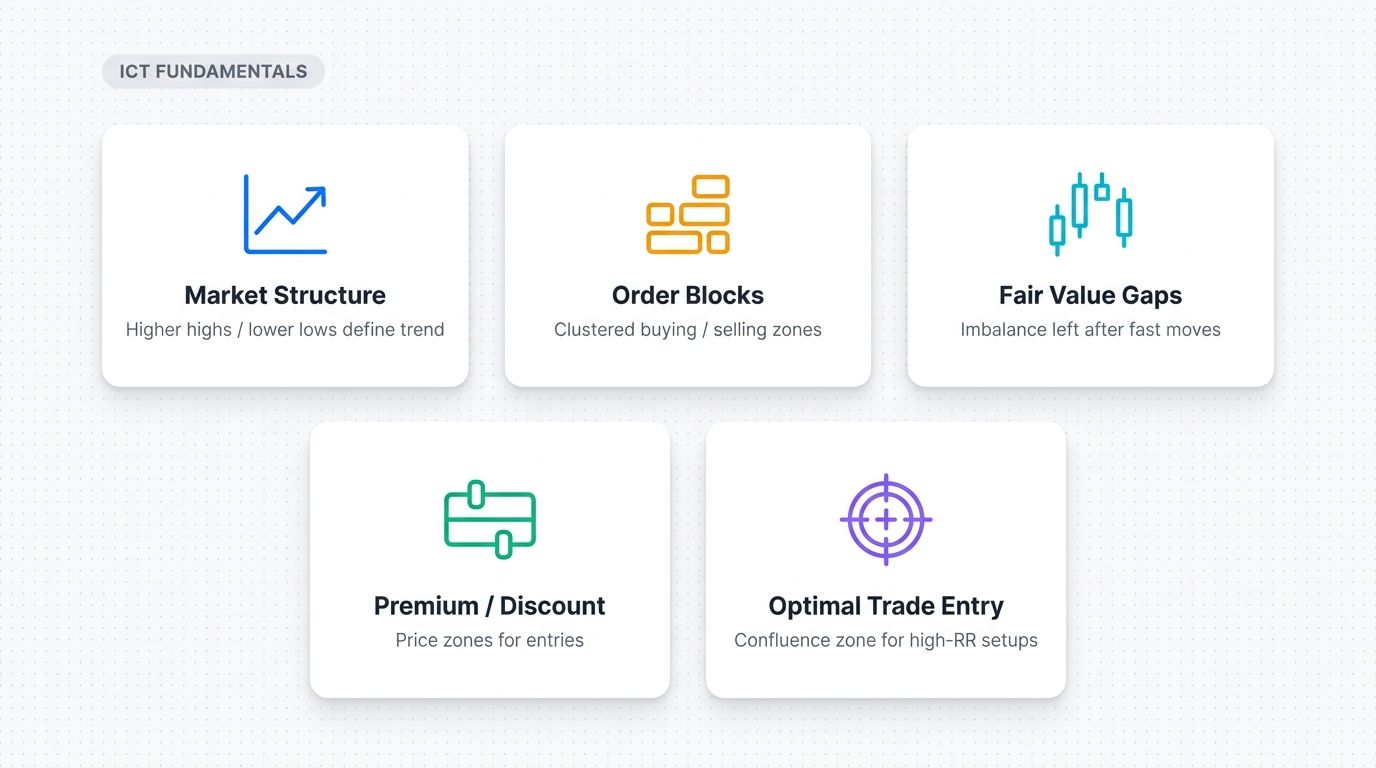
ICT carries a group of key concepts to recognize institutional trading, lets point some out:
- Optimal Trade Entry.
- Swing Points.
- Equal Lows and Highs.
- Discount and Premium zones.
- Order Blocks.
- FVG: Fair value gaps.
Key ICT Concepts
Swing Points
Swing Points is a central concept of the ICT strategy. These are highs and lows in the market structure that signal possible turning points of the price action.
For a swing high to be formed, it would be necessary for the price to move up creating a "higher high" over two previous swings. Likewise, for a swing low to be formed, it would be necessary for the price to move down creating a "lower low" over two previous swings.
This is a central concept because the price action may find resistance at swing highs and support at swing lows. Swing points are normally spotted through pin bars formation.
Equal Lows/Highs
Similar to Swing Points but not the same, Equal Lows and Highs is a complementary concept to identify support and resistance levels. The difference is that equal lows and highs are not addressed as higher highs or lower lows but as a return to price levels touched previously.
We can say then that when key levels in the market structure, formed by supply and demand forces, are revisited, equal Lows/Highs are created. It is important to understand this difference and not get confused with swing points.
However, it is useful to mention that clustered lows and highs validate zones formed by swing points. The more a zone is tested, the more it gets validated as a support or resistance.
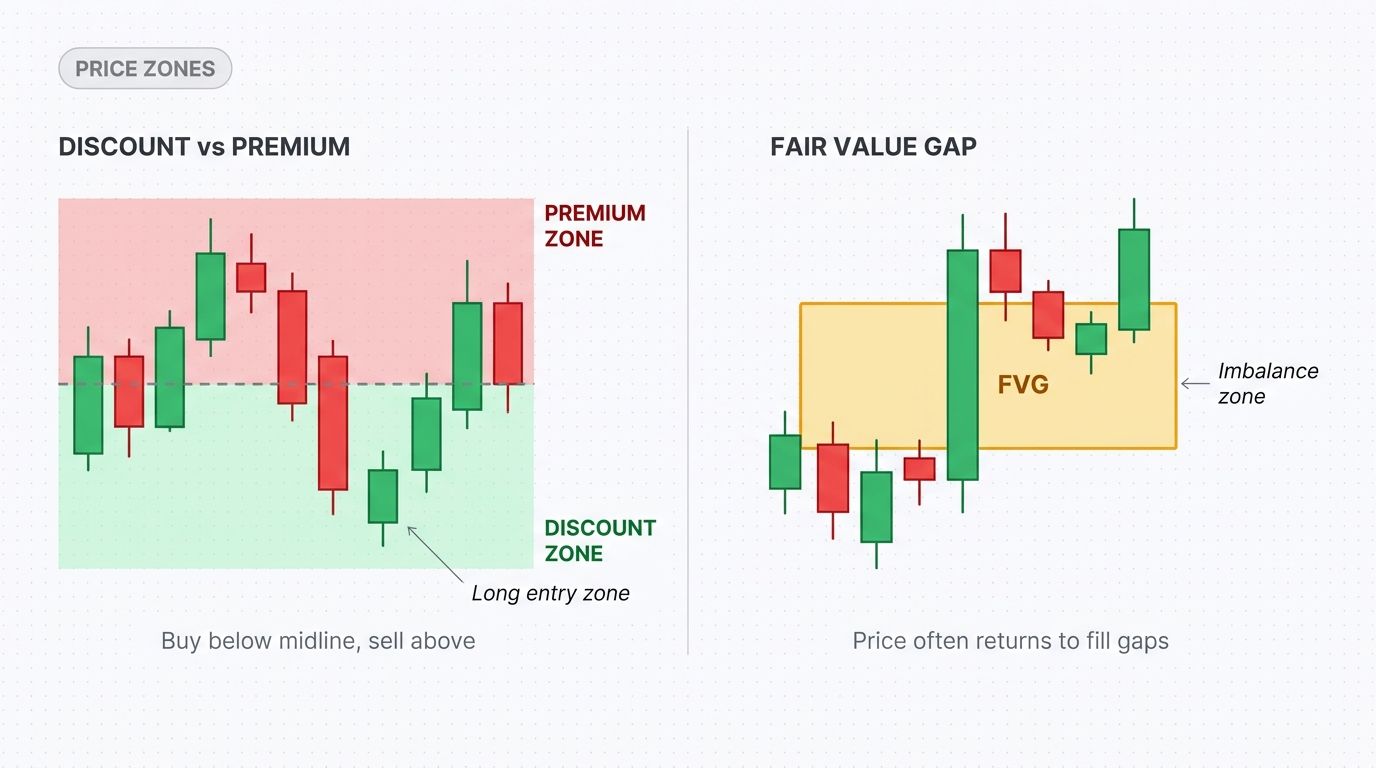
Discount and Premium Zones
This concept is built in the pre-assumption of undervalued and overvalued areas within a swing high and swing low zone. One way of seeing this is spotting a midpoint between two swing points, where the price ranging above will be the overvalued or "premium" area and below the undervalued "discount" area.
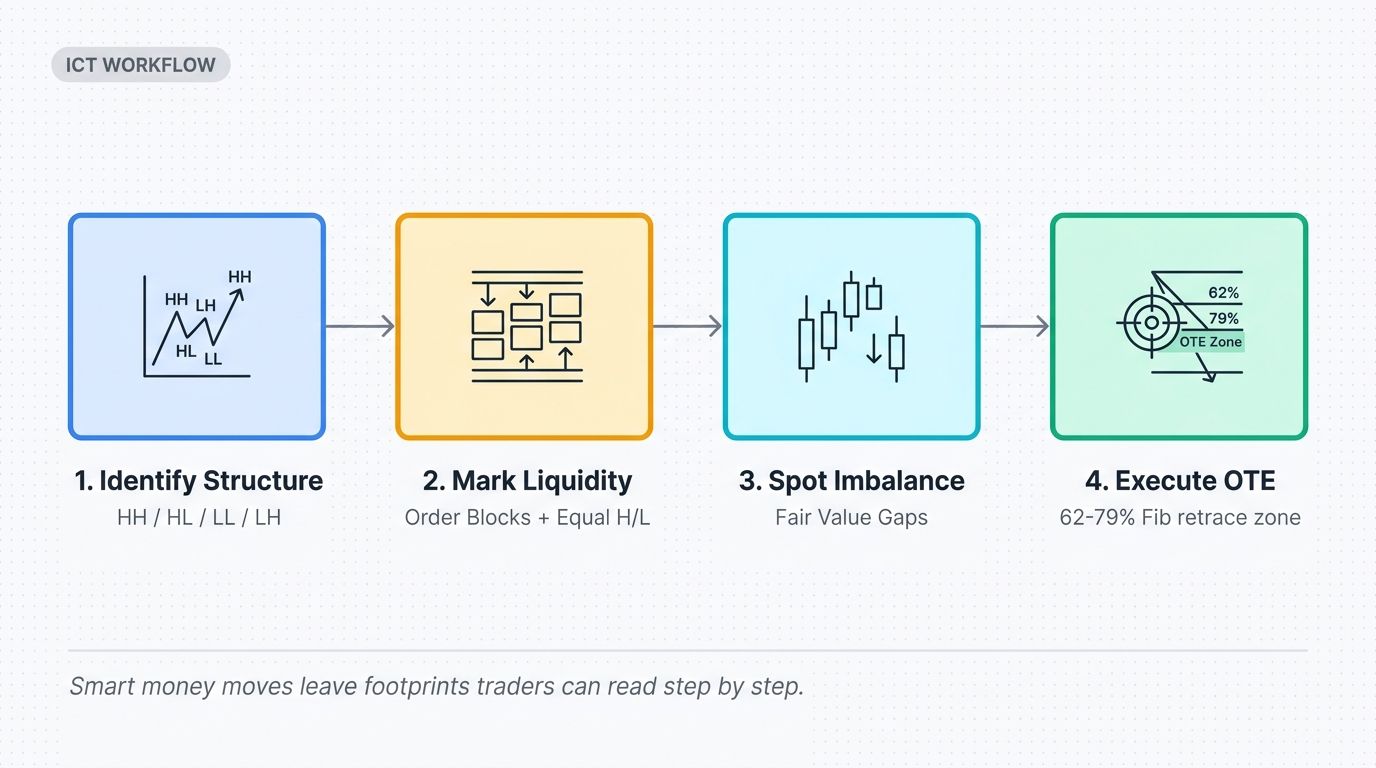
Optimal Trade Entry (OTE)
OTE is the holy grail of confluence: this concept evaluates all the factors possibly aligning themself providing optimal setups for a trade entry. In this sense, high probability opportunities are filtered through this approach.
But what factors should confluence? Any of those explained previously. It can be the case that as the market structure signals a price move, there are also liquidity signals along with order blocks acting as support and resistance in the presence of price action confirmation through a candlestick pattern.
What to look for when setting up an Optimal Trade Entry? Let's see:
- Market structure confluences.
- Order blocks
- Liquidity areas.
- Price action confirmations.
- Ultimately, an indicator can act as a factor of confluence as well.
Order Blocks: Clustered Buying and Selling Zones
Order blocks in ICT represent areas where large orders are clustered creating potential reactive zones for the price action. These areas can act as support and resistance levels; once the price touches those levels, it is expected to react significantly.
Order blocks characterize themself by serving as footprints for traders to identify relevant zones, expecting them to drive the price in a forecasted move.
Factors to consider spotting out order blocks may include:
- Consolidations: zones, where the price was trading sideways, suggest that market participants have been accumulating and distributing orders.
- Breakout move: sudden price-breaking moves following the consolidation period can be identified as a potential area for future resistance or support.
Fair Value Gaps (FVGs):
This concept states that the price difference between the opening and closing quotation during a relevant period is a "gap" that needs to be filled. ICT looks at gaps as a way for the market to reach equilibrium. Therefore, these gaps could be areas the price will revisit.
Imagine a market structure in which the price has fallen several points continually, leaving the chart with an "unexplored" space, that would be the "gap" expected to be filled later in a retracement.
FVGs can be classified into two types:
- Breakout FVGs, which occur during strong directional moves.
- Inside bar FVGs, that are formed within trading ranges.
Examples and Trade Scenarios
Using Swing Points and Market Structure
Swing points refer to key price oscillations shown on a chart. These oscillations shape the market structure and serve as an indication of the future direction prices may take.
Swing points are divided into swing highs and swing lows, which can emerge in the following scenarios:
- Swing Highs in Uptrends: As the price of an asset increases, swing highs appear in the form of new higher highs from previous higher lows.
- Swing Lows in Downtrends: As the price of an asset decreases, swing lows appear in the form of new lower lows from previous lower highs.
- Consolidations: During consolidations, swing highs and swing lows can be a signal of effective breakout from a range-bound market.
Seizing trade opportunities based on swing points requires identifying what is also known as a “pull-back” in trending markets. This occurs when the price reaches a key level from where it starts going in the opposite direction.
For example:
- During Uptrends: When the price breaks above a previous high, it is likely to find key resistance levels. Such levels cause a retracement in the price (forming a swing high) towards the previous resistance that now acts as a support level (forming a swing low). This dynamic of pullbacks after breaking key resistance levels shapes the ascending market structure of an uptrend.
- During Downtrends: Conversely, when the price breaks below a previous low, it is likely to find key support levels. In this case, the pullback in the price forms a swing low that pushes it back around the previous support that now acts as a resistance level, forming a swing high. This dynamic shapes the descending market structure of a downtrend.
By understanding the scenarios exposed above, traders can perform the following entries:
- Long positions in uptrends following a swing low. (Sticking to the trend is typically recommended).
- Short positions in uptrends following a swing high. (This involves higher risks since it implies trading against the trend. However, divergence strategies can help spot effective reversal points).
- Short positions in downtrends following a swing high. (Sticking to the trend is typically recommended).
- Long positions in downtrends following a swing low. (This involves higher risks since it implies trading against the trend. However, RSI can help you spot a bullish divergence at a swing low for an effective reversal trade).
Applying OTE principles
As mentioned in the past section, an Optimal Trade Entry is a confluence of various factors. For this case, let's take the following market scenario:
- The price is overvalued or in a premium zone, and an order block is identified in that zone.
- When the price reaches the order block, this acts as a resistance.
- Finally, the price action creates a bearish inverted-hammer candlestick pattern, suggesting a potential downtrend or reversal move.
This scenario spots three factors of confluence that will help ICT traders set up a high-probability trade entry.
Why Learning ICT Trading? Comparison Table
Feature |
ICT Trading |
Traditional Trading |
|---|---|---|
| Market Structure Analysis | Deep analysis of market structures, including swing points and liquidity zones | Relies more on technical indicators and chart patterns |
| Order Blocks | Identification of large institutional order clusters acting as support/resistance | Limited focus on institutional order flows |
| Fair Value Gaps (FVGs) | Utilizes gaps in price action as potential areas for price equilibrium | May overlook price gaps or treat them as anomalies |
| Optimal Trade Entry (OTE) | Combines multiple factors such as market structure, order blocks, and price action for high-probability entries | Typically relies on individual indicators or patterns for trade entries |
| Risk Management | Emphasizes robust risk management techniques, including diversified portfolios and dynamic stop-loss | Standard risk management practices, often predefined and less adaptive |
| Psychological Approach | Focuses on understanding institutional behavior and market manipulation to reduce emotional bias | May involve more discretionary decision-making influenced by trader emotions |
Advantages of ICT Trading:
- Systematic Approach: Provides a structured framework for analyzing market movements.
- Identification of Institutional Behavior: Helps traders anticipate market manipulations and liquidity movements.
- Easy Learning Curve: By building its own indicators, such as order blocks, FVGs. and OTE, ICT helps beginners understand and address complex market conditions with comprehensible concepts.
Limitations of ICT Trading:
- Complexity: Techniques like stop hunts and manipulation may be easy to understand but difficult to master in volatile market conditions.
- Potential for Overfitting: Strategies may perform well in backtesting but fail in live markets.
How Important is Risk Management in ICT trading?
Risk management is crucial in ICT trading to minimize potential losses and ensure sustainable trading performance. This includes:
- Setting stop-loss orders.
- Identifying profitable risk-reward trade setups.
- Position sizing techniques.
- Adhering to a disciplined trading plan.
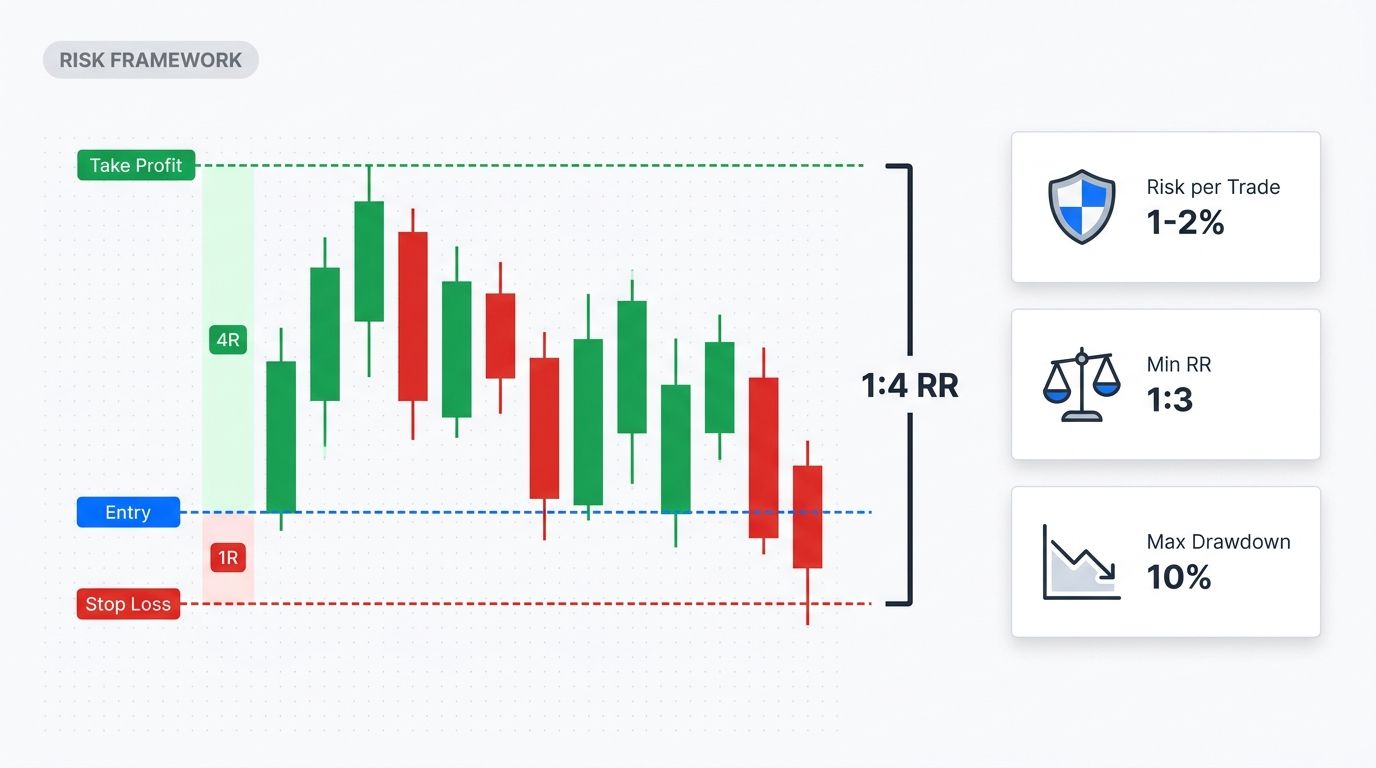
The following chart illustrates key concepts:
- Order block acting as resistance.
- High volume during the order block and the potential setup formation, suggesting institutional presence or at least enough money flow to move the price.
- Potential liquidity to extend the moves by triggering stop-loss orders.
ICT traders can manage this trade through the following process:
- Setting the stop-loss above the order block.
- Seeking one or various take-profit targets beyond the liquidity zone.
- Adjusting the position size to current volatility. Since there is hgh volume, traders can reduce the lot size while achieving a good risk-reward; in this case, a 1:4 ratio.
Conclusion
Inner Circle Trading (ICT) provides a robust framework for understanding market structures and institutional behaviors.
By mastering key ICT concepts such as order blocks, fair value gaps, and optimal trade entry (OTE), traders can develop systematic strategies to navigate complex market scenarios effectively.
Ready to Master ICT Trading Concepts?
Enhance your trading strategies with Altrady’s advanced tools. Sign Up for a Free Trial today and start implementing ICT concepts to optimize your trading performance.
Expanded FAQ Section:
What is Inner Circle Trading (ICT)?
Inner Circle Trading (ICT) is a trading framework developed by Michael J. Huddleston that focuses on understanding market structures, institutional trading behaviors, and price manipulation to identify high-probability trading opportunities.
How does ICT trading differ from traditional trading strategies?
ICT trading emphasizes a systematic approach based on market structure analysis, order blocks, and fair value gaps, whereas traditional trading often relies on technical indicators and discretionary decision-making.
What are Order Blocks in ICT trading?
Order Blocks are areas where large institutional orders have been executed, creating significant support or resistance levels. These zones are used by ICT traders to predict future price movements and potential reversal points.
Can ICT trading concepts be applied to cryptocurrency markets?
Yes, ICT trading concepts can be effectively applied to cryptocurrency markets by leveraging blockchain data, exchange volumes, and market structures to identify high-probability trading opportunities.
What is an Optimal Trade Entry (OTE)?
Optimal Trade Entry (OTE) is a confluence of various factors such as market structure, order blocks, liquidity areas, and price action confirmations that together provide a high-probability setup for trade execution.
What tools are essential for implementing ICT trading strategies?
Essential tools include advanced charting software, custom indicators for identifying ICT concepts, high-performance computing resources for data analysis, and platforms like Altrady that support algorithmic trading.
What are Fair Value Gaps (FVGs) in ICT trading?
Fair Value Gaps (FVGs) are areas on the chart where there is a significant price difference between the opening and closing of a candle, indicating an imbalance that the market is likely to fill as it seeks equilibrium.