Markets can go through different seasons that repeat themselves over time, and research can provide valuable data for more in-depth asset analysis.
Larry Williams has left some techniques to go deeper into the causes of market movements.
At Altrady, we've adapted and refined Larry Williams' trading strategies for the unique dynamics of the cryptocurrency market.
In this article, we will explore his notable techniques and teachings, understand their benefits when trading the cryptocurrency markets, and share our insights and practical applications.
Larry Williams Fundamental Trading Techniques
Although Larry Williams is recognized as a prominent technical analyst, his strategic approach to the market relies not solely on technical aspects but on fundamentals.
He built an avant-garde framework across various data that serve as indicators that address the internal factors affecting asset price movements.
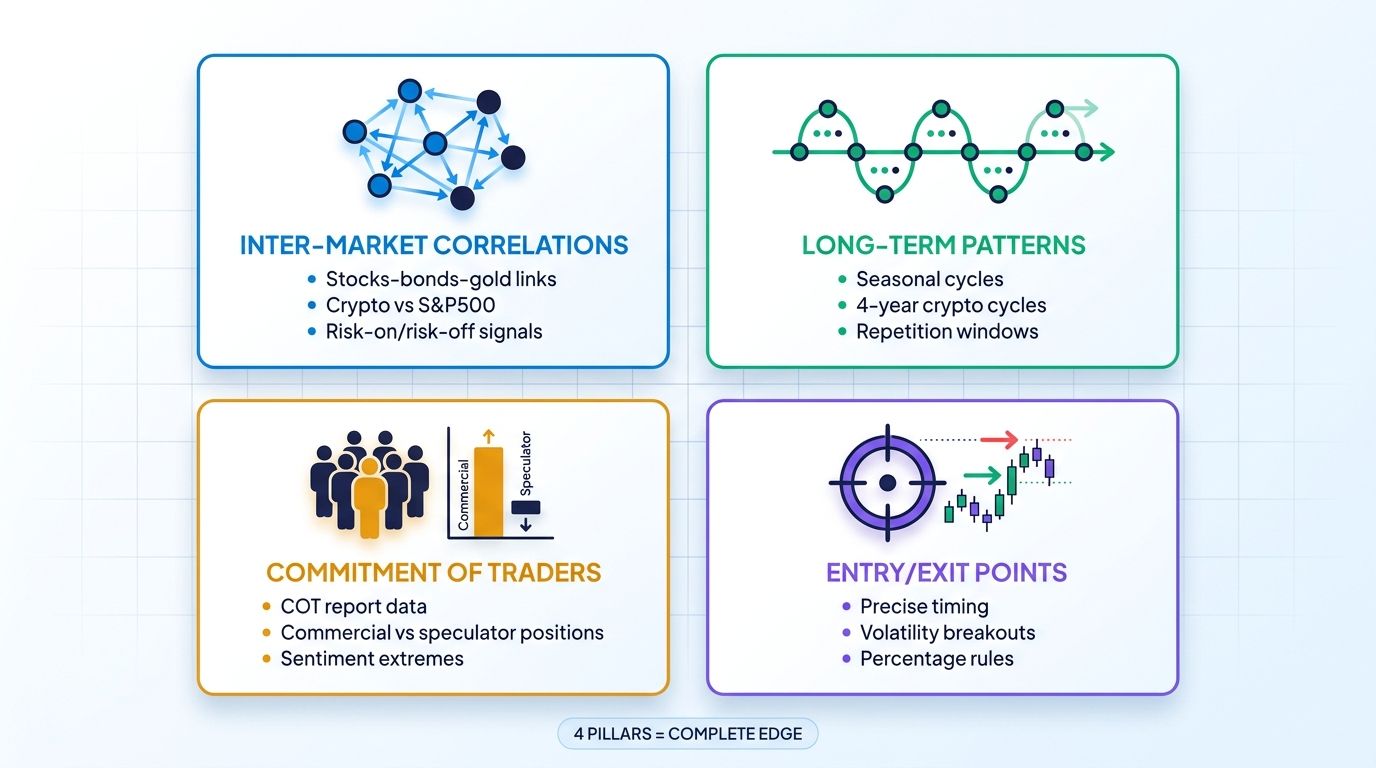
From these indicators, we can point out the following techniques:
Inter-market Correlations:
This refers to analyzing the relationship between multiple assets and their market conditions.
In the case of Larry Williams trading, he would analyze:
- Bonds
- Stocks
- Metals
- Commodities.
Crypto traders can analyze:
- Crypto Networks.
- Blockchain Utility.
- Bitcoin Dominance
- Altcoins Market Capitalization.
Long-Term Market Patterns Analysis
It is about establishing a coherent association throughout the different seasons that the markets go through. Larry Williams would address the annual and monthly patterns related to holidays, elections, tax, quarter revenues, etc.
For instance, in the stock market, there are the following seasonal patterns:
- Tax time.
- 4th of July.
- September effect.
- Summer time.
- Thanksgiving.
The crypto market is also affected by some seasonal patterns since its appearance, as the following:
- The Bitcoin Halving: a reduction event in the reward miners obtain for supporting the BTC blockchain. It occurs on a 4-year cycle, and every cycle has caused a rise in the price of Bitcoin as a result of a decrease in the supply since the miners have less BTC to sell in the market, and there are fewer coins in circulation. This year, 2024, in April, Bitcoin completed its fourth halving, meaning that it is currently in this market cycle.
- Alt-season: This season occurs when Bitcoin dominance declines and the market capitalization is allocated to alternative cryptocurrencies, causing higher prices in the altcoins. The latest alt-season was in 2021, and the market sentiment forecasts a new one towards 2025.
Commitment Of Traders (COT)
Larry Williams was a pioneer trader in using COT data to disclose the market sentiment and how buyers and sellers distribute their positions in the market.
The COT data is tremendously convenient for anticipating and understanding the more complex phase of the market: the trend. That is why Larry Williams saw this data as a powerful indicator since he advocates for trend trading strategies.
This data calculates the open interest and net positions of all traders in the futures market. Specifically, the open interest analysis reflects the traders' preference for long or short positions, indicating the number of contracts held, hence the underlying demand or supply of a market.
For example, typically, a high open interest in the Bitcoin futures market indicates strong demand. Alongside this interpretation, crypto traders can also understand the market volatility, which can rapidly provoke overbought and oversold conditions over the asset.
In the Larry Williams approach, he would use his own indicator, the Williams Percent Range (%R), to detect those overbought and oversold levels.
Case Study: Using Williams %R to Trade a Bitcoin Dip
The following market scenario reflects a fitting example of a trade setup that gathers various converging factors and enhances a Williams %R signal. Three price action moves come to the fore:
- The price breaks a key support level (95000) while the indicator rapidly hits the oversold area, suggesting a spike in volatility.
- The price is starting to recover as the indicator is steadily increasing, indicating healthy volatility amidst upside moves and pullbacks.
- Finally, a bullish engulfing candlestick emerges on the third pullback (note that the price bounces off the broken key level which acts as support again) while the indicator moves into the overbought area, indicating momentum in the market.

Entry/Exit Points
- Entry Point: Set at the close of the bullish engulfing candle, around 95650.
- Exit Point (Stop-loss): Set far below the engulfing candle, around the 95000 support area.
- Exit Point (Take-profit): Set beyond the opening price (resistance) of the candle that causes the volatility spike move.
| Quick note: Later in this article, you will learn more about the causes behind the increase in volatility and understand why this trade made sense exactly. |
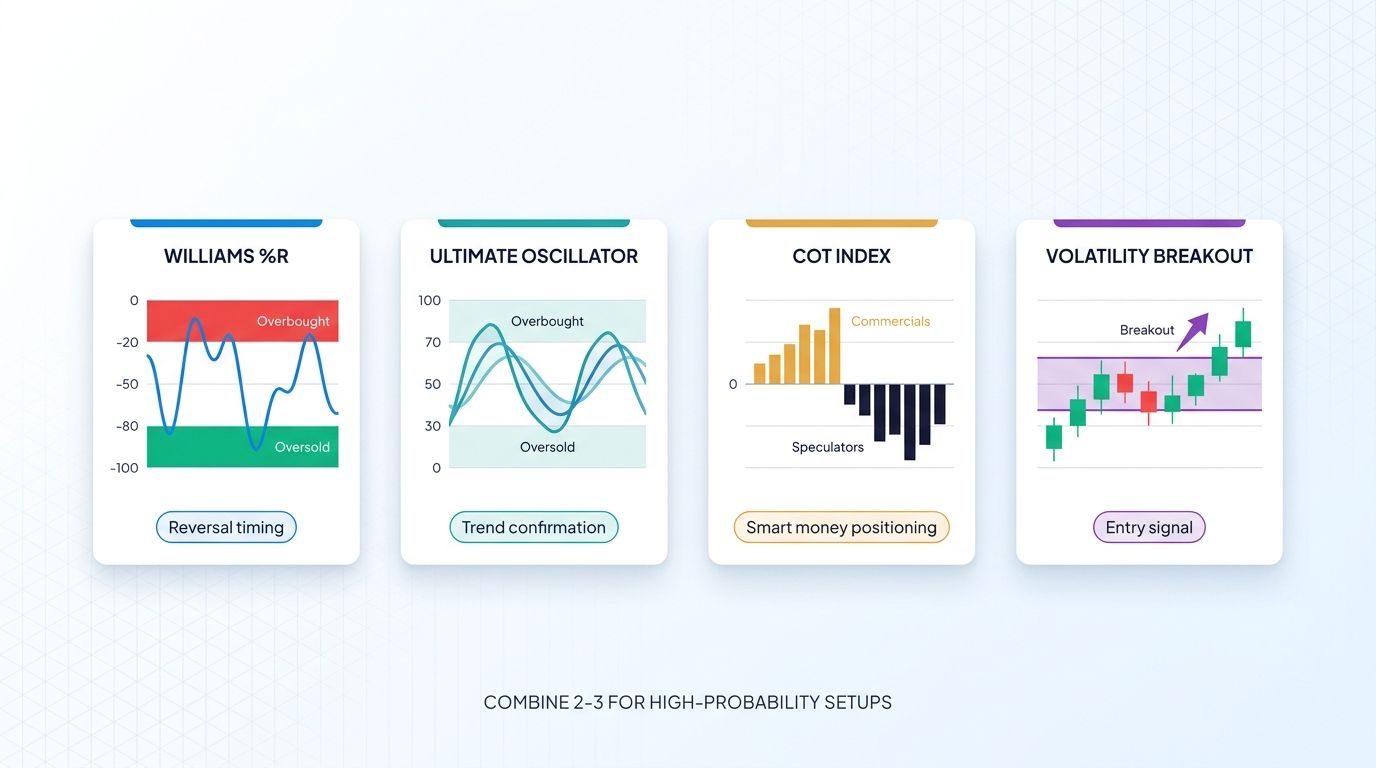
The Role Of Larry Williams Indicators: Comparative Table
Williams %R: Measuring Volatility |
Ultimate Oscillator: Integrating Different Timeframes |
|---|---|
|
|
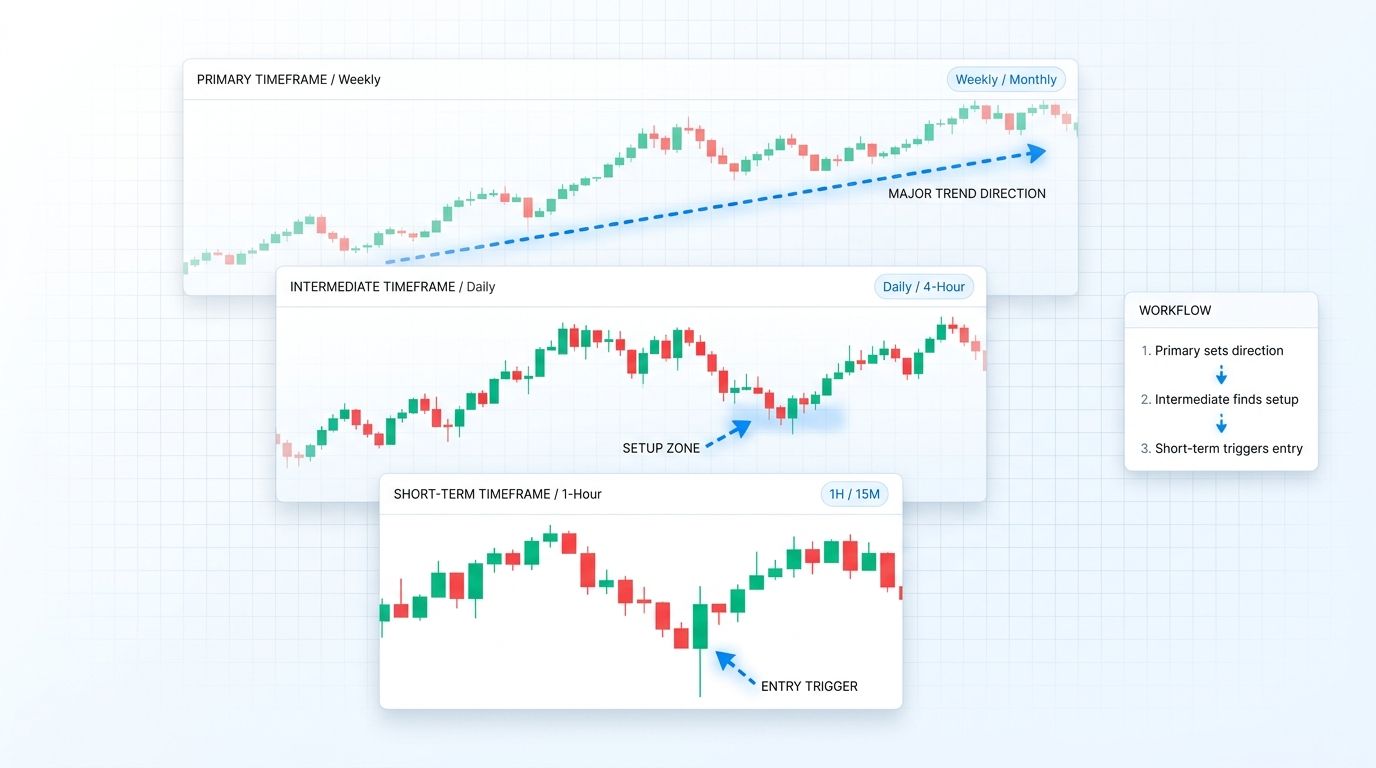
Understanding the Multi-Time Frame Strategy
By taking the idea behind the Ultimate Oscillator of Larry Williams, we can explore the essence of his framework and how he assembles a strategy based on three primary timeframes:
- The long-term.
- Intermediate
- The short-term.
As he would state, to bring long-term order from short-term chaos, each time frame serves a specific purpose:
Primary Timeframe Analysis:
Identify the all-around market trend. It helps traders see the significant movement, detecting key support and resistance levels, actual trend direction, and potential reversal points. This could be in a daily or weekly chart.
Intermediate Timeframe Analysis:
This timeframe offers a broader but also detailed view of price action. It helps in identifying pullbacks during a trend from a bigger perspective for a mid-term approach and, at the same time, provides broader insights for short-term analysis. This could be in a 4-hour, 8-hour or 12-hour chart.
Short-Term Timeframe Analysis:
This enables traders to follow short-term market fluctuations and pursue an edge over smaller price movements. It is crucial for timing entry and exit points and accurate execution within the trend context. 1-hour charts and fewer (30min, 15min, 5min).

Employing Altrady’s multi-time frame feature powered by Tradingview charts to identify a support area in BTC from a 12h perspective, analyze it from a 4h chart, while seizing it during a market rebound in a 15 min time frame.
Button: Identify and seize support areas with this powerful Crypto Base Scanner
Getting Out Of A Trade: The Key To Money Management
The following techniques belong to the ‘Oops’ exit strategy.
Bailout’ Exit
This technique is based on the opening of markets. However, crypto markets do not open or close, but as more institutions adopt cryptos, traders can time the session opening across Asia, Europe, and America trading schedules.
Daily highs and lows areas can be significant references for tracking traditional markets opening and closing times, whose participation often causes volatility spikes around psychological price levels.
Such volatility spikes can be driven by news events, such as the following:
- Inflation reports in the US: For example, on February 12, 2025, the US reported an increase in every category of the CPI (Consumer Price Index), reflecting a rising inflation rate. As a consequence, BTC plummeted within the range of 96500 to 94000, breaking a key level (recent support) at 95000.

Increased volume suggests massive market participation (likely liquidated positions) while the price fell, just to recover hours later, reflecting a volatility spike example.
- Interest rate changes in the US, Europe and Asia: In this case, an example could be the rate hike carried out by the Bank of Japan on August 5, 2024, which brought down all markets, including cryptocurrencies. Such a market crash was tagged as “the biggest since 1987”, reminiscent of Black Monday of that year.

Each volume spike reflects the volatility across each trading session (Asia, Europe, and finally the US) while the price fell. The price recovered later in the week.
By taking the previous scenarios as examples, let’s see how traders can adapt a Bailout’ Exit strategy to crypto market:
- In the first case, since there is a support level around 95000 and the report on inflation is a predictable (almost) event, traders can use a wider stop-loss (like Larry Williams would suggest) at a lower position size in anticipation of the news.
- In the second case, the market was already downtrending in the previous days, so traders who were swing trading the market decline could place their take-profit targets further out as the rate hike news was released.
In addition to the above ideas, according to Larry Williams:
- Close a trade position at the first open if it is already profitable: If you have a profit on an open trade, you get out at that open.
- If you’re in a losing position, you hold (maintain the appropriate stop-loss) and look forward to a chance for it to turn profitable at the next session open (as shown above, prices later recovered).
Number of Days
This is closing a position after a fixed number of days, for example:
- 3, 5, or 10 days.
- Establish a number of days as a systematic exit according to the asset's market analysis.
Wide Stops
Suitable for some, criticized by others. The truth is these stops keep traders' positions in the market a bit longer.
In crypto markets where volatility is very typical, a wide stop can be a technique to consider.

The above chart shows a trade example practicing the following criteria:
- Seizing a potential price recovery (following Japan's rate hike news) as the Williams %R repeatedly hit an oversold level.
- The setup also employs a wider stop-loss due to high volatility.
- This trade could have used a number of fixed days as a closing strategy since the recovery started on monday and there were 4 days left ahead in the week.
Conclusion
Throughout his techniques, Larry Williams has left an advanced approach compound in data study, seasonal patterns, and multi-timeframes analysis that provide traders with a deep and unique comprehension of the market structures, elevating the status of simple concepts such as price action, support, resistance, and liquidity.
By mastering Larry Williams' techniques and adapting them to the crypto market, you can gain a significant edge. Altrady's tools, including the Williams %R indicator, provide the resources you need to implement these strategies effectively. Start your free trial account today and explore the power of multi-timeframe analysis.