Financial markets, including cryptocurrency markets, are driven by demand and supply. When there is massive demand, the prices move up for a determined period. Conversely, when there is enough supply, the prices go down.
From the standpoint of a trader or investor, the question in the face of such stages is:
- When can I open a position?
- Should I enter at this price?
- How long will the trend last?
The ADX and moving average indicators help traders address those concerns.
ADX: Measuring Trends Strength
A typical situation that traders face is being in front of a momentum phase when the market may go up or down, but they don't decide whether to open a position or dispense with it. Several scenarios can pass through the mind of traders in such a situation:
- Will this price movement continue?
- Can that upcoming support/resistance make the price bounce back?
- The momentum candle is very long. How much am I willing to risk, and where is the best price to place my stop-loss?
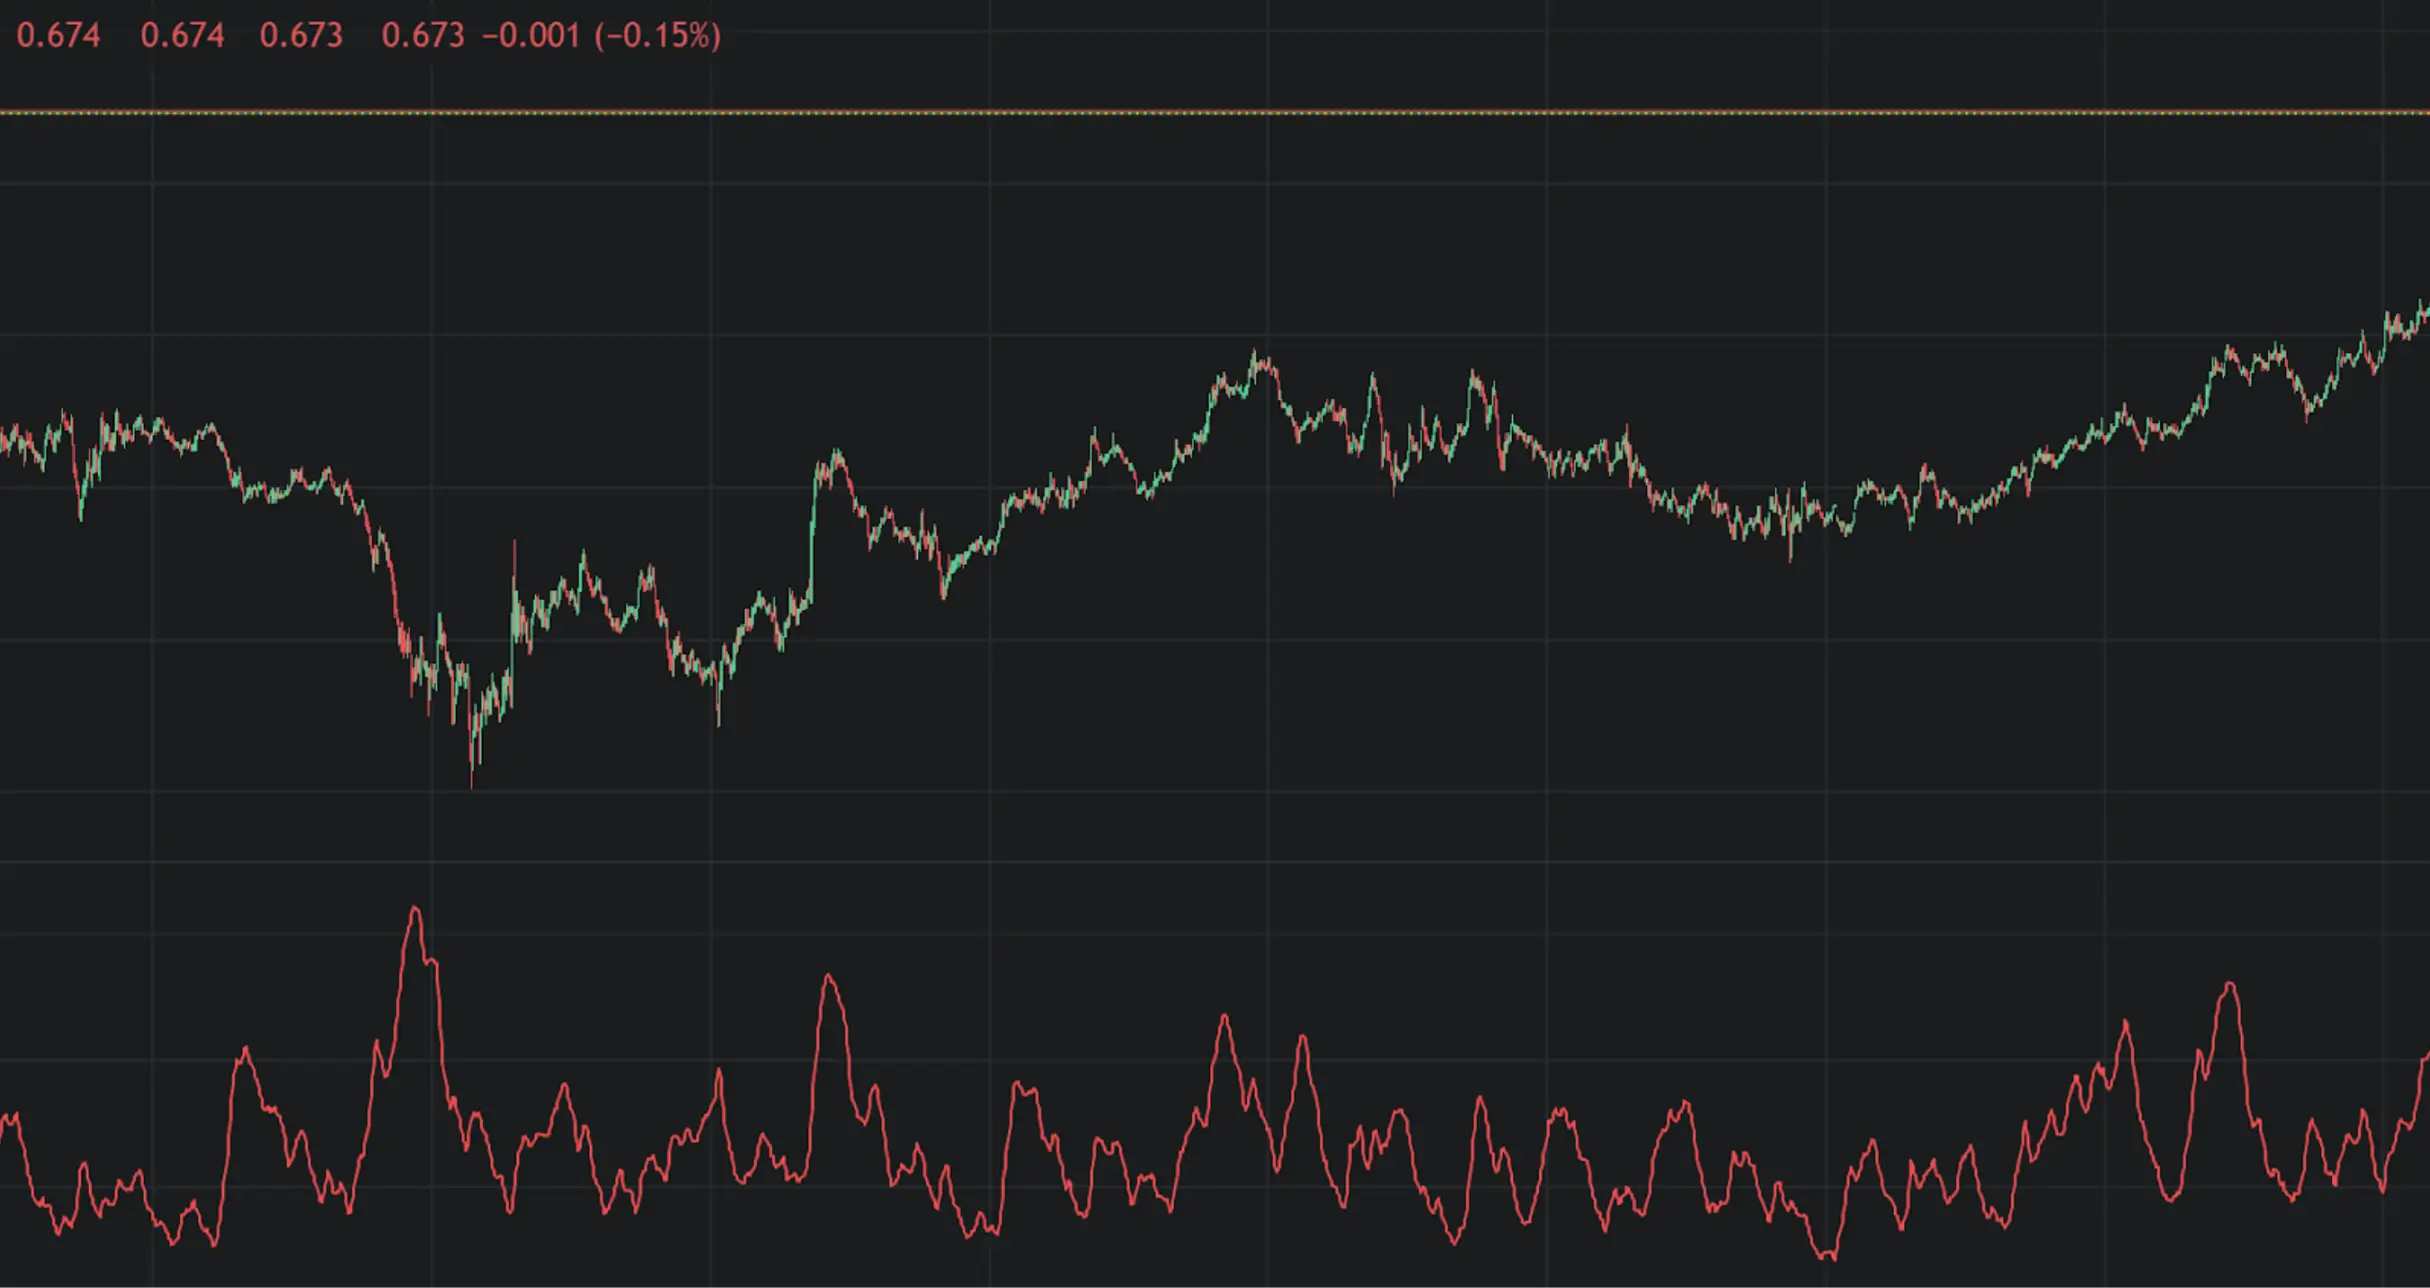
The ADX is an oscillator for technical analysis of the financial markets, including crypto assets. This indicator characterizes its function by measuring the strength of trending prices, whether they go upside or downside.
Fundamentally, the ADX provides traders insights about the momentum phases and subsequent directional movements. Moreover, this indicator extends its benefits alongside the DMI, which provides an extra confirmatory signal about the market analysis.
When using the ADX, traders can spot a trend and obtain information about its sustainability. The calculation behind makes it suitable for:
- Revealing volatility.
- Forecast a range.
- Estimate a breakout.
Furthermore, the ADX is adaptable for any trading style:
- Swing trading.
- Day trading.
- Scalping.
Moving Averages: Discovering Markets
Moving averages (MA) are indicators that smooth out the price fluctuations of financial assets. Traders can decide whether to use an MA or Exponential Moving Average (EMA). The distinction between MA and EMA is all about an additional layer of the calculation process.
While the MA calculates the closing prices over a determined period, the EMA prioritizes the recent prices and involves a multiplier, making it react more quickly to market fluctuations.
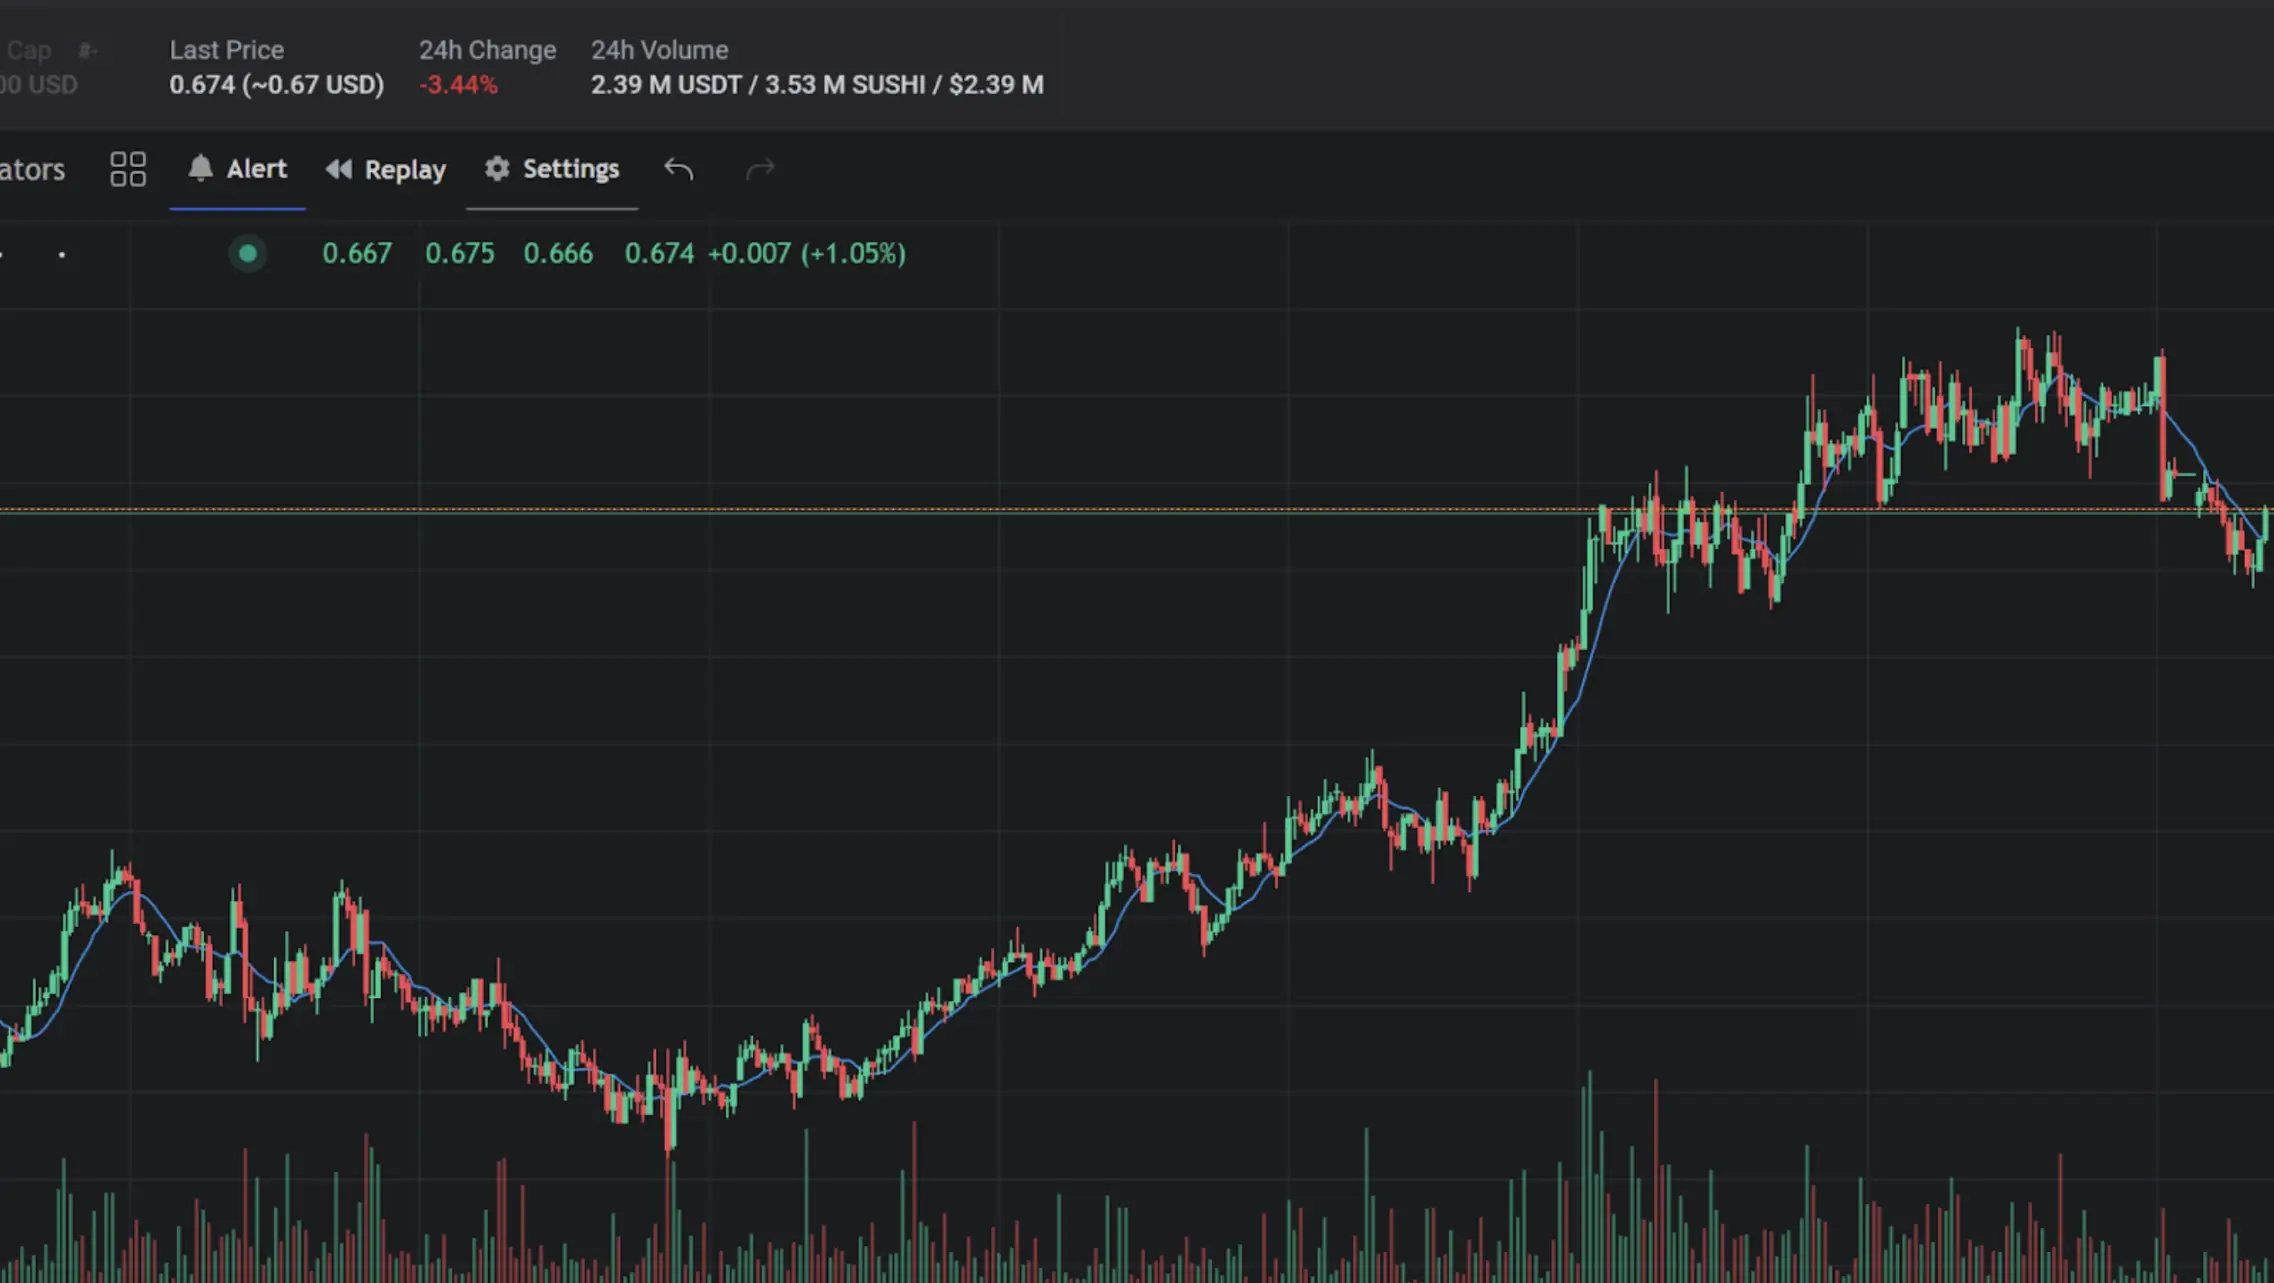
When using MA or EMA indicators, traders can discern range-bound markets from trending phases. Indeed, one of the best charting tools for identifying and following a trending market is a moving average.
Since the moving average lines track the closing prices, they stick to candles, which clarifies the direction that the quotation of a crypto asset follows.
Among the most implemented strategies, we can point out the following:
- Golden Cross and Death Cross strategy, which is suitable for swing trading.
- The 20-period strategy is broadly used for day trading.
- EMA and MA crossovers.
Combination strategies, such as plotting a 20-period alongside a 50-period MA or even an EMA 20-period with 50 and 200 periods.
Conclusion
The ADX measures the strength of a market trend, while the moving average indicators help traders follow that trend. Both are technical tools suitable for trend-following trading strategies.
In Altrady, traders use multiple tools like the ADX and moving average indicators to analyze crypto market trends and their strengths. Sign up for a free trial account today.