For active crypto traders, understanding where the market is headed often comes down to interpreting on-chain data. One of the most overlooked yet powerful signals in the toolkit is exchange reserves: the amount of Bitcoin held on centralized trading platforms. Study these reserves and you’ll get warnings of potential liquidation cascades in advance, especially during periods of high volatility or leveraged speculation.
Here’s more about the relationship between exchange reserves and liquidations, how you can use it to sharpen your market edge, and what other indicators to pair it with for maximum predictive power.
What Are Exchange Reserves and Why Do They Matter?
Exchange reserves refer to the total amount of Bitcoin (BTC) that is currently stored on centralized exchanges like Binance, Coinbase, Kraken, and others. When a user deposits BTC on an exchange, it increases the reserve. When they withdraw BTC to a personal wallet or cold storage, the reserve decreases.
These reserves act as a proxy for market intent. More BTC on exchanges generally means traders are preparing to sell or trade. Less BTC on exchanges suggests holders are moving to self-custody, often signaling a long-term bullish outlook.
The Link Between Exchange Reserves and Liquidations
Low Exchange Reserves = Less Selling Pressure
When Bitcoin reserves fall to multi-year lows, it suggests a drop in available supply for quick trades. A recent example: BTC reserves dipped to 2.44 million, the lowest level since 2018. This kind of drop typically aligns with investor confidence and long-term holding behavior.
Why does this matter? Because when fewer coins are sitting on exchanges, there's less ammunition available for panic selling. This reduces the likelihood of massive liquidations in a sudden downturn, simply because there aren’t enough coins positioned to hit the market all at once.
High Reserves = More Liquidity and More Risk
On the flip side, if exchange reserves spike, it often signals that holders are preparing to sell. It might be profit-taking, hedging, or a reaction to fear in the market. Regardless of motive, it increases the available supply, which can absorb large sell orders, but it also raises the risk of forced sell-offs through liquidations, especially in a leveraged environment.
This is particularly important for traders using margin. If the market turns bearish and prices begin to fall, rising reserves mean that any downward pressure is more likely to be met with supply, fueling a potential chain reaction of stop-loss triggers and margin calls.
How Liquidation Clusters and Price Cascades Work
Reading Liquidation Maps
Liquidation maps are heatmaps that show where large amounts of leveraged long or short positions are stacked. These positions often become "targets" in volatile markets, as whales and institutions may drive the price toward them to trigger cascading liquidations.
When prices approach one of these clusters, it becomes a danger zone. And if exchange reserves are high, there’s ample liquidity for those liquidations to flood the market and push prices lower in a violent, fast-moving drop.
What Happens When Reserves Are Low?
Now imagine the same scenario, but with low exchange reserves. The price approaches a liquidation cluster, but the market lacks the available BTC to absorb a flood of sell orders. Instead of a smooth cascade, you might see spiky, erratic moves, wider spreads, and even flash crashes due to lack of order book depth.
In this case, low reserves amplify volatility—not because more people are selling, but because the market can’t handle large sell-offs efficiently.
The Institutional Effect: ETFs and the Supply Squeeze
ETF Inflows Are Depleting Exchange Reserves
Institutional buying, especially via spot Bitcoin ETFs, has become a major force in the market. These products require actual BTC purchases, which pull coins off exchanges and into custodial cold storage. As a result, they drain liquidity and intensify the supply squeeze.
This makes the market more vulnerable to both price surges and liquidation spirals. When the circulating exchange supply is thin, even small catalysts can cause disproportionate reactions.
What Could Reverse the Trend?
The wildcard is sentiment. If fear takes over, institutions or retail holders could move BTC back onto exchanges to sell. A sudden spike in exchange reserves during a downturn is a major red flag for potential liquidation waves.

How to Use Reserve Data to Predict Liquidations
You don’t need to be a quant to integrate reserve analysis into your trading workflow. Here’s how to do it:
1. Monitor Exchange Reserve Trends Daily
Use platforms like CryptoQuant, Glassnode, or CoinMetrics to track exchange reserve charts. A steady decline suggests accumulation and lower liquidation risk. A sudden rise, especially on the major exchanges, could mean the market is gearing up for volatility.
*Tip: Look for divergence between exchange reserves and price. If price is rising but reserves are too, that might be a sign of incoming sell pressure.
2. Layer in Liquidation Cluster Analysis
Next, pull up a liquidation map or heatmap showing leveraged position clusters. These maps show where billions in positions could be wiped out if price touches specific levels.
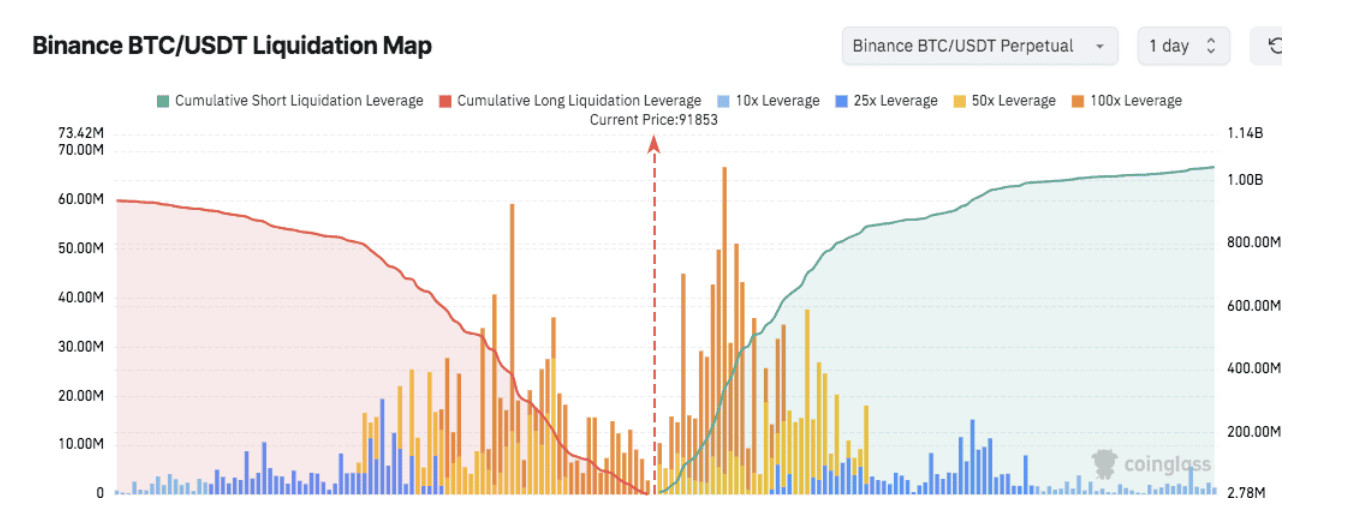
Source: Coinglass
Combine this with reserve data:
- High reserves + price near cluster = high risk of liquidation cascade
- Low reserves + price near cluster = potential for exaggerated price action due to illiquidity
3. Watch Open Interest and Leverage Ratios
Reserve data becomes even more valuable when correlated with:
- Open interest (OI): Measures the total number of open futures contracts.
- Estimated leverage ratio (ELR): Compares OI with exchange balances.
High OI and high ELR alongside rising reserves is a dangerous combo. It means traders are heavily leveraged, and there’s enough BTC on exchanges to rapidly execute liquidations.
Summary Table: Exchange Reserves vs. Liquidation Risk
| Exchange Reserve Trend | Liquidation Risk | Market Implication |
| Falling | Lower | Bullish, supply squeeze possible |
| Rising | Higher | Bearish, potential for cascades |
Case Study: March 2023 Mini-Crash
In March 2023, BTC fell from $27,000 to under $24,000 in a matter of hours. What preceded it?
- Exchange reserves rose sharply 48 hours prior
- Liquidation maps showed a thick cluster of long positions at $24,500
- Open interest spiked while funding rates turned positive (sign of bullish overconfidence)
When the market dipped slightly, it triggered a liquidation cascade. Over $800 million in long positions were wiped out in one day.
Exchange reserves offer a critical signal, but they aren’t predictive in isolation. They must be read in context, alongside sentiment, macro news, and technical patterns. That said, traders who ignore them are flying blind.
Conclusion: A Smarter Way to Anticipate Liquidations
In crypto trading, timing is everything. Understanding exchange reserves gives you a window into market behavior that most traders miss. Whether it’s preparing for a breakout or bracing for a liquidation cascade, being aware of where BTC is parked—and why—can dramatically enhance your edge.
In summary:
- Low reserves = less risk of mass liquidation, more bullish bias
- High reserves = increased chance of sell-offs and liquidation chains
- Combining reserves with leverage and liquidation maps = actionable intel