Cryptocurrency trading can be both thrilling and intimidating. Yet, understanding and effectively using channel lines can significantly impact your success. These lines serve as powerful tools that help you visualize price trends and identify potential breakout or breakdown points.
Whether you’re a seasoned investor or a novice trader, channel lines can significantly impact your success.
Read the comprehensive guide below as we’ll delve into what channel lines are and how to leverage them in your trading strategies to outperform the market.

What Are Channel Lines?
Channel lines, often referred to as trend channels, are part of fundamental technical analysis tools that traders use to identify trends, support, and resistance levels within a financial market, including the cryptocurrency market. These lines are a graphical representation of price movements and can help you make informed trading decisions.
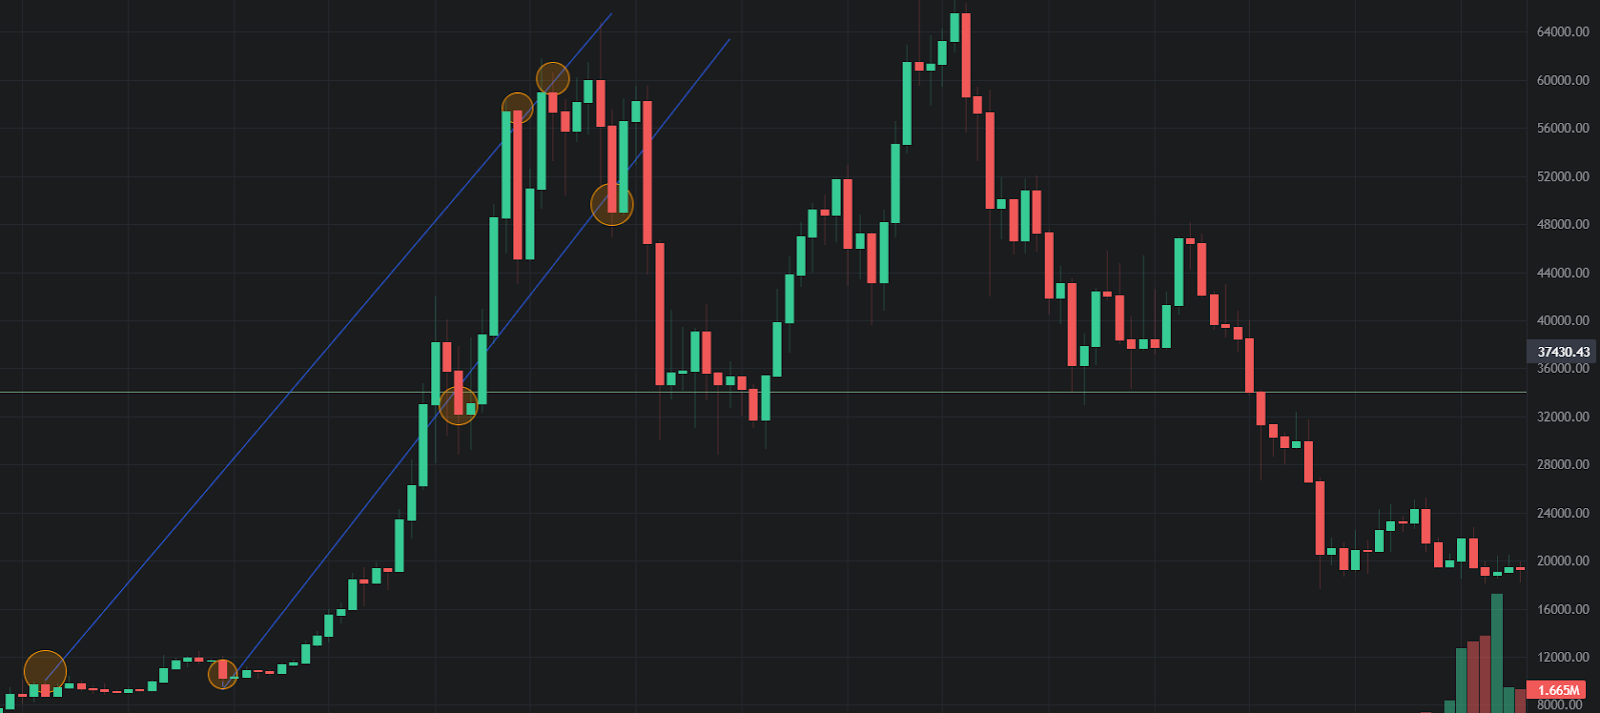
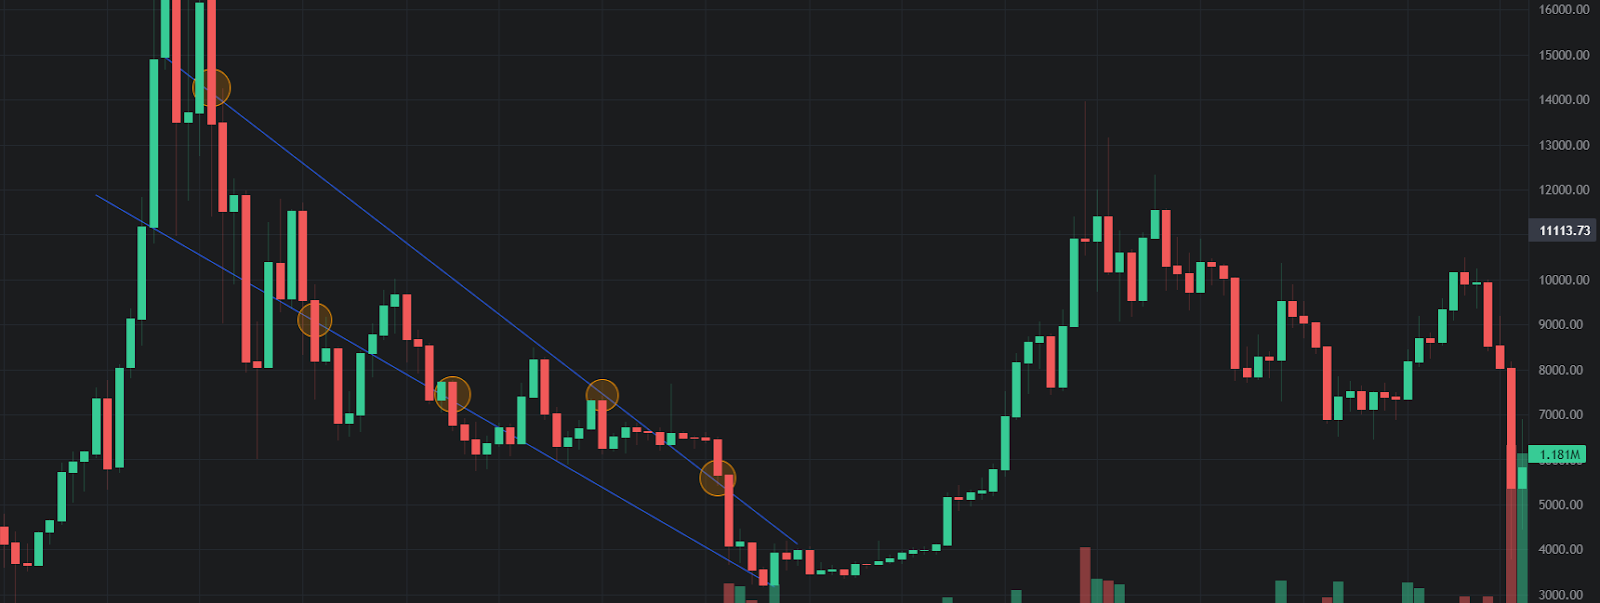
A channel is formed by drawing two parallel trendlines that connect the swing highs and lows of an asset's price movements.
Channels can help traders determine when to enter and exit trades, as well as set price targets and stop-loss levels. For example, a trader can buy an asset when it reaches the lower channel line (support) and sell it when it reaches the upper channel line (resistance), assuming that the price will bounce back within the channel.
Alternatively, a trader can trade the breakout of the channel, which indicates a possible trend reversal or continuation. A breakout occurs when the price closes above or below the channel lines for at least two consecutive times.
Types of Channel Lines
Ascending channel
An ascending channel line is formed when the price of a cryptocurrency consistently rises within a defined upward trend. You simply connect the higher lows and higher highs to create a channel that represents the price range. The support line connects the higher lows, while the resistance line connects the higher highs.
Ascending channel lines indicate a bullish trend, suggesting that buyers outweigh sellers. Traders often look for opportunities to enter long positions when the price bounces off the support line, aiming to ride the upward momentum.
Descending channel
A descending channel line forms when a cryptocurrency’s price consistently declines within a defined downward trend. You draw two parallel lines that connect the lower highs and lower lows. The upper line is the resistance level, and the lower line is the support level.
Descending channel lines indicate a bearish trend, suggesting that sellers overpower buyers. Traders may consider shorting the cryptocurrency when the price hits the resistance line, aiming to capitalize on potential price declines.
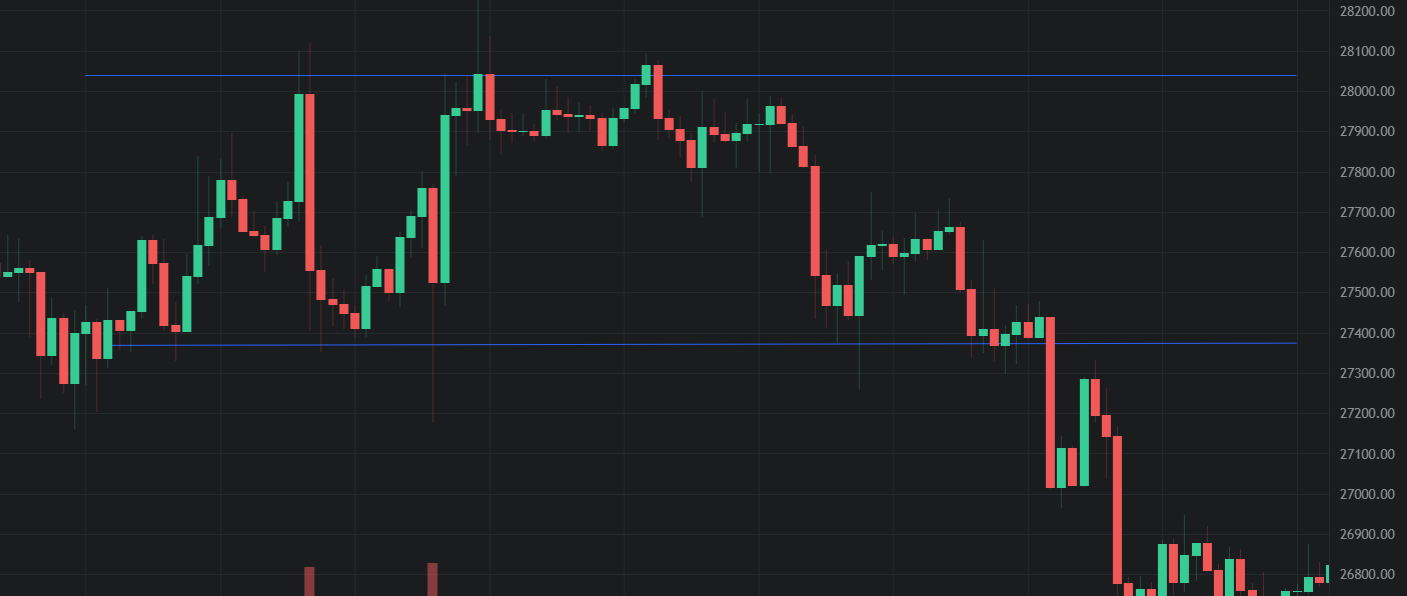
Horizontal channel
Horizontal channel lines, also known as consolidation or range-bound channels, occur when the price of a cryptocurrency remains relatively flat within a defined range. Traders draw two parallel lines that connect the swing highs and swing lows, creating a channel that encapsulates the price action
Horizontal channels indicate a period of indecision in the market, with neither buyers nor sellers holding a significant advantage. Traders often employ range-bound trading strategies, buying at the lower boundary and selling at the upper boundary.
How to Use Channel Lines in Trading
Now that you have a basic understanding of what channel lines are, let's explore how to use them effectively in your trading strategies.
1. Identify the trend
First, you need to identify the trend’s direction on the chart. Check the slope of the lines and the way the price interacts with them, so you can quickly determine whether an asset is in an uptrend, downtrend, or trading sideways. This information is invaluable for making decisions on whether to buy, sell, or hold your positions.
For example, if the price is moving within an upward channel, it indicates that the buyers are in control and the trend is bullish. If the price breaks below the lower channel line, it may signal a trend change or a correction.
2. Find support and resistance levels
Channel lines are excellent tools for pinpointing support and resistance levels. The lower line of an ascending channel represents the support level (the area where the price has historically bounced back up), while the upper line acts as resistance (the area where the price has historically struggled to break through).
In a descending channel, it's the opposite, with the upper line as support and the lower line as resistance. These levels can help you set entry and exit points for your trades.
3. Draw the trendlines
Once you have identified the support and resistance levels, you can draw trendlines connecting the highs and lows of the price movement within these levels. Draw a straight line that connects the highs and extend it to the right. This is your resistance line.
Draw another straight line that connects the lows and extend it to the right. This is your support line.
4. Identify the channel
A channel line is formed of two trendlines. Check if the trendlines are parallel and examine if the price continues to respect the upper and lower boundaries over a period of time. This will help you validate the channel line. The area between the two trendlines is the channel where prices are likely to move.
5. Combine channel lines with other indicators
Crypto traders often combine channel lines with other technical indicators like Moving Averages, Relative Strength Index (RSI), and Stochastic Oscillator. These additional tools provide a more comprehensive view of the market and enhance the effectiveness of channel lines.
For instance, if the price is moving within an upward channel, you can use:
- a moving average to confirm the trend direction
- an oscillator to identify overbought and oversold conditions
- a Fibonacci retracement to measure the depth of a pullback
- a support level to find a bounce point
6. Manage risks
Risk management is a critical aspect of trading, and channel lines can help you in this process. You can use these lines to set stop-loss orders, preventing significant losses when the price moves against their position. This level of control is essential for preserving your trading capital.
One general recommendation would be to place a stop-loss above the upper channel line, and a take-profit below the lower channel line.
Channel Lines in Crypto Trading Strategies
Two common strategies that involve the use of channel lines are often used in crypto trading: the breakout trading strategy and the bounce trading strategy.
Breakout Trading Strategy
With the breakout trading strategy, traders aim to capitalize on significant price movements that occur when the price breaks out of a defined channel. When using this strategy, look for a clear breakout above the upper channel line or below the lower channel line, indicating a potential upward or downward trend.
You should typically set your entry orders just above the upper channel line for a bullish breakout or just below the lower channel line for a bearish breakout. This allows you to enter the trade once the breakout has been confirmed, reducing the risk of false breakouts.
Place stop-loss orders slightly below the breakout point to protect against potential reversals and manage risks. Additionally, you may use technical indicators, like the Average True Range (ATR), to determine their profit target, ensuring they capture a reasonable portion of the price movement.
Bounce Trading Strategy
Within the bounce trading strategy, you can profit from price reversals that occur when the price reaches the upper or lower channel line. This strategy assumes that the price will tend to "bounce" off these levels and retrace towards the opposite side of the channel.
Set your entry orders near the upper channel line for a short trade or near the lower channel line for a long trade. The idea is to anticipate that the price will reverse once it touches or approaches these levels, providing an opportunity to profit from the retracement.
Once again, risk management is crucial when using this strategy, so it’s recommended to set your stop-loss orders slightly beyond the channel lines to avoid getting stopped out by minor price fluctuations. Moreover, you can profit targets at the opposite channel line or based on key support and resistance levels, so you can secure your gains before the price potentially reverses again.
Limitations of Channel Lines
Like any technical analysis tool, channel lines have their limitations, like:
- they’re subjective and may vary depending on how a trader draws them; different traders may use different time frames, data points, and methods to draw channel lines, resulting in different interpretations and signals. For example, some traders may use closing prices to draw channel lines, while others may use highs or lows. Some traders may use linear scales to draw channel lines, while others may use logarithmic scales.
- they’re not always reliable and may fail to capture the true market dynamics; sometimes, the price may break out of a channel line temporarily, only to return back into it later. This is known as a false breakout or a whipsaw, and it can cause traders to enter or exit trades prematurely or miss out on opportunities. Other times, the price may move sideways or range-bound within a channel line for an extended period, resulting in no clear signals or trends.
- they may not work well in all market conditions or for all trading styles; for example, channel lines may be more suitable for swing traders or position traders than for day traders or scalpers, who may need more frequent and precise signals.

Conclusion
Channel lines offer numerous advantages for trend identification, support and resistance levels, risk management, and trade execution. However, be aware of their limitations, like the potential for false breakouts, and the need for constant monitoring.
Combine them with other technical and fundamental analysis tools for a well-rounded trading strategy and to make the most of channel lines.