Crypto traders rely on various tools and indicators to make informed decisions in the volatile cryptocurrency market. One such tool that plays a crucial role in their analysis is trend lines. These lines help traders identify the direction in which a particular cryptocurrency is moving over a given period of time.
At Altrady, we've helped thousands of crypto traders use trend lines effectively as part of their trading strategies. This guide provides a practical, in-depth look at how to draw, interpret, and trade trend lines in the cryptocurrency market

Understanding Trend Lines
Trend lines are visual representations of price movements in the cryptocurrency market.
They’re essentially lines drawn on a price chart to connect the highs or lows of a price movement, forming a trend.
Trend lines can be drawn on any time frame, from minutes to months, depending on your trading style and objectives.
These lines help traders identify the direction in which an asset is moving and determine potential levels of support and resistance.
How to Draw Trend Lines Correctly to Identify Market Trends
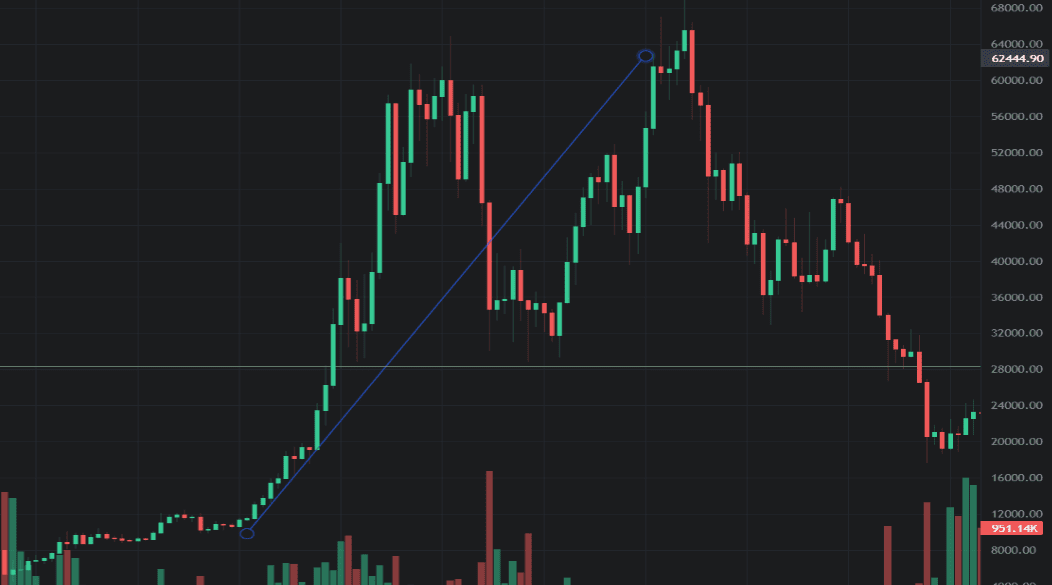
A trend line is a visual representation of the direction and strength of a market's movement over a given period.
By plotting connecting lines between consecutive swing highs or swing lows, you’ll get a clear picture of whether the market is trending upwards (bullish) or downwards (bearish).
By recognizing and understanding these trends, you can align your strategies accordingly. For example:
- During an uptrend, you may choose to enter long positions or hold onto existing investments.
- During a downtrend, you might consider short-selling or adopting a more cautious approach.
Some elementary concepts to bear in mind when drawing trend lines refers to spotting higher highs/higher lows and lower lows/lower highs. These price swings are the core structure of a valid trend.
Alongside the trend structure, the highs and lows leave footprints to identify key levels. So when analyzing a trend and drawing trend lines around it, these levels can validate a solid trend since they serve as points of reference to join the line over them.
Following the paragraph above, trader can identity market trends correctly as follows:
- Uptrend: By spotting higher highs and drawing lines connecting the higher lows (at least two or three touches).
- Downtrend: By spotting lower lows and drawing lines connecting the lower highs (at least two or three touches).
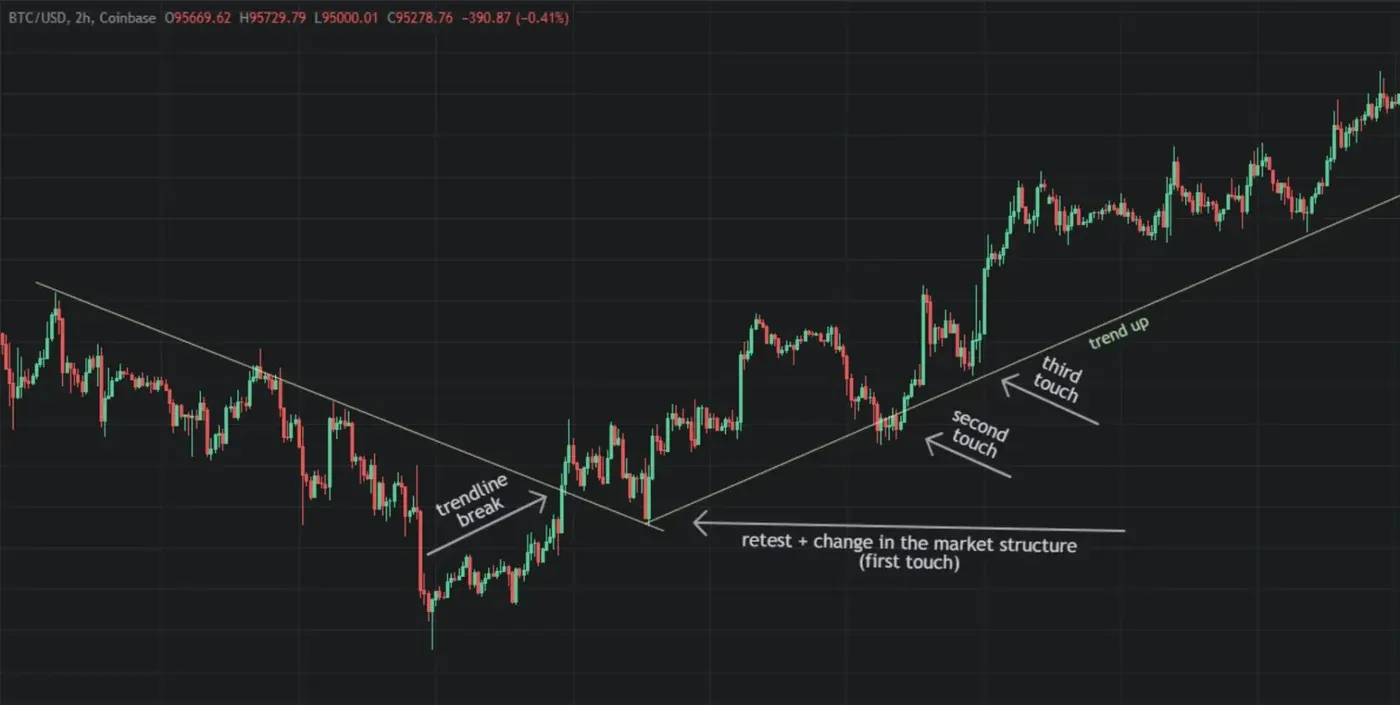
Interpreting Trend Line Breaks
When a trend line break occurs, it often implies the previous key price level has been broken as the trend shows signals of weakening momentum.
A trend line break also implies a potential shift in momentum (trend reversal) from the current direction towards the opposite.
In this sense, one of the most reliable confirmation of an upcoming trend reversal is a significant change in the market structure. For instance, when the latest support becomes resistance or resistance becomes support.
Additional confirmation techniques following a trend line breakout include:
- Increased volume on the breakout.
- A retest of the broken trend line.
|
Altrady's charting tools make it easy for traders to draw accurate trend lines and exploit pullback trading strategies. |
How Do Trend Lines Help in Crypto Trading
Trend lines can help you identify trading opportunities in several ways. Here are some of the most common ones
Determine Support and Resistance Levels
In addition to identifying trends, trend lines help you determine critical support and resistance levels within the market.
Support levels refer are those price levels at which the buying pressure is expected to outweigh selling pressure, potentially leading to a price increase.
On the other hand, resistance levels are price levels where selling pressure tends to exceed buying pressure, often resulting in price declines.
By drawing trend lines that connect significant swing highs and lows, you’ll find these support and resistance levels more easily.
This information allows you to make more informed decisions about when to buy or sell a particular cryptocurrency.
For instance, if a trend line shows a strong resistance level being tested multiple times, you might anticipate a price reversal and adjust your strategies accordingly.
Predict Price Movements
Trend lines can also provide valuable insights into future price movements. When properly drawn and interpreted, trend lines can act as predictive indicators, helping you anticipate potential price reversals or continuations.
By analyzing the angle, slope, and breakouts of trend lines, you can make educated predictions about the future direction of a cryptocurrency's price.
Yet, you should keep in mind that trend lines should always be used in conjunction with other technical analysis tools and indicators to validate predictions and reduce the risk of false signals.
Technical analysis requires a holistic approach, considering multiple factors to increase the accuracy of predictions.
Set Entry and Exit Points
Trend lines assist crypto traders in setting entry and exit points for their trades. By analyzing the market trends and identifying support and resistance levels, you can use trend lines to determine optimal points to enter a trade or take profits.
For example, you may wait for a cryptocurrency's price to approach a trend line before entering a long position, as it may indicate a potential bounce or reversal.
Moreover, trend lines can serve as visual aids for setting stop-loss orders, which protect you from excessive losses in case the market moves against your positions.
By placing stop-loss orders just below or above significant trend lines, you’ll effectively manage risk and protect your capital.

Practical Example of Using Trend Lines In the Crypto Market
Here’s how you can use trend lines to identify important support and resistance levels in Ethereum's price movement.
Let’s say you can draw an ascending trend line that connects the higher swing lows of Ethereum's price over a specific period.
When the price approaches this trend line, it often acts as a support level, preventing the price from dropping further.
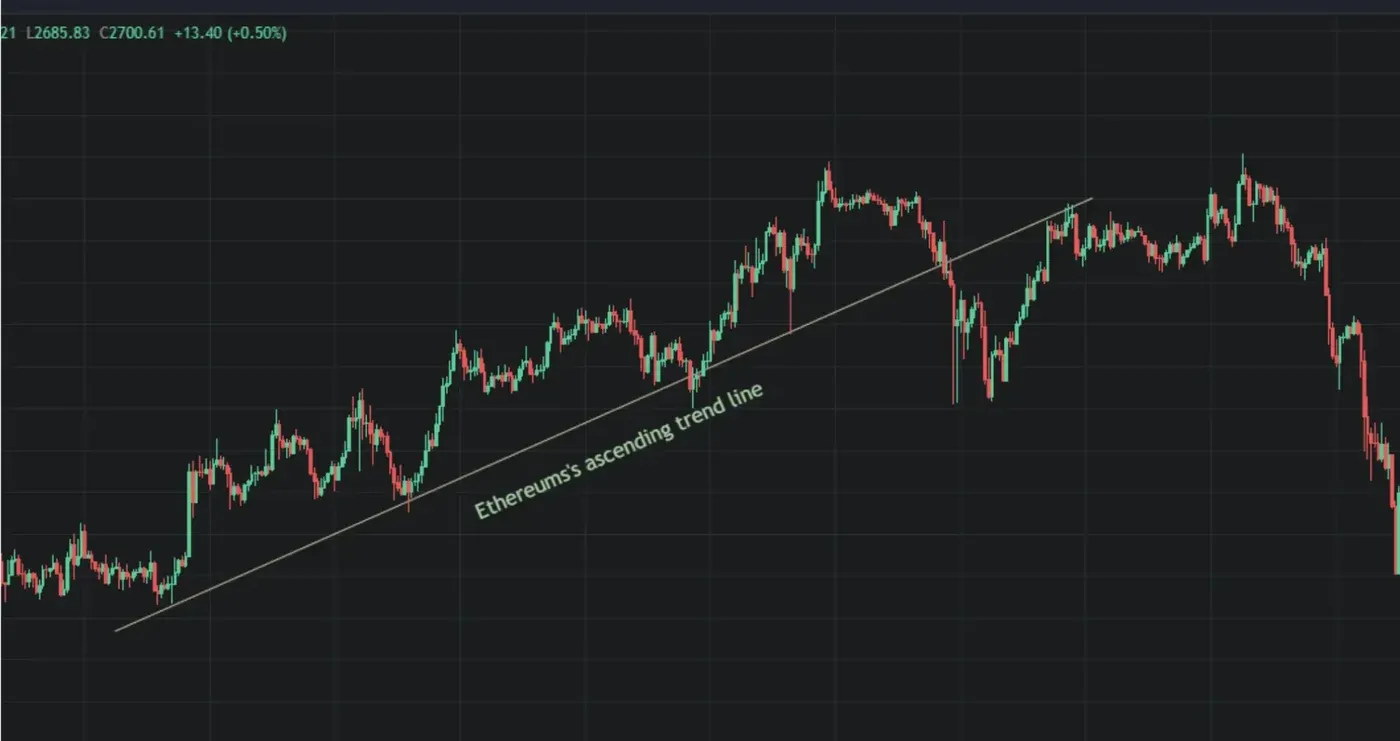
You can rely on this information to make informed decisions, like setting stop-loss orders just below the trend line or considering buying opportunities when the price retraces to the support level.
Conversely, a descending trend line connecting lower swing highs can act as a resistance level. If the price approaches this trend line, it may struggle to break above it, providing traders with a potential selling opportunity or a signal to take profits.
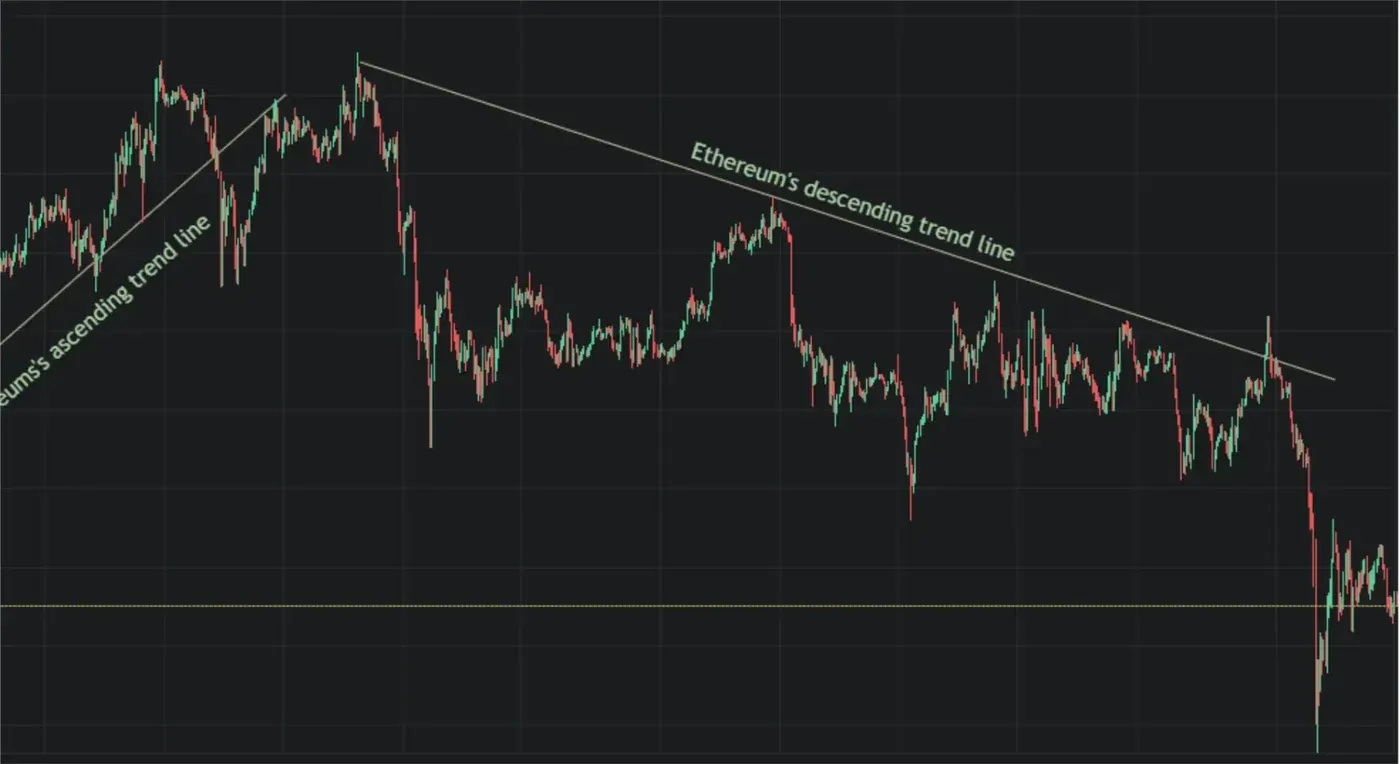
By employing trend lines in your analysis of Ethereum's price chart, you can effectively gauge potential support and resistance levels, so you’ll make more strategic trading decisions. It helps you identify key levels where price reversals or significant movements may occur.
|
Altrady's backtesting and paper trading features allow you to test different trend line trading strategies on historical and current crypto data.. |
Check out our video on Mastering Trend Lines:
Conclusion
By connecting the swing highs and swing lows of a trending market, trend lines provide valuable insights into price movements. They help you find potential support and resistance levels, which you can then use to determine entry and exit points for trades.
Many crypto traders choose to rely solely on trend lines and support and resistance levels to analyze cryptocurrency charts. Yet, it’s best to confirm the indications given by trend lines along with other technical indicators to get a better interpretation of historical data.
So, whether you're a beginner or an experienced trader, incorporating trend lines into your trading strategy can enhance your chances of success in the crypto market.