Candlesticks are easy to read and use. They also offer plenty of valuable information, like an asset's future price movements and market sentiment. That’s why they’re a powerful tool not just in financial analysts’ arsenal but for market participants and traders alike.
When it comes to cryptocurrencies, candlesticks can help you spot patterns and unlock profitable trading strategies.
Read on and find out everything about candlesticks and what exactly they reveal on a chart.
Defining Candlesticks Patterns Indicator
Originally, candlesticks were strongly linked with the supply and demand of rice back in the 1700s. The major discovery was that traders’ emotions highly influence markets, which ultimately reflects commodities or assets’ prices.
Today, candlestick charts show that emotion by visually representing price movements with different colors. They’ve become a fundamental tool in technical analysis, helping traders make price predictions.
Candlesticks focus on historical data, and trading volume, and reveal common, repeating patterns that ultimately signal a downtrend, an uptrend, or a reversal in price movement.
As opposed to bar charts that show the same information, candlestick charts offer clues much easier and quicker due to the color coding of the price bars and thicker real bodies.
A Candlestick’s Anatomy
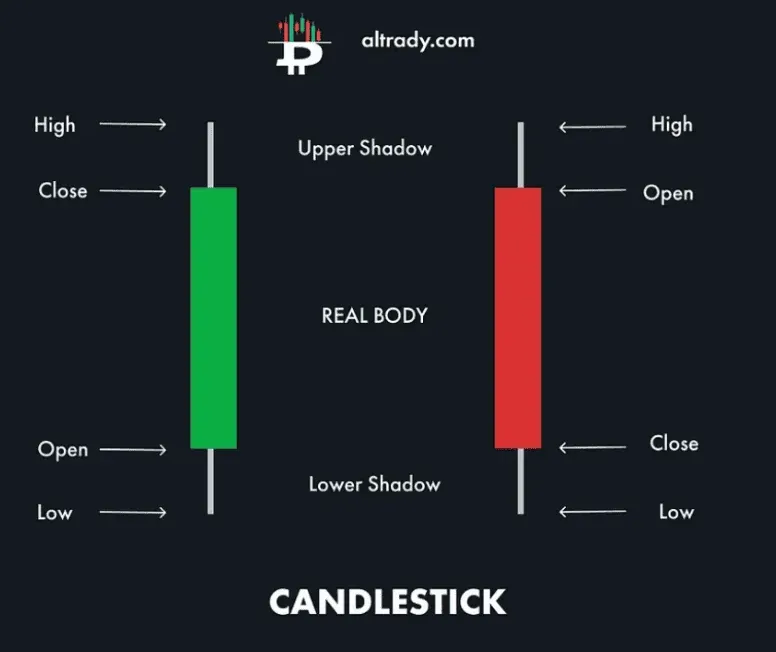
A candlestick consists of four main components:
- Open: The opening price at the beginning of a specific time period (e.g., an hour, a day, a week).
- Close: The closing price at the end of the same time period.
- High: The highest price reached during that time period.
- Low: The lowest price reached during that time period.
The difference between the open and close prices forms the body of the candlestick. If the close price is higher than the open price, the body is usually colored green or white, indicating that the asset gained value in the interval.
If the close price is lower than the open price, the body is usually colored red or black, indicating that the asset lost value in the interval.
The lines that extend above and below the body are called shadows or wicks. They represent the price range that the asset traded in beyond the open and close prices. The upper shadow shows the highest price that the asset reached in the interval, while the lower shadow shows the lowest price that the asset reached in the interval.
At a high level, this is how you should read candlesticks:
- Long white or green candlesticks reveal strong buying pressure, hinting that the price is bullish.
- Long black or red candlesticks indicate significant selling pressure, suggesting the price is bearish.
A popular time frame for candlesticks is the daily bar, so you can analyze and understand the open, close, and high and low for the day.
Candlesticks Pros and Cons
Pros
- They can show the direction, strength, and volatility of the price movement in a clear and visual way. They can help traders and investors spot trends, reversals, continuations, and patterns more easily than other types of charts.
- They can indicate the emotional state of the market participants, like fear, greed, optimism, or pessimism. They can reveal the balance of power between buyers and sellers, and the level of conviction or indecision in the market.
- You can combine candlesticks with other technical analysis tools, including indicators, oscillators, moving averages, trend lines, support and resistance levels, Fibonacci retracements, and chart patterns. They can enhance the accuracy and reliability of the analysis and provide more confirmation signals.
Cons
- Candlesticks aren’t predictive 100%. They only reflect the past price action and don’t guarantee future outcomes. That’s why they should never be used in isolation or as a sole basis for trading or investing decisions.
- Candlesticks are subjective. Different traders and investors may interpret the same candlestick differently depending on their personal preferences, experience, knowledge, and biases. They may also use different time frames, settings, and criteria to define and identify candlestick patterns. There is no universal agreement on a valid or reliable candlestick signal.
- Candlesticks are lagging. They only show the price action after it has happened and don’t capture the market’s real-time dynamics. They may miss some important information or events that affect the price movement, like news, announcements, rumors, or unexpected shocks. They may also give false or misleading signals in some situations, such as low liquidity, high volatility, or market manipulation.
Conclusion
Candlesticks are the easiest indicators to look for. Their visual representations of price action offer valuable insights into trends and potential reversals. To harness the full potential of candlestick patterns, it's crucial to practice, so you can recognize the nuances, and unlock more insights by combining them with other technical analysis indicators.