Candlestick charts provide valuable insights into market trends and help traders make informed decisions. They’re a popular tool used in technical analysis to analyze price movements in the financial realm, including cryptocurrency markets.
Here’s everything you need to know about candlestick charts and how they can help you improve your trading skills and your overall success in the crypto market.
What Are Candlestick Charts
Initially, candlestick charts were used to track the price fluctuations of rice in the Osaka rice market back in the 18th century. Over time, they became a universal tool in financial analysis as their easy-to-spot visual cues provide valuable information about market sentiment.
Today, candlestick charts are a graphical representation of price movements of financial instruments, like stocks, currencies, or commodities. These charts contain a series of candles, each representing a specific time frame. (e.g., a day, an hour, or a minute).
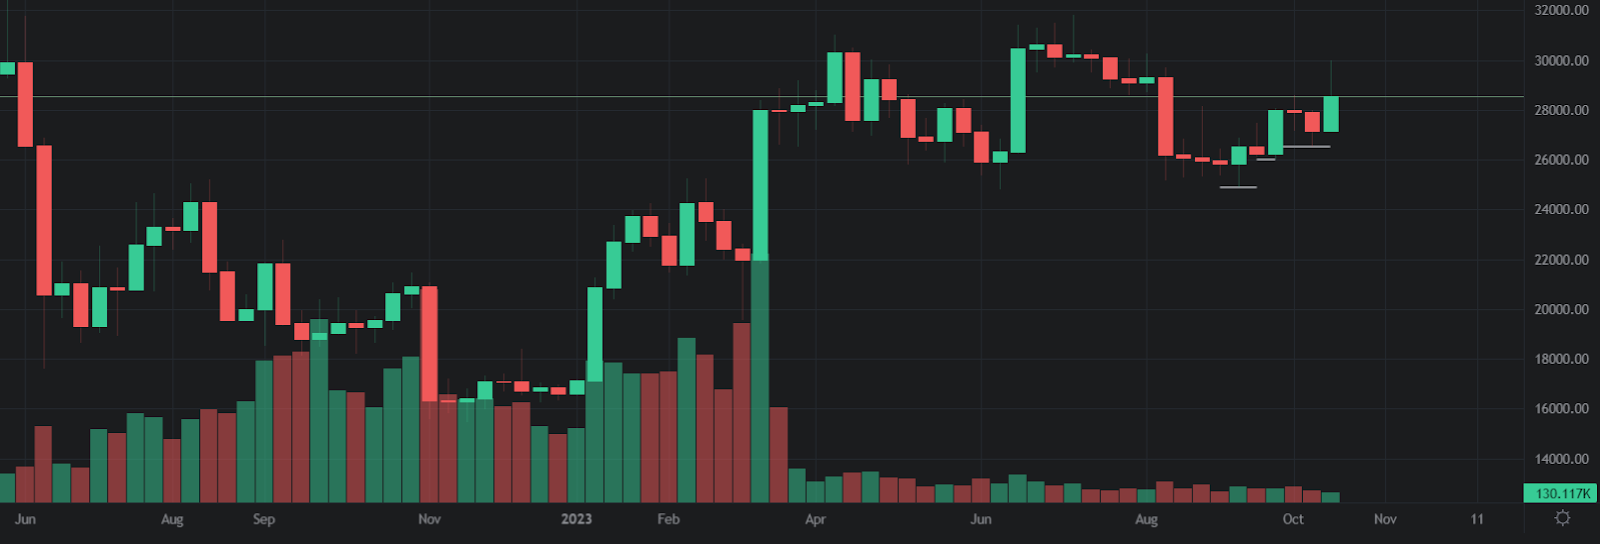
Each candle has four components: the open, high, low, and close prices of the period. The open price is the price at the beginning of the period, and the close price is the price at the end of the period. The difference between the open and close prices forms the body of the candle.

The body can be either:
- green: if the close price was higher than the open price, indicating a bullish (upward) movement;
- red: if the close price was lower than the open price, indicating a bearish (downward) movement.
The difference between the high and low prices forms the candle’s shadow or wick. The shadow can extend above and below the body, showing the range of price fluctuations during the period.
Traders and investors use them whenever they want to analyze market trends and identify trading opportunities. For example, a long green body with short shadows indicates strong buying pressure and confidence, while a long red body with short shadows indicates strong selling pressure and fear. A short body with long shadows indicates uncertainty and indecision, as neither buyers nor sellers have control over the market.
You can find over 30 types of candlestick patterns divided into:
- Bullish candlestick patterns: Hammer, Bullish Engulfing, Morning Star, Bullish Harami, etc.
- Bearish candlestick patterns: Dark Cloud Cover, Bearish Engulfing, Three Black Crows, Bearish Harami, etc.
- Continuation candlestick patterns: Doji, Spinning Top, Ascending Triangle, Descending Triangle, etc.
Benefits of Candlestick Charts
Using candlestick charts has three key benefits for crypto traders and investors:
Visual Representation of Price Action
Candlestick charts provide a clear and visually appealing representation of price action in the cryptocurrency markets. Each candlestick on the chart reveals information about the opening, closing, high, and low prices within a specific time period. The body of the candlestick is filled or hollow, indicating whether the closing price was higher or lower than the opening price.
The visual nature of candlestick charts makes it easier for traders to quickly interpret and analyze price movements. Patterns and trends can be easily identified by observing the shape, color, and position of the candlesticks on the chart. This visual representation helps traders gain insights into market sentiment and the overall supply and demand dynamics.

Ability to Identify Trend Reversals
By closely observing the patterns formed by the candlesticks, traders can anticipate potential changes in market direction. Certain candlestick patterns, like doji, engulfing patterns, and hammer, can signal a potential reversal or a pause in the current trend.
These reversal patterns provide traders with valuable signals to enter or exit trades at suitable moments. If you spot trend reversals early on, you can capitalize on profitable opportunities and minimize losses.
Enhanced Decision-Making in Trading
Candlestick charts empower traders with the information needed to make informed and confident trading decisions. The visual nature of candlestick patterns, along with their historical significance, helps traders understand market psychology and sentiment. This understanding allows traders to gauge the strength of a trend, identify potential support and resistance levels, and assess the risk-reward ratio of a trade.
With the help of candlestick charts, traders can develop effective trading strategies and improve their overall decision-making process. By combining candlestick analysis with other technical indicators and fundamental analysis, traders can make more accurate predictions and increase their chances of success in the financial markets.
How to Use Candlestick Charts Effectively – Helpful Tips
Candlestick charts are powerful tools that can help traders analyze and predict market movements.
Check out a few tips you should keep in mind to make the most of candlestick charts:
Understand the Market Context
Before diving into analyzing candlestick patterns, it's important to first understand the overall market context. Consider factors like market trends, support and resistance levels, and key news events that may impact the market. If you have a broader perspective on the market, you can better interpret the signals provided by candlestick patterns.
When analyzing candlestick charts, look for patterns that align with the prevailing market trend. For example, in an uptrend, focus on bullish reversal patterns like hammer or engulfing patterns. Similarly, in a downtrend, pay attention to bearish reversal patterns like shooting star or bearish engulfing patterns. Understanding the market context will help you identify high-probability trading opportunities.
Combine with Other Technical Indicators
While candlestick charts can provide valuable insights on their own, they are even more powerful when combined with other technical indicators. Use a combination of indicators, so you can confirm the signals provided by candlestick patterns and increase the accuracy of your trading decisions.
Consider incorporating indicators like moving averages, relative strength index (RSI), or stochastic oscillator alongside your candlestick analysis. These indicators can help you confirm trend reversals, identify overbought or oversold conditions, and provide additional insights into market dynamics. The combination of candlestick patterns and technical indicators can provide a comprehensive view of market conditions and potential trading opportunities.
Practice Proper Risk Management
No trading strategy is complete without proper risk management. While candlestick charts can provide valuable insights, they’re not foolproof and don’t guarantee successful trades. It's essential to always consider the potential risks involved and manage your positions accordingly.
When using candlestick charts in your trading strategy, set clear entry and exit points based on your analysis. Use stop-loss orders to limit your losses in case the market moves against your expectations. Additionally, consider position sizing based on your risk tolerance and the volatility of the market. If you practice proper risk management, you can protect your capital and increase your chances of long-term trading success.
Conclusion
Whether you're a day trader, a swing trader, or a long-term investor, integrating candlestick chart analysis into your strategy can be a game-changer.
Remember that candlestick charts are just one piece of the puzzle and should be used in conjunction with other technical analysis indicators. Additionally, it takes time and practice to become proficient in reading and interpreting candlestick charts effectively. So, study and familiarize yourself with the different patterns, and start incorporating candlestick analysis into your trading strategy.