Bar charts visually represent market price movements and help you identify market patterns and trends much more easily. Furthermore, these insights can boost your understanding of the market dynamics and make more accurate predictions about potential price trends, reversals, or breakouts.
Here’s a closer look at the four types of bar charts, their benefits, and how they can help you increase your chances of success in the dynamic world of crypto markets.
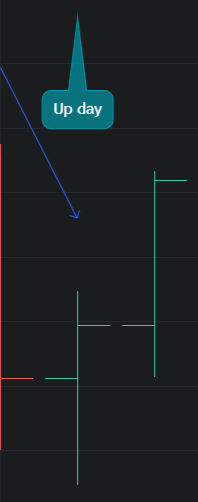
Up Days Bar Charts
As the name suggests, up days refer to the periods where the closing price of an asset or security is higher than its opening price. This is usually represented by a specific color, often black or green. The bar for that period will have a small horizontal line on the left marking the opening price and another on the right marking the closing price. If the line on the right (the closing price) is higher than the line on the left (the opening price), it indicates that the price has increased during that period, hence an “up day.”
This color coding helps you see trends and price movements more clearly, in this case, a visual cue of bullish sentiment in the market.
The benefits of up days in analyzing bar price charts include:
Identify trends: by analyzing the frequency and magnitude of up days, you can determine the strength of a bullish trend; consistently increasing up days may suggest a strong and sustainable upward price movement, while sporadic or diminishing up days could indicate a weakening trend.
Understand market sentiment: up days indicate that buyers are actively participating in the market and are willing to pay higher prices for the security; this reflects positive market sentiment and can be an early indicator of potential price appreciation. By understanding the market sentiment, you can gauge the overall enthusiasm and confidence in a cryptocurrency.
Find entry and exit points: up days can offer potential entry points for traders looking to initiate long positions or add to existing positions; by studying the pattern of up days and their corresponding trading volumes, traders can identify optimal entry points when the security is showing strength and upward momentum. Similarly, analyzing up days can also help determine suitable exit points or profit-taking opportunities.
Confirm support levels: up days can confirm the presence of support levels in a security's price chart; if a crypto asset consistently experiences up days near a particular price level, it suggests that there’s buying interest and demand at that level. This can be valuable information for traders looking to set their stop-loss orders or identify levels of potential price reversals.

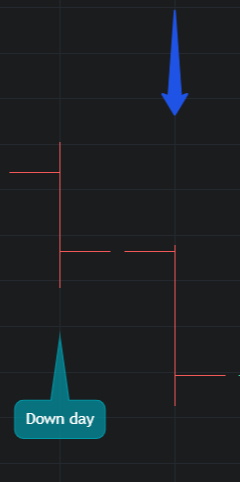
Down Days Bar Charts
Down days in bar price charts refer to the days when the closing price of a security is lower than the previous day's closing price. These downward movements are visually represented as red or bearish bars on price charts. They indicate a decrease in market value and are often associated with selling pressure and negative market sentiment.
Identifying down days on bar price charts is relatively straightforward. Visual cues like red or bearish bars, usually placed below the corresponding high of the day, indicate a down day. Traders often use various technical indicators, like moving averages or trendlines, to confirm these patterns and determine the intensity of the downward movement.
In technical analysis, down days provide valuable insights into market dynamics. Traders and investors analyze these patterns to anticipate potential market reversals or continuation of downtrends.
Some key benefits when interpreting down days include:
Confirm a downtrend: down days can validate the existence of a bearish trend; when consecutive down days occur, it suggests sustained selling pressure, indicating that the market might continue moving downward.
Analyze volume: paying attention to trading volume during down days can provide additional clues about market sentiment; higher-than-average volume on down days implies increased selling pressure and a stronger conviction among market participants.
Identify support and resistance levels: down days can help identify key support and resistance levels; if the price breaks through a significant support level on a down day, it could indicate a potential shift in market sentiment and the possibility of further declines.
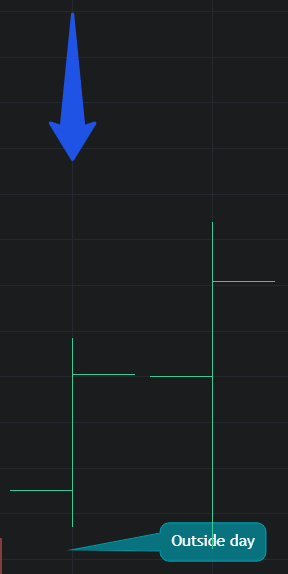
Outside Days Bar Charts
On a bar chart, outside days represent those days where a security’s price is more volatile than the previous day. On an outside day, a crypto asset’s price shows a higher high and a lower low than the previous day.
Outside days are a two-day price pattern; the difference between the open and close on the second day is larger than the first day when the open and close on the second day are outside the range of the first day.
Market technicians and swing traders often look at outside days to analyze short-term price patterns that play out over several days or weeks.
Identifying outside days
Outside days tend to exhibit several characteristics that make them stand out in bar price charts. These include:
- Wide range: outside days are typically characterized by a significantly larger trading range than the previous day, indicating increased volatility and potential market indecision.
- Strong close: outside days often close near the opposite end of the trading range, suggesting a possible reversal of the prevailing trend. A close near the low of the day's range may indicate a bearish sentiment, while a close near the high may suggest a bullish sentiment.
The benefits of outside days in bar price charts include:
Spot potential trend reversals or continuations: by breaking previous high and low levels, outside days signal a shift in market sentiment; traders often interpret an outside day as a sign of increased uncertainty and possible upcoming price movement.
Uncover important levels of support and resistance: once an outside day has been identified, the high and low of that day can act as key price levels where traders look for potential breakouts or pullbacks.
Get insights into volatility and market sentiment: outside days represent elevated levels of volatility compared to regular trading days; the wide price range indicates increased market uncertainty and conflicting forces at play. This heightened volatility can be an indication of a shift in market sentiment or the presence of important market-moving events.
Recognize price gaps: in some situations, the current day's opening price is higher than the previous day's high or the current day's closing price is lower than the previous day's low; this noticeable difference between the opening price of one bar and the closing price of the previous bar are price gaps that often also suggest increased market volatility.
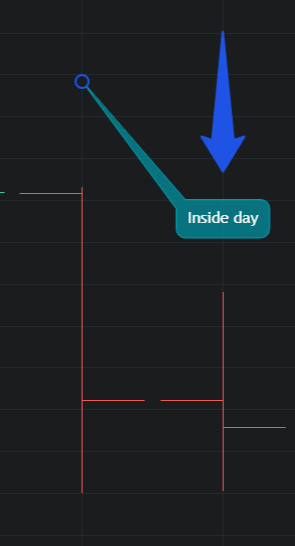
Inside Days Bar Charts
An inside day is a two-bar chart formation where the low is higher than yesterday’s low and today’s high is lower than yesterday’s high. In other words, all price action of an inside day is inside the price action of yesterday.
Inside days are common and on a daily chart, they may occur several times per month in many crypto assets. An inside day shows that volatility has dropped from the prior day and the market is taking a pause. This is why the pattern is often considered a continuation pattern; following the inside day, the price will often continue moving in the same direction after the pattern as it did before.
The benefits of inside days in bar price charts include:
Analyze market sentiment
Although usually a continuation pattern, you can also interpret an inside day as market indecision. This indecision can potentially foreshadow a reversal, but it can just as easily signify a momentary pause in the ongoing market trend. To assess the extent of this indecision, one can gauge it by examining the relative range of the inside day. If the range is only marginally smaller than the range of the previous day, it hints at a minor hesitancy. However, if the range of the inside day significantly shrinks in comparison to the previous day, it strongly implies a deep-seated uncertainty.
Fine-tune entry and exit points
Inside days provide traders with a valuable opportunity to fine-tune their entry and exit points. When an Inside Day appears after a significant price movement, it often indicates a temporary pause in the market. This pause allows traders to enter positions at more favorable prices or exit positions before potential reversals. This precision in timing can significantly improve the overall profitability of a trading strategy.
Uncover breakout opportunities
While inside days often indicate consolidation, they can also serve as a precursor to breakout opportunities. Traders who identify inside days can prepare for potential price breakouts in the direction of the previous trend. This allows them to position themselves strategically to capture significant market movements, thereby maximizing profits.

Conclusion
Up days, down days, inside days, and outside days can be seen as opportunities to capitalize on price declines and potentially generate profits. However, it’s important to note that any type of bar chart alone cannot predict future market movements with certainty.
By combining other technical indicators like the Relative Strength Index (RSI) or Moving Average Convergence Divergence (MACD), and conducting thorough research, you can enhance your understanding of crypt markets and develop effective trading strategies. Furthermore, keeping a close eye on market news and economic events can provide additional context and help traders interpret the reasons behind these four types of bar charts.