If you recently started your journey in trading cryptocurrencies, terms like price breakout or broken support level may leave you puzzled. They’re both related to support and resistance reversal, which is all about identifying trend reversals by doing simple technical analysis.
Read on and uncover the basics of support and resistance levels and their intriguing role reversal. You’ll find out how you can use this strategy in any market and time frame, and how it can help you gain valuable insights into market dynamics.

What Is Support and Resistance Reversal
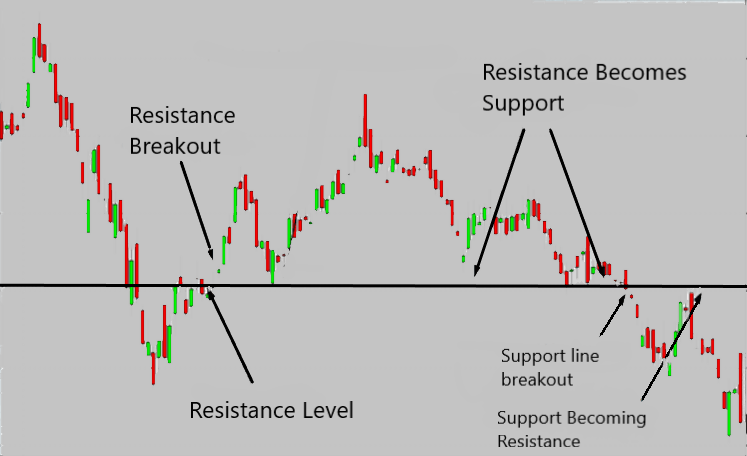
A support and resistance role reversal is when support becomes resistance or vice versa because these levels are broken. When the price breaks through a support or resistance level and keeps its direction creating a new trend, is called a breakout. When the price breaks through a support or resistance level and then goes back to its original range it’s called a reversal.
Here’s how that happens:
- if the price breaks below a support level, that level can become a new resistance level; traders who missed the initial opportunity to buy at the support level may now want to sell when the price revisits that level. This psychological shift creates a resistance zone.
Or
- if the price breaks below a support level, that level can become a new resistance level; the market's sentiment has changed, and traders may view this level as a buying opportunity. Crypto traders often rely on these newly formed support levels as entry points for their trades.
Let’s take one example:
Imagine the price of Avalanche (AVAX) has been steadily climbing and reaching a support level at $10. At this point, buyers step in and prevent the price from dropping below $10. However, if the crypto asset’s price subsequently breaks through this support level and falls below $10, it now becomes a resistance level. Traders and investors will view this level as a potential barrier, with sellers likely to emerge and prevent the price from rising back above $10.
This is when support has become resistance.
Let's take the same example of Avalanche which reaches a resistance level at $30. At this point, sellers step in and prevent the price from advancing beyond $30. However, if Avalanche’s price breaks through this resistance level and rises above $30, it now turns into a support level. Traders and investors will consider this level as a potential floor, with buyers likely to emerge and prevent the price from falling back below $30.
In this case, resistance has turned into support.
Overall, the concept of support and resistance reversal is based on the idea that once a level is broken, it changes the market sentiment and psychology, and potential trading opportunities.
How to Confirm Breakouts and Reversals
Here’s a simple technique that can help you confirm breakout or reversals:
Evaluate price action in relation to the strength of the support or resistance level.
The interaction between these two factors will determine whether the price will undergo a breakout or a bounce as follows:
- if the momentum (price action) surpasses the strength of the support and resistance zone, you should expect a breakout.
- if the momentum (price action) proves weaker than the support and resistance zone, a bounce or reversal is on the horizon.
Keep in mind not to take these signs as 100% guarantees. You should rather consider them as the rule of thumb when assessing crypto markets.
The Significance of Role Reversal for Traders
Support and resistance reversal are essential tools in a trader's arsenal for several reasons:
-
Identify trend reversals
Support and Resistance Reversal can be a powerful indicator of potential trend reversals. For example, when a strong support level turns into resistance, it may indicate a shift from a bullish to a bearish trend, and vice versa. -
Strategic entry and exit points
By recognizing these reversal points, you can strategically enter and exit trades, maximizing profits and minimizing losses. For instance, if the price breaks below a support level, one can enter a short position and place a stop-loss above the new resistance level. If the price breaks above a resistance level, one can enter a long position and place a stop-loss below the new support level. -
Risk management
Understanding support and resistance reversal can enhance risk management strategies. Traders can set up risk-reward ratios based on the distance between these levels, helping them make informed decisions on position sizing and stop-loss placement. -
Confirm with other technical indicators
Support and resistance reversal can also be combined with other technical indicators or tools, like trend lines, moving averages, Fibonacci retracements, or chart patterns, to confirm the validity and strength of the reversal signals. For example, if the price breaks below a support level and also below a trend line or a moving average, it indicates a stronger bearish signal than if it only breaks below a support level.

Conclusion
Whether you're a novice or an experienced trader, the ability to identify and leverage support and resistance reversal can make a significant difference in your crypto trading journey. Yet, support and resistance reversal isn’t a foolproof method, as sometimes the price can break through a level and then return to its original range without reversing its role. This is called a false breakout. Therefore, it’s essential to use other technical indicators or candlestick patterns to filter out the false signals and avoid whipsaws.
Keep a keen eye on these ever-shifting support and resistance levels, and you'll be well on your way to navigating the unpredictable waters of the crypto markets.