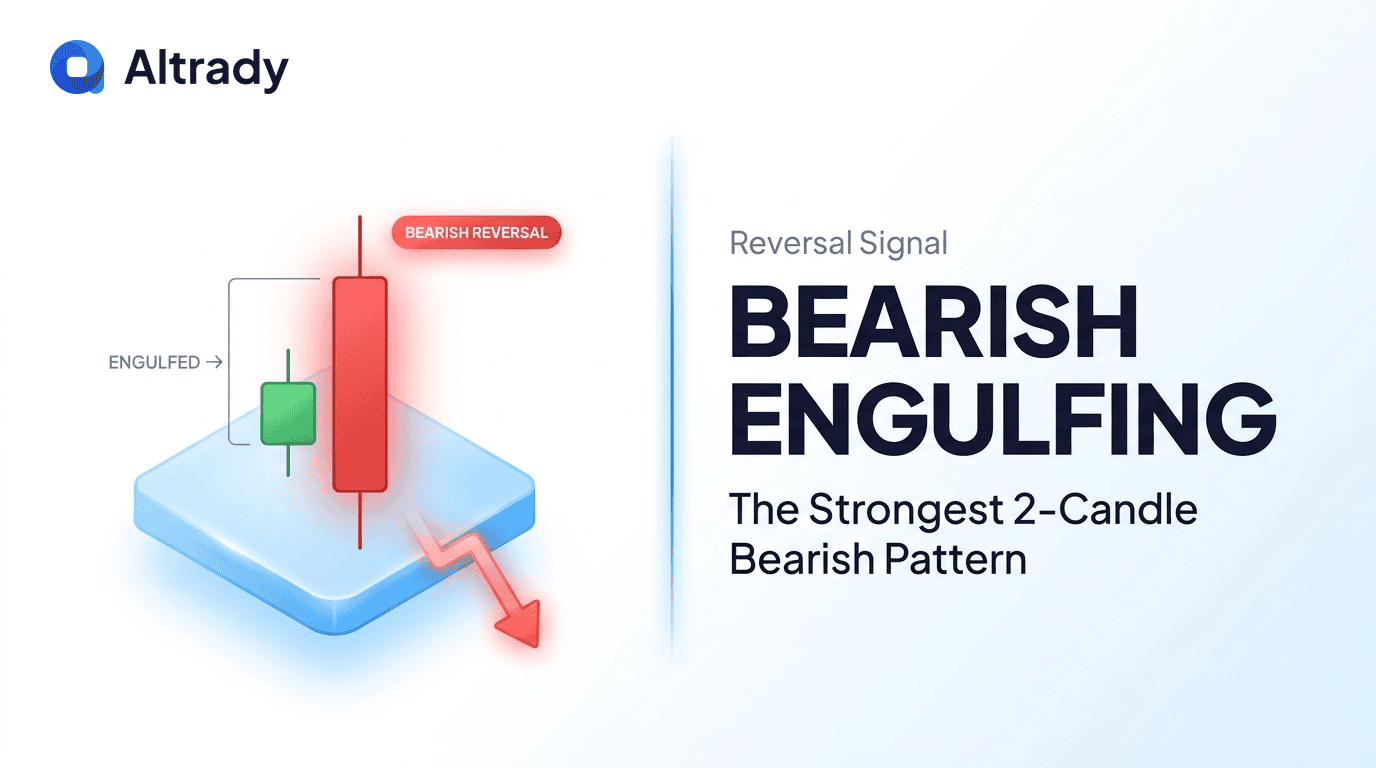
Every experienced trader learns to respect the moment when control of a market flips in a single session. The bearish engulfing pattern is the mirror image of one of the strongest bullish reversals in candlestick analysis, and it often marks the exact point where buyers lose their grip at the top of an uptrend. This guide covers identification, psychology, real trade rules, and practical crypto context so you can act with confidence instead of guessing.
What Is a Bearish Engulfing Pattern?
The bearish engulfing pattern is a two-candle bearish reversal formation that appears at the end of an uptrend or at a significant resistance zone. It consists of a smaller bullish (green) candle followed by a larger bearish (red) candle whose real body fully engulfs the body of the prior candle. When this structure prints in the right location, it signals that sellers have aggressively taken control of price action from buyers.
What makes this formation so respected among technical traders is the speed of the sentiment shift. In just two sessions, the market goes from bullish continuation to full rejection. The engulfing candle is not a polite correction - it is a decisive swing from buying pressure to selling pressure, and it frequently precedes meaningful downside moves.
The bearish engulfing pattern is considered one of the most reliable reversal signals in candlestick analysis, but only when the context is correct. Without a prior uptrend or a clear resistance test, the same two-candle shape is just market noise that should be ignored.
How to Identify a Bearish Engulfing Pattern
Correct identification is the foundation of every trade based on this setup. Misreading the pattern leads to poor entries and unnecessary losses, so the rules need to be strict.
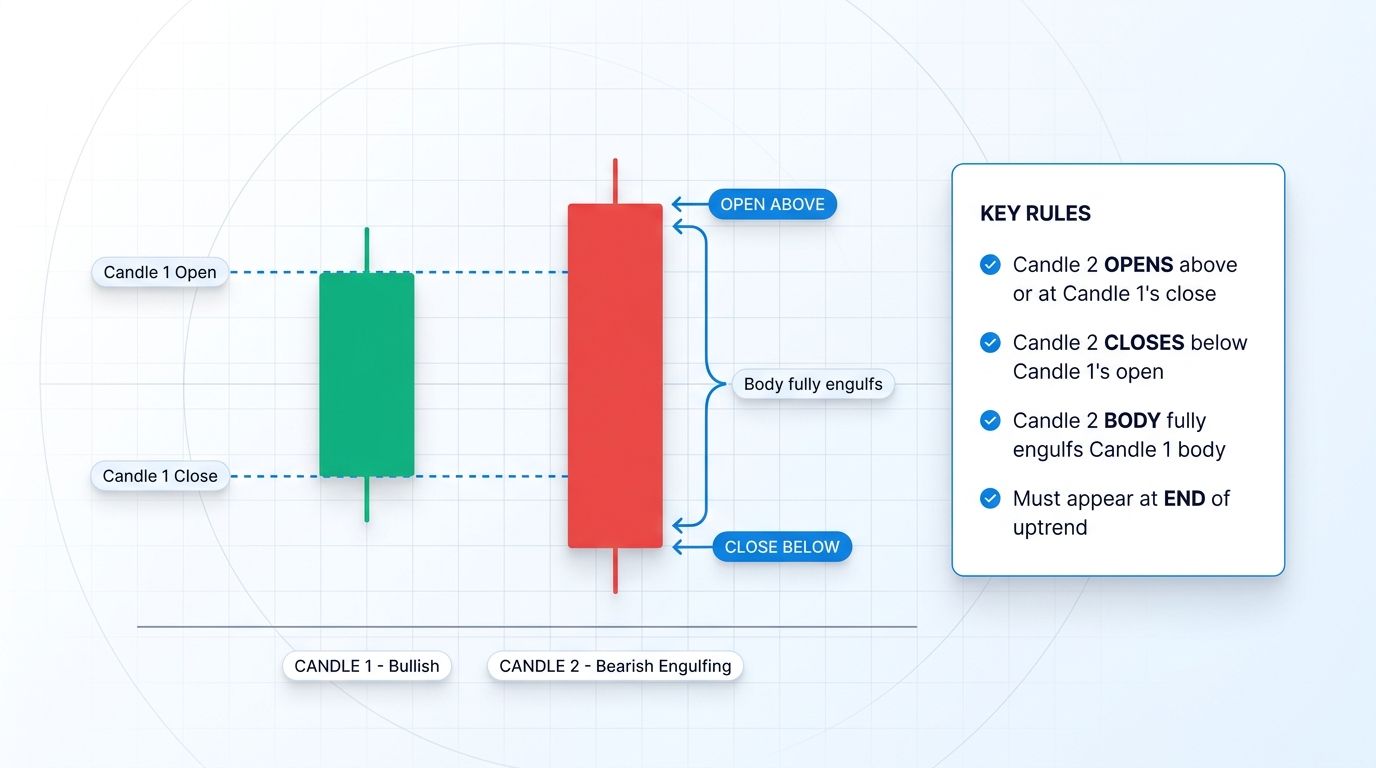
The two-candle structure
A valid bearish engulfing pattern has a very specific anatomy that separates it from weaker reversals.
- Candle 1: a bullish (green) candle that forms inside an established uptrend.
- Candle 2: a bearish (red) candle that opens above or at Candle 1's close and closes below Candle 1's open.
- Candle 2's real body must fully engulf the real body of Candle 1. Wicks can extend in either direction, but the body is what counts for signal validity.
- Candle 2 should have minimal upper and lower wicks, which indicates a strong directional down move rather than indecision.
- The formation must appear at the end of an uptrend or at a well-defined resistance zone.
If any of these conditions are missing, you are not looking at a textbook bearish engulfing pattern and you should not trade it as one.
Key rules
- The larger the engulfing candle relative to recent price action, the stronger the signal. A massive red body dwarfing the prior green candle is far more significant than a barely-larger engulf.
- Higher volume on Candle 2 adds confirmation. Real selling requires real participation.
- A gap up at Candle 2's open strengthens the pattern. This is common in traditional stocks and less common in 24/7 crypto, but occasional gaps do appear after weekend moves or futures opens.
Why the Bearish Engulfing Pattern Works: The Psychology
Candlestick patterns work because they visualize crowd behavior. A bearish engulfing candle shows a dramatic sentiment flip inside a single session. Buyers were still in control going into Candle 2 - that is why price opened higher than the previous close. But once the session began, sellers overwhelmed them and drove price far below where buyers had previously dominated.
This is not indecision. It is not a hesitant pause. It is a clear, visible transfer of market control from bulls to bears. Late buyers who bought near the top are now trapped, and as price drives lower their stops add fuel to the move. Short sellers smell weakness and pile in. Profit-taking from long-term holders accelerates the flush.
Understanding the psychology matters because it tells you why the signal can fail. If the broader trend remains strongly bullish and institutional demand is still active, one session of panic selling can be absorbed quickly. That is why context is everything with the bearish engulfing pattern.
Bearish Engulfing vs Other Bearish Patterns
Several candlestick formations look similar at a glance but carry different signal strength. Knowing the differences stops you from over-reading weaker setups.
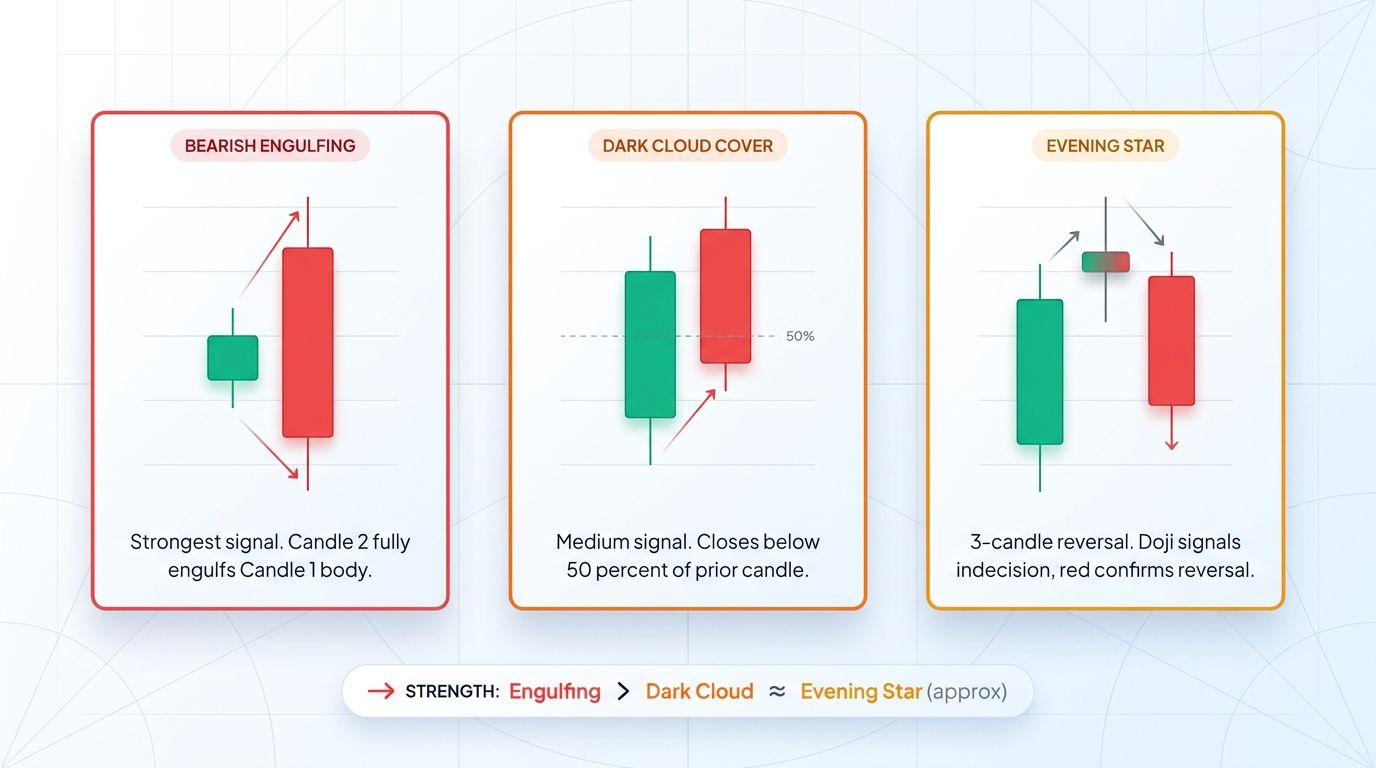
Bearish Engulfing vs Dark Cloud Cover
Dark cloud cover is a close cousin. In that pattern, Candle 2 opens above Candle 1's high and closes below Candle 1's midpoint, but it does not fully engulf the prior candle's body. It is a weaker signal because buyers still held part of the territory they gained. A true bearish engulfing candle erases the bulls' progress completely, which is why it tends to produce more decisive follow-through.
Bearish Engulfing vs Shooting Star
A shooting star is a single-candle reversal with a small body near the session low and a long upper wick. It shows rejection of higher prices in one session. The bearish engulfing is a two-candle formation with a strong directional body and usually very small wicks. Both are bearish reversal signals, but they represent different types of rejection. A shooting star is a wick-based warning, while an engulfing candle is body-based conviction.
Bearish Engulfing vs Evening Star
The evening star is a three-candle reversal: a bullish candle, a small-body candle or doji, and a large bearish candle that closes deep into the first candle's body. It is a more elaborate pattern that requires a full day of indecision to form. The bearish engulfing is faster and simpler - only two candles are needed. The trade-off is that evening stars sometimes offer slightly better reliability because of the built-in indecision session, while bearish engulfings offer faster signals.
How to Trade a Bearish Engulfing Pattern
Spotting the pattern is only half the work. Converting recognition into a profitable trade requires disciplined rules.
Rule 1: Trend context is non-negotiable
The pattern is only valid at the end of an uptrend or at a key resistance level. Random engulfings in mid-range consolidation are noise. If price has been chopping sideways for a week, a red candle engulfing a green one means nothing beyond normal volatility.
Rule 2: Size matters
The larger the engulfing candle relative to recent candles, the stronger the signal. A bearish engulfing pattern where Candle 2 is three or four times the size of average recent candles carries much more weight than a small engulfing inside a low-volatility environment. Tiny engulfings in quiet markets often fail outright.
Rule 3: Volume confirmation
Above-average volume on the engulfing candle makes the signal much more reliable. You want to see real conviction from sellers, not a thin-volume flush. Low-volume engulfings are suspect and frequently reverse within a session or two.
Rule 4: Use confluence
A bearish engulfing pattern at a key resistance zone, combined with overbought RSI, bearish divergence on MACD, and higher-timeframe alignment, is a high-probability short setup. A single engulfing in isolation is just one data point. Confluence stacks the odds in your favor.
Entry, Stop, Target Framework
A clear execution plan turns the pattern into a repeatable strategy.
- Aggressive entry: short on the close of the engulfing candle. Best risk-reward but higher chance of a retest.
- Conservative entry: wait for a retest of the engulfing candle's midpoint or the prior support-turned-resistance level. Smaller position size loss rate, slightly worse entry price.
- Stop loss: just above the engulfing candle's high (the rejection wick). This is the invalidation point.
- Target 1: the next swing low or nearest support zone.
- Target 2: a prior breakout level or higher-timeframe support.
- Minimum risk-reward ratio: 1:2. If the setup does not offer at least two units of reward per unit of risk, skip it.
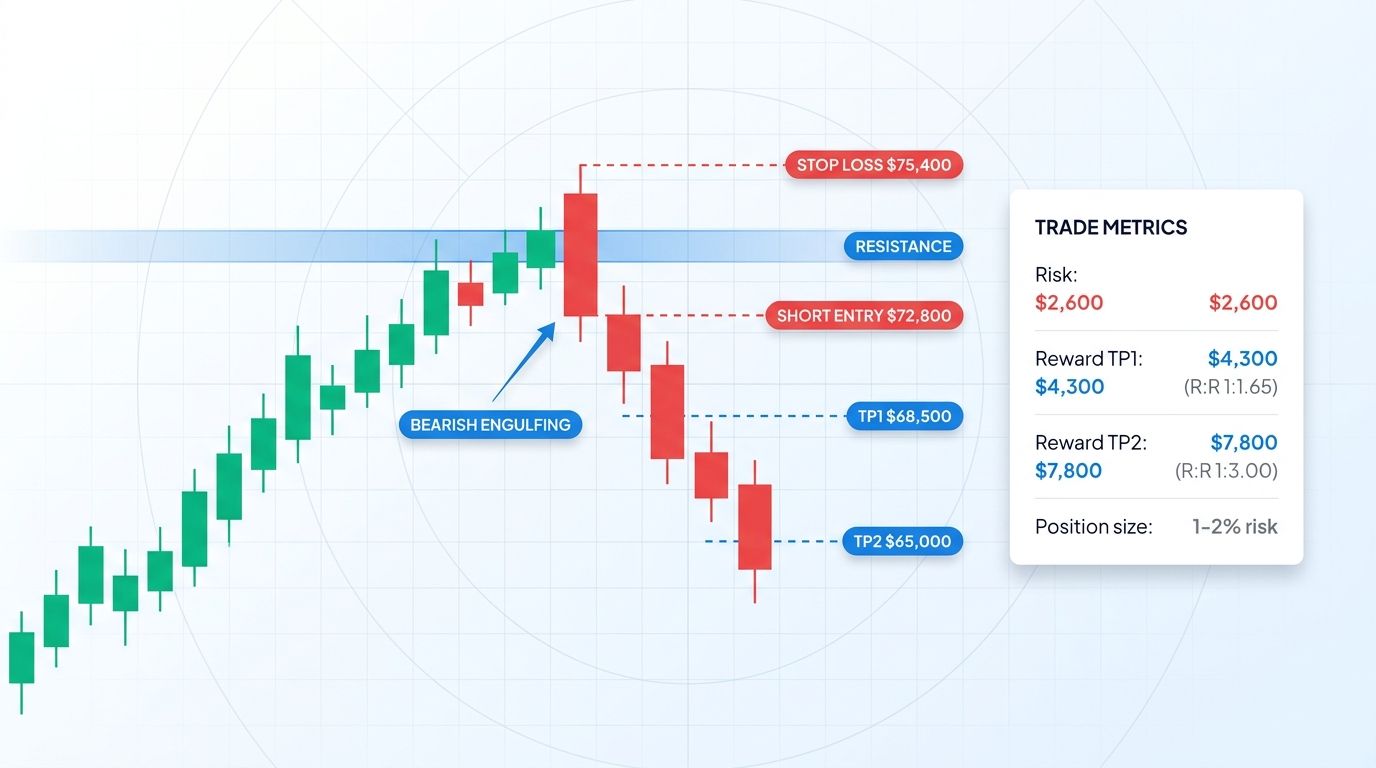
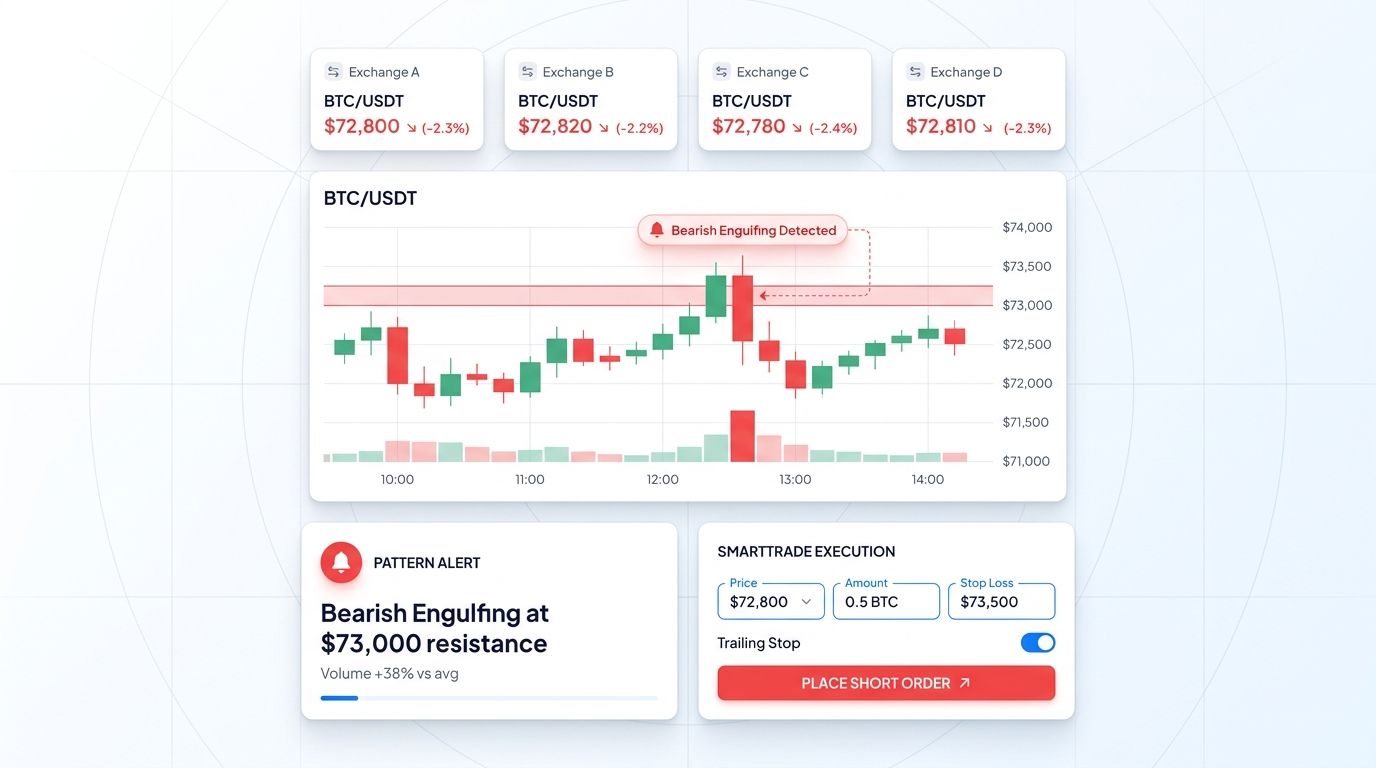
Example: Bearish Engulfing at BTC Resistance
Picture Bitcoin in a multi-day uptrend climbing from $65,000 toward a weekly resistance zone near $73,000. Price tags the zone intraday, prints a bullish daily candle, then the next day opens higher at $72,900 and sells off hard, closing at $71,400. The real body of that red candle fully engulfs the prior green body and volume runs 40 percent above the 20-day average.
A trader using this strategy shorts on the daily close near $72,800, places the stop just above the engulfing high at $75,400, takes partial profit at the prior swing low of $68,500 (Target 1) and trails the remainder toward $65,000 (Target 2). Risk is roughly $2,600 per BTC shorted. Target 1 delivers $4,300 per BTC, and Target 2 delivers $7,800 per BTC. With a 1 to 2 percent account risk rule, position sizing stays conservative and the trader has no pressure to micromanage the position.
Common Mistakes When Trading Bearish Engulfing
Most failed engulfing trades share the same errors. Avoiding them is the fastest way to improve your win rate.
- Treating every engulfing pattern as a reversal signal. Context matters more than pattern shape.
- Ignoring the prior trend. Engulfings in ranges are noise, not signals.
- Skipping volume confirmation. Low-volume engulfings fail at much higher rates.
- Setting stops too tight, inside the engulfing body rather than above the candle's high. That guarantees premature stop-outs on normal retests.
- Entering without confluence. Single-signal trading is inherently low probability.
- Taking engulfing signals on 1 to 5 minute charts where they form constantly but produce poor follow-through.
- Shorting counter-trend when the higher timeframe remains decisively bullish. Even a clean setup fails when the macro tide is still running against you.
Bearish Engulfing in Crypto: What You Should Know
Crypto markets produce many bearish engulfing candles because volatility is continuous and sentiment shifts fast. Reliability varies widely depending on the context.
- 4-hour and daily engulfings on BTC and ETH at key resistance: high reliability. These are the most actionable setups.
- Engulfings on low-cap altcoins: suspect. Often part of distribution patterns where the pump and dump is already in motion.
- Weekend engulfings: frequently reverse by Monday when liquidity returns and traditional capital re-enters.
- Engulfings with high volume during US trading hours: the most reliable subset. Real institutional activity tends to confirm these signals.
Always use higher-timeframe context as a filter. A daily bearish engulfing pattern that lines up with a weekly resistance level is dramatically more actionable than the same shape appearing inside a weekly range with no clear directional tension.
How Altrady Helps You Trade Bearish Engulfing Patterns
Pattern recognition and execution both benefit from the right tools. Altrady gives discretionary crypto traders the workflow needed to catch, validate, and manage these setups across multiple exchanges.
- Multi-chart view so you can scan several pairs simultaneously for engulfing formations instead of flipping charts one at a time.
- Custom alerts at key resistance levels so you get notified the moment price approaches an actionable zone, even if you are away from the desk.
- SmartTrade orders that let you set precise entry, stop loss, and multiple take-profit targets in a single click.
- Backtest tool to validate bearish engulfing plus confluence rules on historical data before risking real capital.
- Paper trading mode so you can practice pattern recognition and trade management risk-free.
Ready to put this workflow into action? Start your free trial with Altrady and test the full toolkit before committing.
Frequently Asked Questions
Is the bearish engulfing pattern reliable?
The bearish engulfing is one of the most reliable reversal patterns when used with proper context. At clear resistance levels after an uptrend, with volume confirmation and higher-timeframe alignment, win rates can reach 65 to 75 percent in favorable market conditions. Without context, the same two-candle shape is just noise and should be ignored.
What is the difference between bearish engulfing and dark cloud cover?
A bearish engulfing candle's real body fully covers the previous candle's body. A dark cloud cover only pushes the close below the prior candle's midpoint without engulfing the full body. The engulfing pattern is stronger because it shows a complete sentiment reversal rather than a partial one.
Do I need volume to trade a bearish engulfing?
Volume confirmation is strongly recommended, not optional. An engulfing with above-average volume shows genuine commitment from sellers and makes follow-through much more likely. Low-volume engulfings often fail outright or produce fake-out moves that stop out traders before resuming the original trend.
Can I trade bearish engulfing on the 15-minute chart?
You can, but signal quality drops significantly on lower timeframes. Short-term engulfings print constantly on 1, 5, and 15 minute charts and produce low win rates. The best results come from 4-hour, daily, and weekly engulfings at key structural resistance levels.
How do I set a stop loss for a bearish engulfing trade?
Place your stop just above the high of the engulfing candle, or the combined high of both candles if the first candle extended higher. That level is the invalidation point - if price breaks above it, the reversal has failed and your thesis is wrong. Stops placed inside the engulfing body will be hit on routine retests even when the setup ultimately works.
Conclusion
The bearish engulfing pattern is one of the strongest two-candle reversal signals in candlestick analysis, but only when context supports it. Trend location, candle size, volume, and confluence with resistance zones separate the setups worth trading from the ones that just look interesting on a chart. Always align the signal with higher-timeframe structure before committing capital, and respect the stop above the engulfing high as the line where your thesis is proven wrong.
If you are ready to practice spotting and executing these setups across multiple crypto pairs at once, start your free trial with Altrady and use paper trading mode to build confidence before risking real capital. Pattern recognition is a learnable skill - the right tools and disciplined rules are what turn it into consistent results.