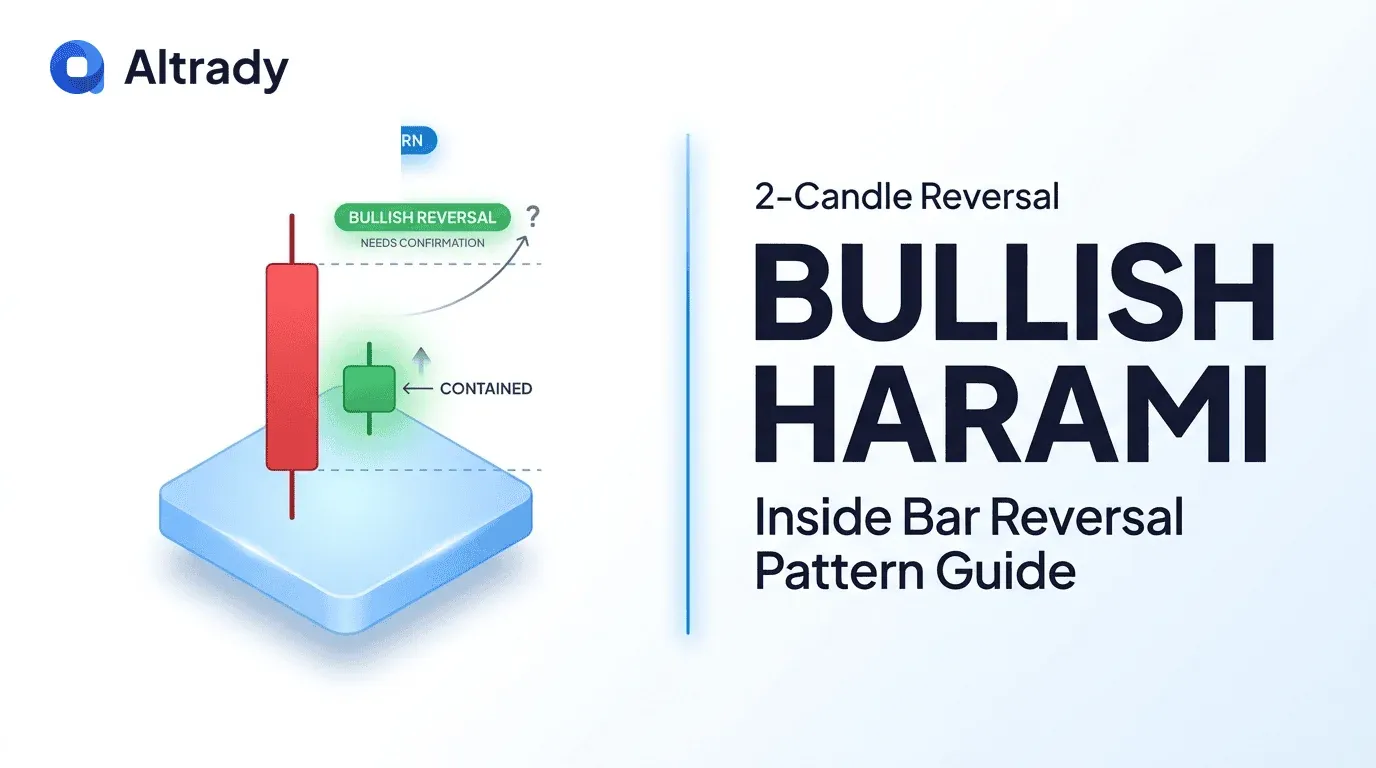

Bitcoin slides for three sessions and closes near a major support level on a wide bearish candle. The next day, price opens higher, stays quiet, and prints a small green candle whose entire body sits tucked inside the previous red body. That contracted second candle is a bullish harami, and it is one of the clearest early signals that selling momentum is stalling before a potential reversal.
What Is a Bullish Harami Pattern?
The bullish harami is a 2-candle pattern that often appears at the end of a downtrend and hints at a possible bullish reversal. The word "Harami" comes from Japanese and means "pregnant", which describes the visual structure: a large bearish candle (the mother) is followed by a small bullish candle (the baby) whose body is fully contained inside the prior body.
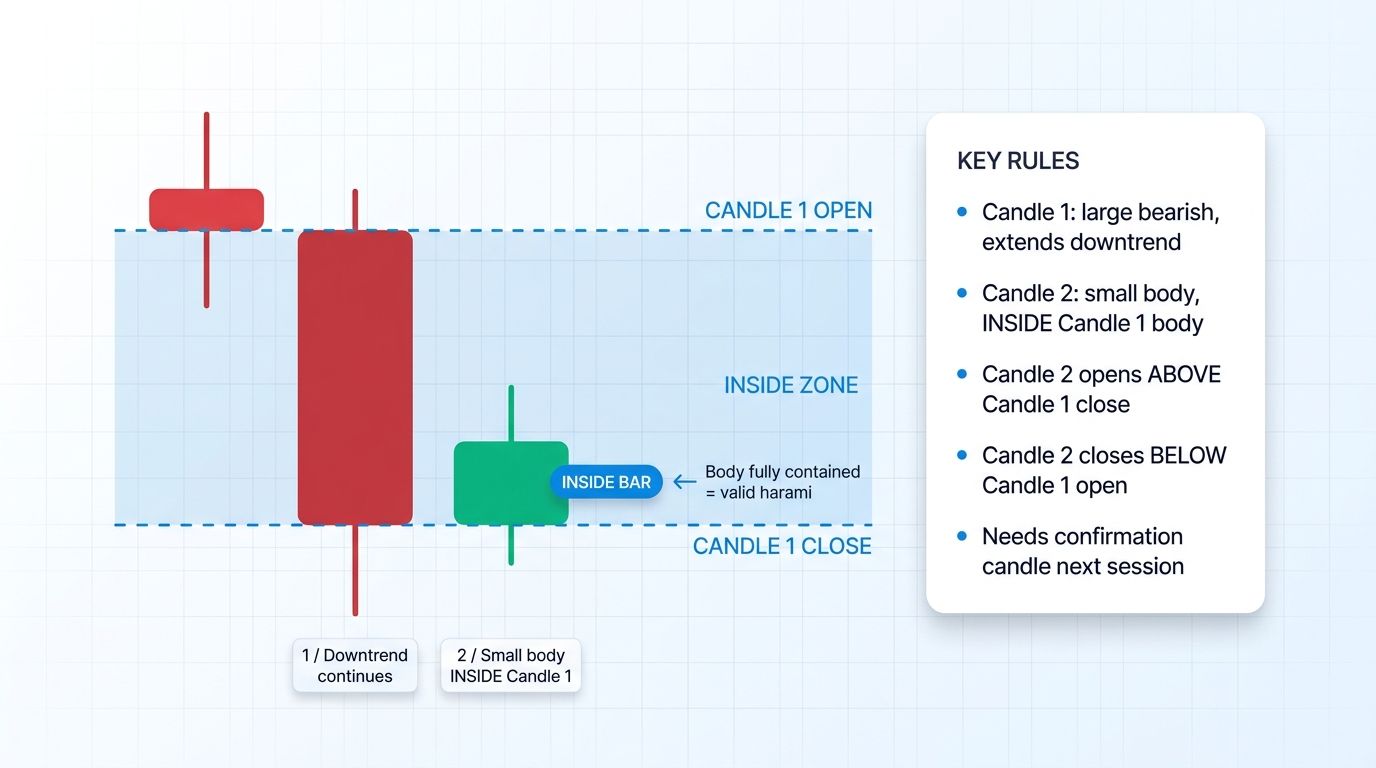
The mechanics are simple. Candle 1 is a wide-range red candle that extends the existing downtrend. Candle 2 is a smaller green candle that opens above the prior close and closes below the prior open, so its real body sits entirely inside the prior real body.
Traders read this contraction as early evidence that sellers have lost control. Price is no longer making new lows, and buyers are starting to defend the level. On its own, the bullish harami is a soft signal, but combined with confluence like support zones and rising volume on the follow-through candle, it becomes a useful reversal trigger.
How to Identify a Bullish Harami on a Chart
Identifying a bullish harami correctly is about body containment and trend context. Traders check the candle sequence, the prior move direction, and the relationship between the two real bodies.
The two-candle structure
The first candle must be a large bearish candle that extends a pre-existing downtrend. It has a wide real body, closes near its low, and confirms sellers are still dominant.
The second candle is a small bullish candle, or sometimes a doji, with the following body rules:
- Open is above Candle 1's close.
- Close is below Candle 1's open.
- The entire real body of Candle 2 fits inside the real body of Candle 1.
- Wicks can extend outside the prior body, but the body must not.
This structure is sometimes called an inside bar because the second candle is contained within the prior candle's range.
Key identification rules
To keep signal quality high, traders look for several conditions beyond the raw pattern:
- A clear downtrend must exist before the pattern appears. Harami in a sideways chop area is noise.
- Candle 2's body must be significantly smaller than Candle 1's body, ideally 30 to 60 percent of the size.
- The pattern should form at or near a known support zone, moving average, or Fibonacci level.
- Volume usually declines on Candle 2, showing exhaustion rather than fresh selling.
- Any bullish confirmation candle afterward should show rising volume.
When all these boxes are ticked, the bullish harami becomes a much higher-probability setup instead of a random inside bar.
Why Bullish Harami Works: The Psychology
Every candle tells a story about who is in control. The bullish harami reflects a power shift that starts quietly.
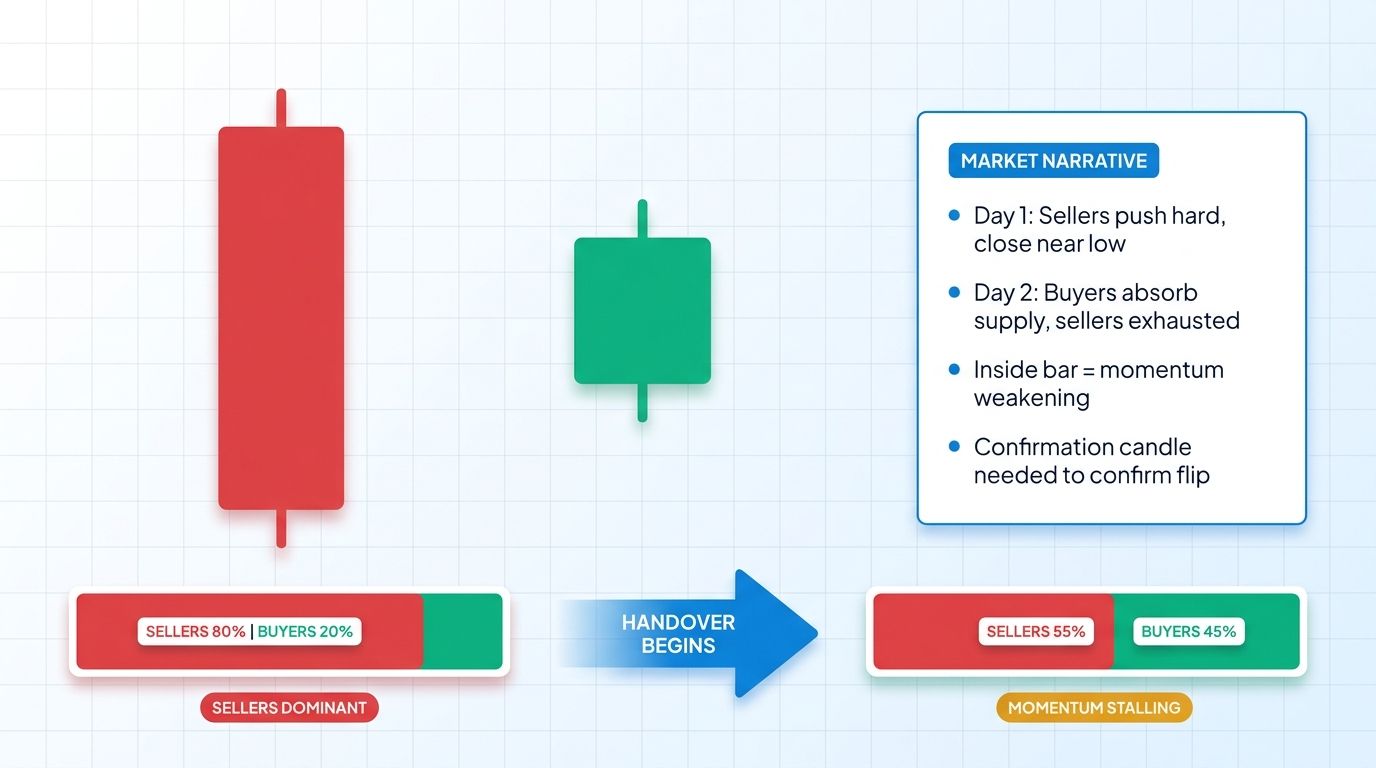
During Candle 1, sellers are dominant. Price slides through the session and closes near the low with bearish conviction. New sellers pile in, stops get hit below prior support, and the downtrend looks firmly in place.
During Candle 2, the tone changes. Price opens higher, and instead of a fresh leg down, the market spends the session in a narrow range. Sellers who expected continuation notice that lower prices are being absorbed. Price refuses to break the prior low and stays inside the prior body, signaling that bearish momentum is stalling.
This is the heart of the bullish harami pattern. Sellers are exhausted, buyers are absorbing supply, and the market is pausing before potentially flipping direction. A strong confirmation candle the next session often triggers short covering and fresh long entries, producing the actual bullish reversal.
Bullish Harami vs Other Bullish Reversal Patterns
The bullish harami is one of several 2 and 3 candle bullish reversal patterns. Understanding the differences helps traders pick the right tool.
Bullish Harami vs Bullish Engulfing
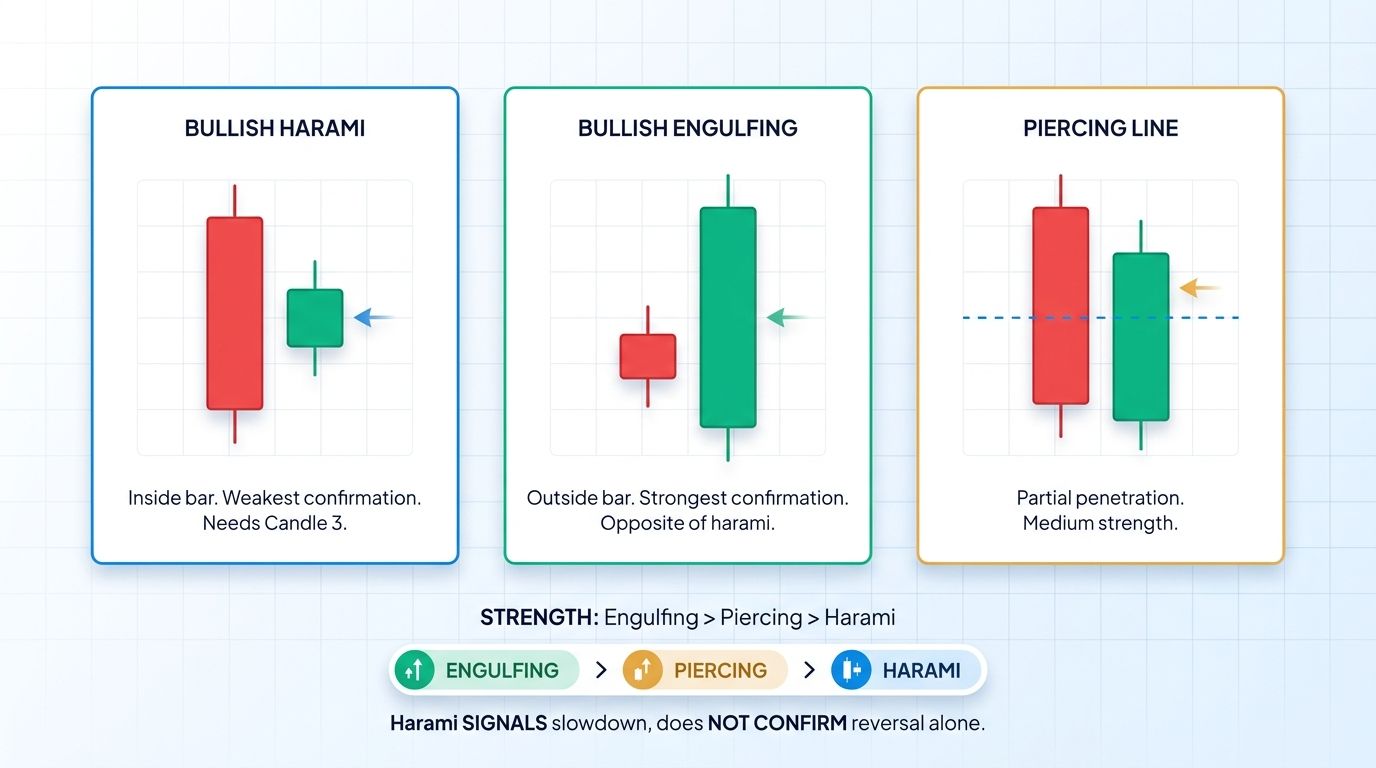
The bullish harami vs bullish engulfing comparison is the most important one. The two are structural opposites. In a bullish engulfing, Candle 2 is large and completely engulfs the prior red body. In a bullish harami, Candle 2 is small and sits completely inside the prior red body.
The engulfing is an aggressive, high-momentum signal that usually needs less confirmation. The harami is a softer, early hint that almost always needs a confirmation candle before any entry.
Bullish Harami vs Piercing Line
A piercing line is also a 2-candle bullish reversal, but Candle 2 opens below the prior low and rallies to close above the midpoint of Candle 1's body. It is a more aggressive reclaim of lost ground.
The bullish harami, by contrast, never pierces back into the upper half of the prior body. It is smaller and represents a pause rather than a strong push back. Piercing lines give earlier, stronger signals, while harami trades need tighter risk management.
Bullish Harami vs Morning Star
A morning star is a 3-candle pattern: a large bearish candle, a small-bodied middle candle (often a doji), and a large bullish candle that closes well into the first body. It includes its own confirmation inside the pattern.
The bullish harami is essentially the first two candles of that structure, with no built-in confirmation. That is why traders wait for a third bullish candle before acting on a bullish harami, effectively turning it into a morning star-style setup.
How to Trade the Bullish Harami Pattern
The bullish harami pattern can be powerful, but only with strict rules. Without them, traders get chopped up by random inside bars in sideways markets.
Rule 1: Require a clear downtrend first
No downtrend means no valid bullish harami. Traders should see at least three to five declining swing highs and lows, or a clean bearish channel, before treating any harami as a reversal signal.
Rule 2: Confirm Candle 2 body is fully inside Candle 1 body
The containment rule is non-negotiable. Candle 2's open must be above Candle 1's close, and Candle 2's close must be below Candle 1's open. If the body breaks even slightly outside the prior body, it is not a bullish harami.
Rule 3: Wait for a confirmation candle
This rule is the most important. The bullish harami is weaker than engulfing or morning star, so confirmation is essential. Traders look for a third bullish candle that:
- Opens near or above Candle 2's close.
- Closes above Candle 2's high.
- Ideally closes above Candle 1's high.
- Prints with rising volume.
Entering only after confirmation filters out most failed harami setups.
Rule 4: Use confluence (support, volume, RSI)
The bullish harami performs best when it lines up with other evidence:
- Horizontal support or a weekly swing low.
- The 200-day or 200-week moving average.
- Declining volume on Candle 2 and rising volume on confirmation.
- RSI in oversold territory or showing bullish divergence.
- Higher-timeframe demand zones or Fibonacci retracements (0.5 to 0.618).
Entry, Stop, Target Framework
A clean framework for the bullish harami:
- Entry: close of the confirmation candle, or a small pullback the next session.
- Stop loss: below Candle 1's low (the mother candle), usually the structural low.
- Target 1: nearest prior resistance or 1.5R.
- Target 2: major swing high or 2.5R to 3R.
- Risk per trade: 1 percent of account or less.
Example: Bullish Harami on ETH Support
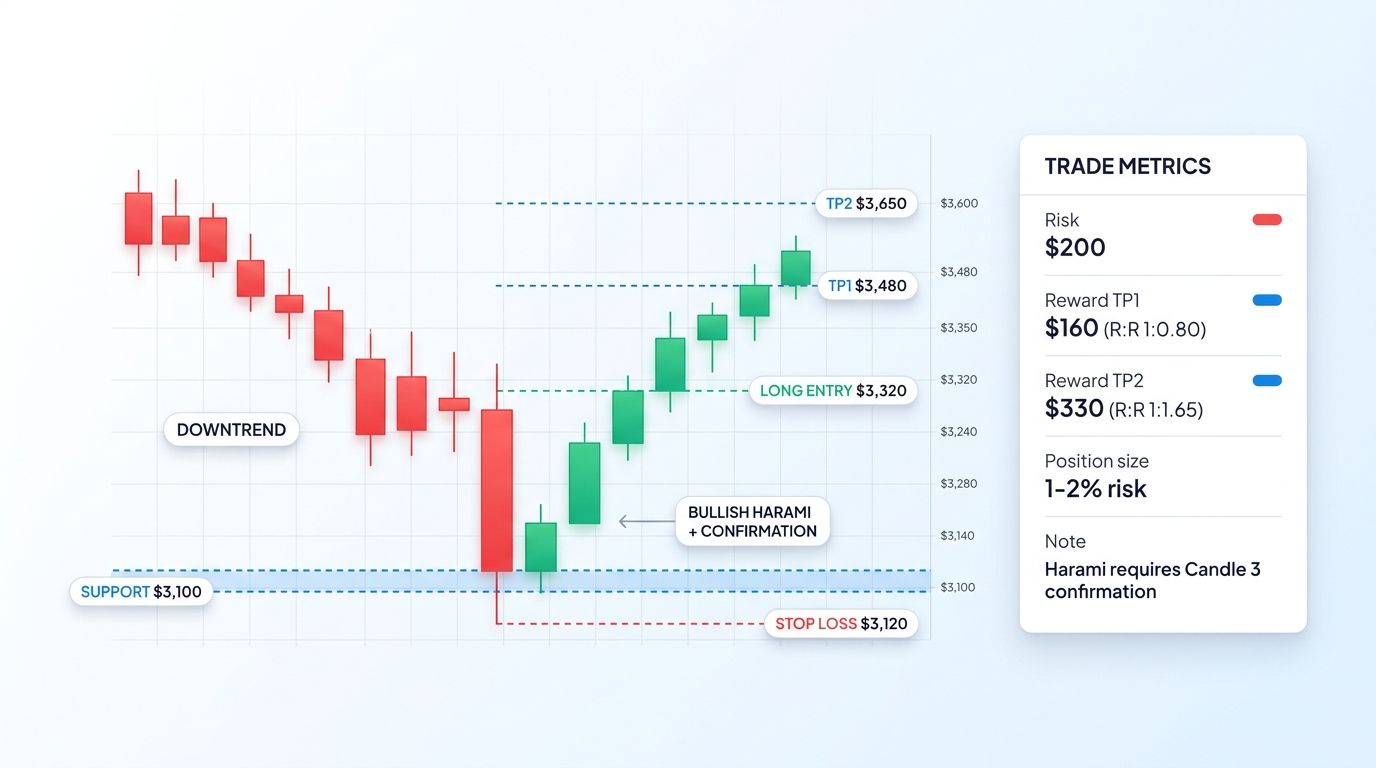
Imagine ETH has been in a downtrend for weeks and is approaching the weekly 3,100 USD support zone. The chart prints this daily sequence.
- Day 1: large bearish candle, open 3,350, close 3,140. Wide red body near the low.
- Day 2: small bullish candle, open 3,180, close 3,240. Body fully inside Day 1, lower volume.
- Day 3: confirmation candle, open 3,245, close 3,320. Green candle closing above Day 2's high on rising volume.
A trader enters long on the Day 3 close at 3,320, with a stop at 3,120 just below Day 1's low. Risk per unit is 200 USD.
- TP1 at 3,480, reward 160, R:R about 0.8.
- TP2 at 3,650, reward 330, R:R about 1.65.
Many traders scale out at TP1 with a partial position, then trail the stop toward TP2, turning the effective risk-reward into roughly 1.2R to 1.5R on the total position.
Common Mistakes When Trading Bullish Harami
Even when a valid bullish harami appears, execution errors can wipe out the edge. The most frequent mistakes include:
- Trading harami patterns in sideways markets where no real downtrend exists.
- Skipping the confirmation candle and entering on Candle 2 itself.
- Ignoring higher-timeframe context, especially a strong bearish weekly structure.
- Placing stops too tight, just below Candle 2 instead of the Candle 1 low.
- Oversizing positions because the pattern "looks clean" on a screenshot.
- Counting wicks instead of bodies when judging containment.
- Treating every inside bar as a harami, even without a clear bearish prior candle.
Avoiding these mistakes is often the difference between a strategy that works in backtests and one that works live.
Bullish Harami in Crypto Markets
Crypto markets run 24/7, and that changes how candlestick patterns behave. Without a formal close like stocks have, the "daily" candle depends on the exchange's chosen daily boundary, and lower timeframes produce many harami-like structures per day.
On 1-minute or 5-minute charts, bullish harami signals are generally weak. High-frequency noise means small inside bars appear constantly without real meaning. Lower-timeframe traders need volume filters, liquidity checks, and orderbook context to extract any edge.
On daily and weekly charts, bullish harami patterns become far more reliable. These candles aggregate more participation, absorb shorter-term noise, and align better with macro support zones. A weekly bullish harami at a multi-year support level after an extended bear leg is one of the stronger reversal hints crypto charts can offer.
The best approach is to treat the bullish harami as a higher-timeframe signal and combine it with lower-timeframe tactical entries, so traders get both reliability and precision.
How Altrady Helps You Spot and Trade Bullish Harami
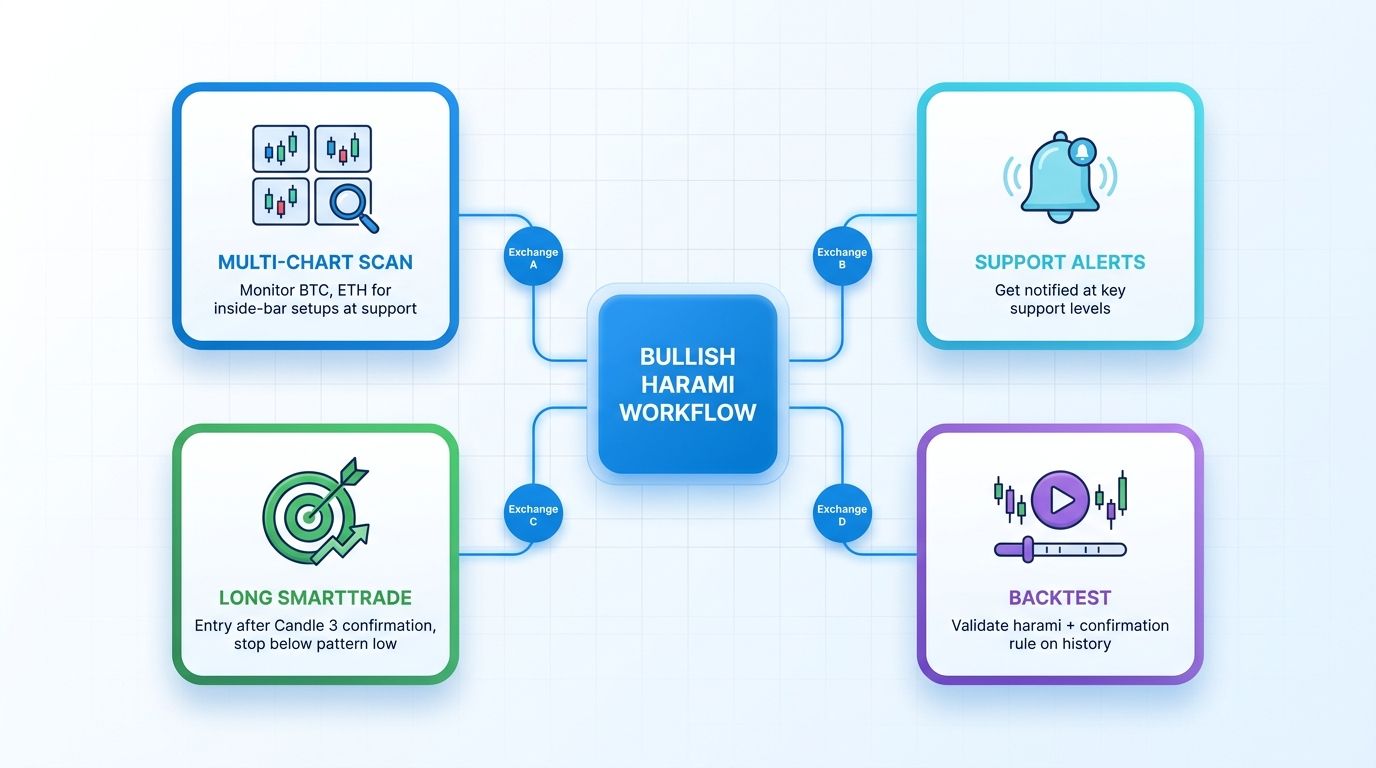
Altrady is a multi-exchange crypto trading terminal designed to make pattern-based trading more systematic. When a bullish harami forms, the multi-chart view lets traders compare the same pair across different timeframes, quickly confirming that daily or weekly context supports the setup.
Price and breakout alerts help spot key levels before the pattern completes. Traders can set alerts at prior support zones, so when price reaches the area where a bullish harami might form, they get notified and can wait for the structure to print.
Once the pattern is confirmed, the SmartTrade order panel allows entry, stop loss, and multiple take-profit targets to be configured in a single order. That fits the bullish harami framework, since trades usually involve scaling out at TP1 and trailing the remainder. Paper trading and backtest tools let traders stress-test the harami rules on historical data before committing real capital.
Start your free trial with Altrady and practice trading the bullish harami pattern across multiple exchanges with proper risk controls in place.
Frequently Asked Questions
Is the bullish harami pattern reliable?
The bullish harami is moderately reliable, but only when filters are applied. On its own, the 2-candle pattern has a mixed track record because many inside bars form in sideways conditions. Reliability improves when the pattern appears after a clean downtrend, forms at a defined support zone, shows declining volume on Candle 2, and is followed by a strong confirmation candle. Without those filters, the signal is weak and often produces false reversals.
What is the difference between a bullish harami and a bullish engulfing?
The bullish harami vs bullish engulfing comparison comes down to body structure. In a bullish harami, Candle 2 is small and sits inside Candle 1's body. In a bullish engulfing, Candle 2 is large and completely engulfs Candle 1's body. The engulfing shows aggressive, immediate buying pressure and is stronger. The harami shows a pause in selling and is a softer, early signal that typically needs a third bullish confirmation candle before traders go long.
Do I need a confirmation candle after a bullish harami?
Yes, a confirmation candle is strongly recommended. The bullish harami is weaker than engulfing or morning star patterns, and Candle 2 alone does not prove buyers are back in control. A valid confirmation candle opens near or above Candle 2's close, closes above Candle 2's high, ideally closes above Candle 1's high, and prints with rising volume. Entering only after this candle filters out most failed setups and produces much better risk-adjusted returns.
What timeframe is best for trading bullish harami?
Higher timeframes produce more reliable bullish harami signals. Daily and weekly charts aggregate more order flow, smooth out noise, and align with major support zones. Lower timeframes like 5-minute or 15-minute charts are dominated by noise, so harami structures appear constantly without meaningful reversals. A balanced approach is to identify the pattern on daily or weekly charts, then drop to 1-hour or 4-hour for a tighter entry on the confirmation candle.
Where should I place my stop loss for a bullish harami trade?
The standard placement is just below the low of Candle 1, the large bearish candle. This low usually represents the structural swing low of the move, and a break below it would invalidate the reversal thesis. Many traders add a 0.5 to 1 percent buffer to account for wicks and liquidity sweeps. Avoid placing stops just under Candle 2, since random volatility can easily trigger them without breaking the pattern.
Conclusion
The bullish harami is a subtle but valuable 2-candle pattern that marks the moment when selling momentum starts to stall. A large bearish candle is followed by a small bullish candle fully contained inside the prior body, showing sellers losing conviction and buyers absorbing supply.
The key to using the bullish harami pattern effectively is discipline. Require a clear downtrend, insist on body containment, wait for a confirmation candle, and combine the pattern with confluence like support zones, volume, and RSI. Avoid lower-timeframe noise and focus on daily and weekly structures where the signal is strongest.
With a clear framework, sensible stops below Candle 1 low, and a staged take-profit plan, the bullish harami becomes a useful tool in any crypto trader's pattern library. Start your free trial with Altrady to scan for bullish harami setups across multiple exchanges and build a repeatable reversal workflow.