Bitcoin pushes to a new session high, momentum looks unstoppable, and then the next candle opens above the prior bullish close, spikes briefly, and closes deep inside that green body. That single behavior is the dark cloud cover, a 2-candle pattern that quietly warns traders when exhaustion is setting in at the top of a rally. Learn how to read it, trade it, and use it in crypto where the mechanics shift slightly.
What Is a Dark Cloud Cover Pattern?
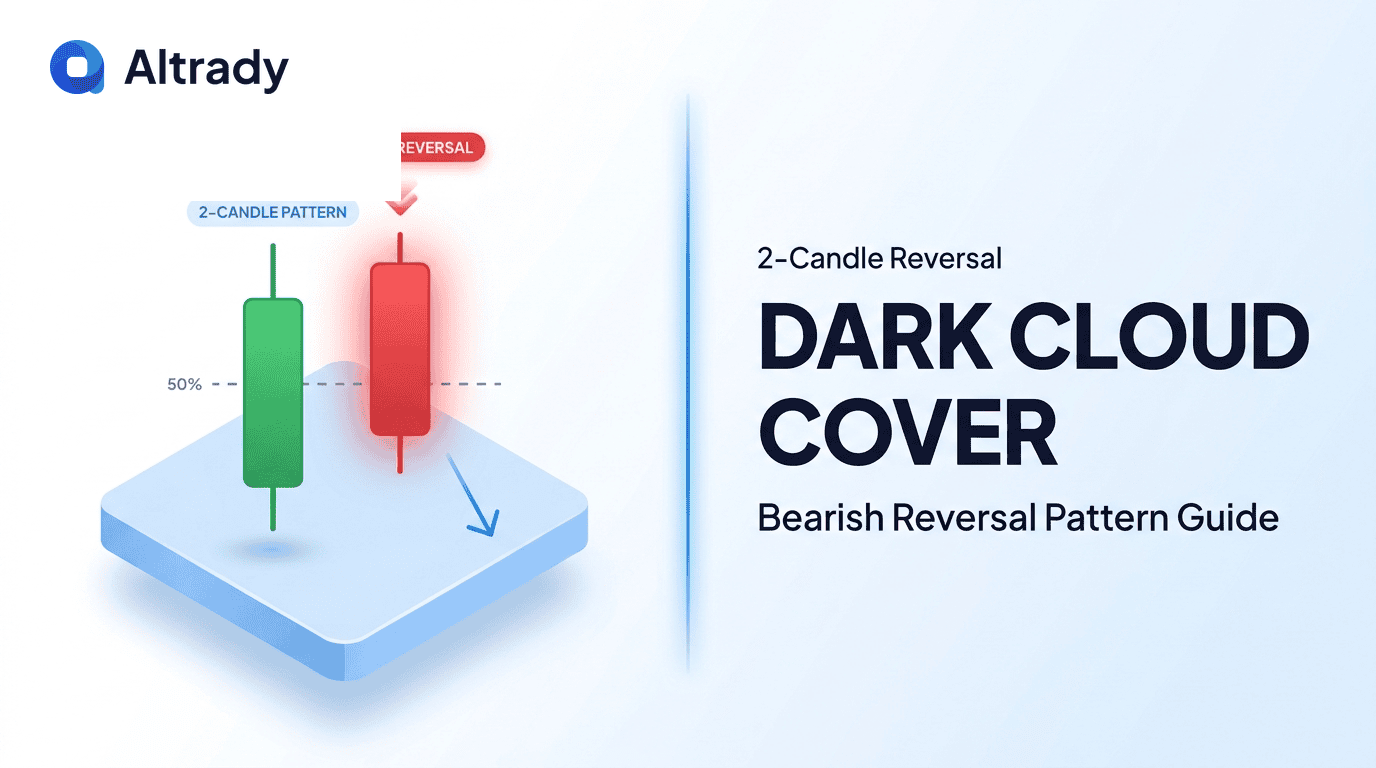
The dark cloud cover is a bearish reversal candlestick pattern that appears after an uptrend and signals a shift from buyers to sellers. It is built from two candles. Candle 1 is a large bullish (green) candle reinforcing the uptrend. Candle 2 is a bearish (red) candle that opens above Candle 1's high and closes deep into Candle 1's body, below the 50% midpoint.
That second candle is the story. It starts bullish but ends with sellers in control, erasing more than half of the prior day's gains. In modern crypto charts, dark cloud cover remains one of the cleanest early warnings that a trend may be rolling over before heavier selling confirms the reversal.
How to Identify a Dark Cloud Cover on a Chart
Pattern recognition is simple once you break the structure down. You are looking for a very specific relationship between two consecutive candles after a clear move up.
The two-candle structure
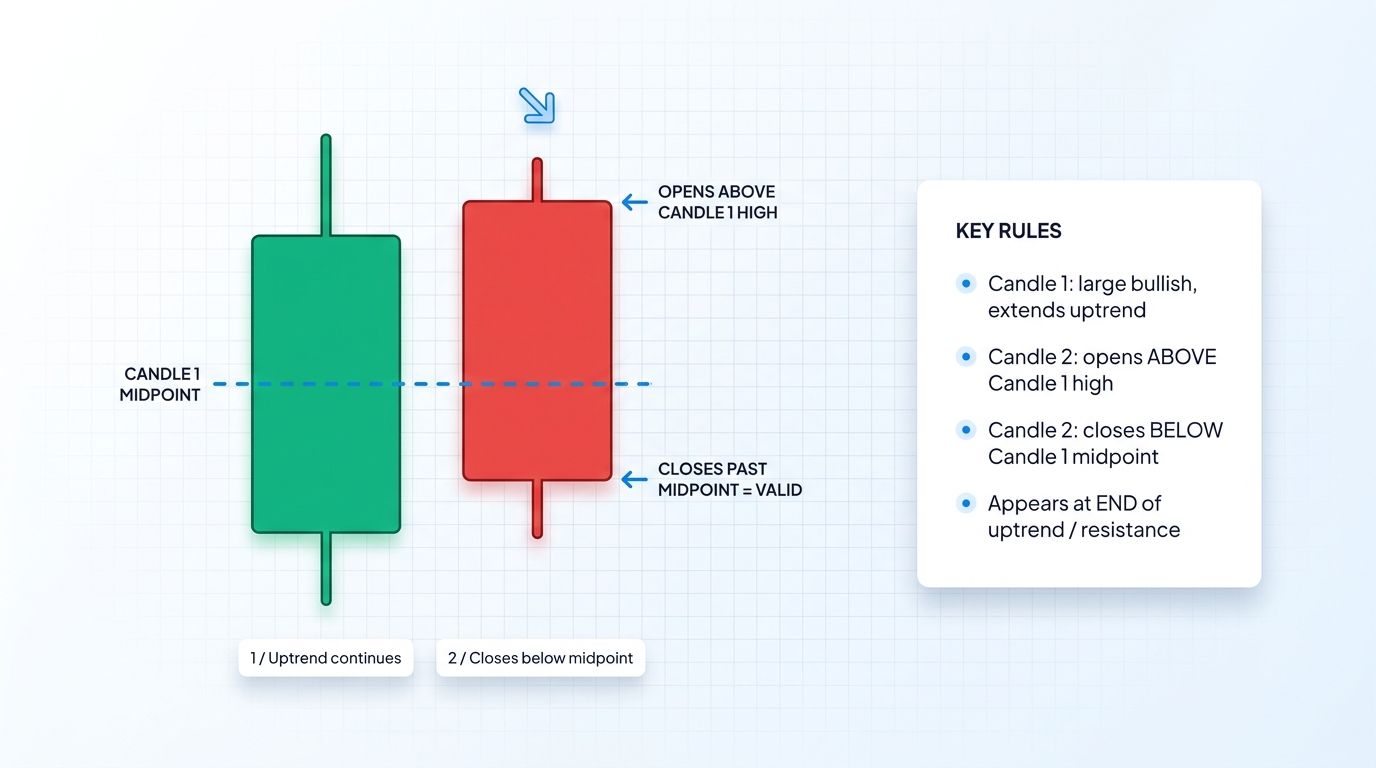
Think of the dark cloud cover as a failed breakout captured in two bars. The first candle rides the existing uptrend with a tall green body. The second candle tries to extend the rally, pushes above the previous high, then reverses hard and closes below the midpoint of Candle 1's real body.
Visually, Candle 2 looks like a cloud descending over the prior bullish close. The deeper Candle 2 closes into Candle 1's body, the stronger the reversal signal.
Key identification rules
A valid dark cloud cover on a traditional chart typically meets these conditions:
- Prior uptrend: the pattern must appear after at least a short-term rally, not in sideways chop.
- Candle 1 is a tall bullish body with a meaningful close above the open.
- Candle 2 opens above Candle 1's high (a gap up in traditional markets).
- Candle 2 closes below the 50% midpoint of Candle 1's real body.
- Candle 2 does not close below Candle 1's open (if it does, it becomes a bearish engulfing).
- Volume on Candle 2 is equal to or higher than Candle 1, confirming seller conviction.
- The pattern forms at or near known resistance or a prior swing high.
Why Dark Cloud Cover Works: The Psychology
Every candlestick pattern is a story about sentiment. After a sustained uptrend, traders are optimistic. Retail buyers chase the move, breakout traders add on strength, and the first bullish candle looks like continuation.
On Candle 2, the open above the prior high traps late buyers expecting another leg up. Instead, larger sellers, profit takers, and short sellers step in aggressively. Price rolls over intraday and closes deep into the prior bull body.
That close matters emotionally. Longs who bought the open now hold losers. Longs who rode the prior uptrend watch more than half of Candle 1's gains erased. Trapped longs often become forced sellers the next session, which is how reversals pick up speed.
Dark Cloud Cover vs Other Bearish Reversal Patterns
Dark cloud cover is one of several bearish reversal patterns, and confusion with similar setups can lead to wrong entries. Here is how it compares to the three most common alternatives.
Dark Cloud Cover vs Bearish Engulfing
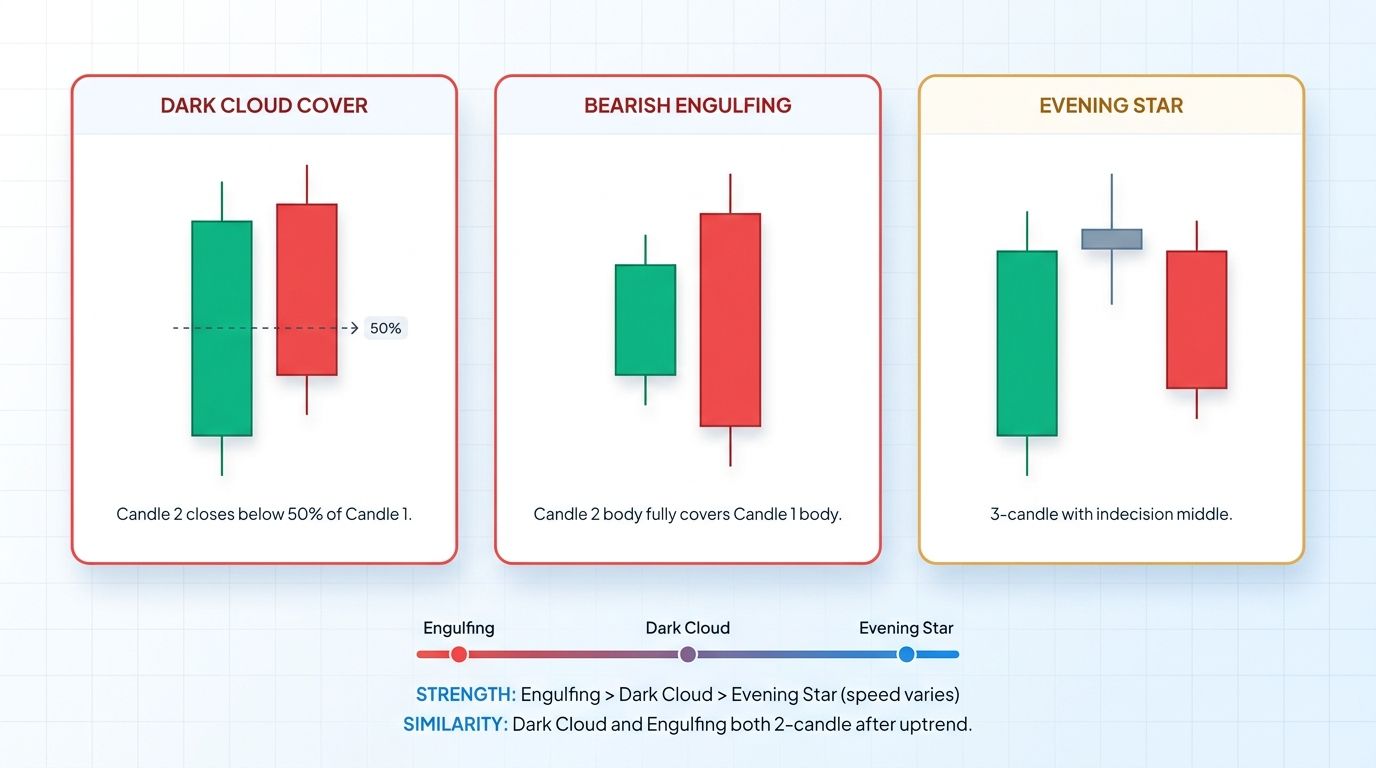
Both patterns start with a bullish candle and end with a bearish candle. The difference is how far Candle 2 closes down.
- Dark cloud cover: Candle 2 closes below the 50% midpoint of Candle 1 but above Candle 1's open.
- Bearish engulfing: Candle 2's body fully engulfs Candle 1's body, closing at or below Candle 1's open.
Bearish engulfing is slightly stronger because sellers have taken out the entire prior bullish range. Dark cloud cover is milder but earlier, often appearing one session before a full engulfing setup develops.
Dark Cloud Cover vs Evening Star
The evening star is a 3-candle pattern: a long bullish candle, a small-bodied candle (star) at the top, and a long bearish candle that closes well into the first candle's body.
Dark cloud cover is a 2-candle pattern without the middle indecision candle. Evening stars often give traders more confirmation because the small-body candle represents the actual moment of exhaustion. Dark cloud cover is faster to form and therefore earlier to signal, but slightly less confirmed.
Dark Cloud Cover vs Shooting Star
A shooting star is a single-candle pattern with a small body near the session low and a long upper wick. It shows rejection at highs within one candle.
Dark cloud cover splits that same rejection story across two candles. A shooting star is faster and cleaner to spot, but dark cloud cover tends to capture a more aggressive handoff from buyers to sellers because Candle 2 has a full bearish body, not just a wick.
How to Trade the Dark Cloud Cover Pattern
A clean dark cloud cover is not enough on its own. The pattern becomes actionable when you stack structure, volume, and risk management on top of the formation.
Rule 1: Require a clear uptrend first
Dark cloud cover is a reversal pattern. Without a prior uptrend, there is nothing to reverse. Confirm price has been trending up for several candles or just completed a rally into a key level.
If price is chopping sideways, the same structure may appear but it carries almost no predictive value. Always anchor the pattern to trend context first.
Rule 2: Confirm Candle 2 opens above Candle 1 high
A valid dark cloud cover in traditional markets requires Candle 2 to open above Candle 1's high. The gap up represents bullish exhaustion: buyers push to new highs at the open, then fail to hold.
If Candle 2 opens below Candle 1's high, you are likely looking at a different pattern such as a bearish harami or simple pullback. Keep standards strict.
Rule 3: Confirm Candle 2 closes past Candle 1's midpoint
Measure Candle 1's real body: (open + close) / 2 gives the midpoint. Candle 2 must close below that midpoint to qualify. A close at 60% or 70% penetration is acceptable. A close only slightly past the midpoint is weaker and often produces false signals.
The deeper the penetration, the higher the signal quality. Many traders wait for at least 60% penetration before shorting.
Rule 4: Use confluence (volume, resistance, indicators)
The strongest dark cloud covers show up with several layers of confluence:
- Higher volume on Candle 2 than Candle 1.
- Pattern forms at a known resistance zone, prior swing high, or round number.
- RSI in overbought territory (above 70) heading into the pattern.
- Bearish divergence between price and momentum oscillators.
- Pattern forms at the upper band of a Bollinger Band or near a VWAP test.
Without at least one or two confirming signals, consider the pattern a watch-only setup rather than a trade trigger.
Entry, Stop, Target Framework
A straightforward framework for trading the dark cloud cover:
- Entry: short on the close of Candle 2, or on the break of Candle 2's low for conservative confirmation.
- Stop loss: placed above the high of Candle 2.
- Target 1: recent swing low or next support zone.
- Target 2: measured move equal to the height of the prior uptrend leg.
- Position size: risk a fixed percentage (often 1 to 2%) of account equity based on the distance from entry to stop.
Always know your risk-reward before entering. Skip trades where reward is less than 2x the risked amount.
Example: Dark Cloud Cover on ETH Rejection
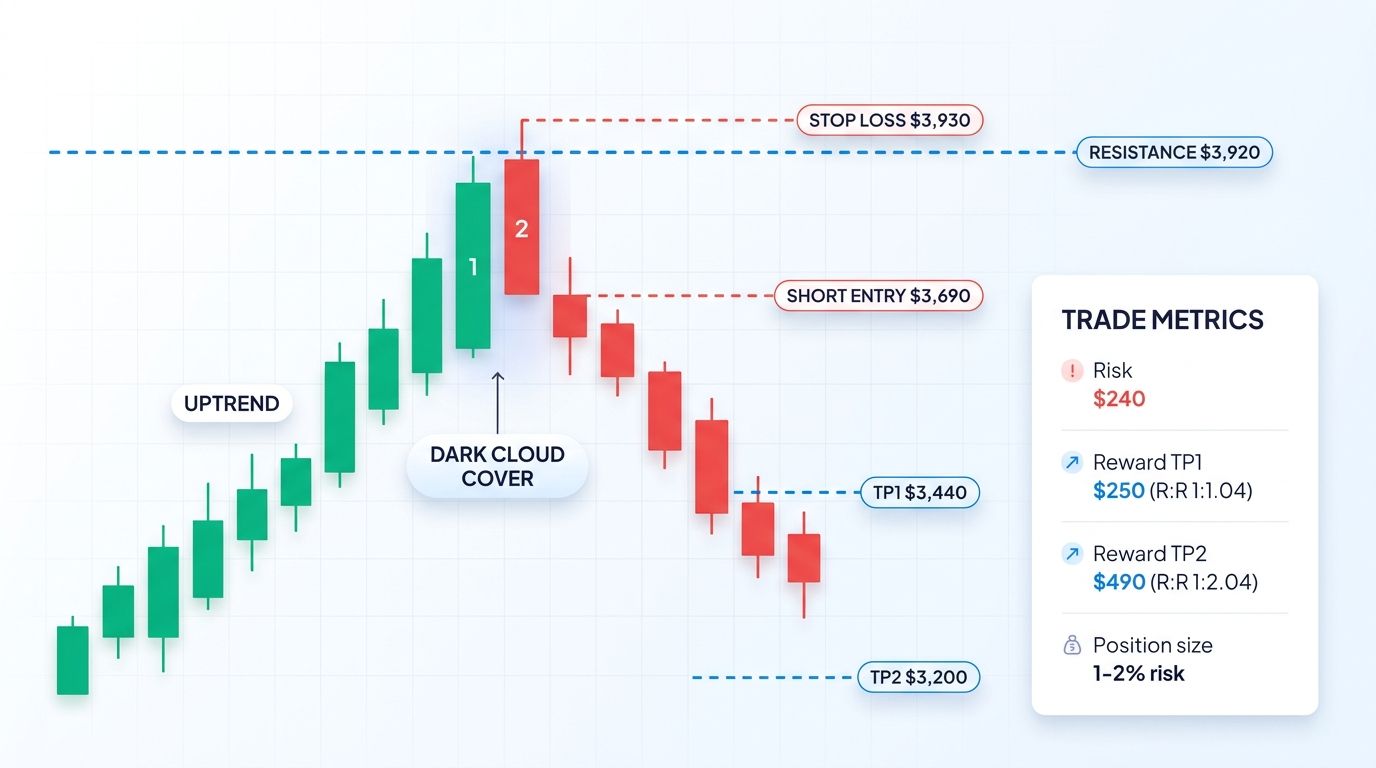
Picture Ethereum rallying from $3,400 into stubborn resistance around $3,900 after several bullish sessions.
- Day 1: ETH prints a large bullish green candle. Open $3,650, close $3,880. Body covers $230.
- Day 2: ETH opens $3,895, above Day 1's high. It rallies to $3,920 then rolls over, closing $3,690.
- Day 1 midpoint: ($3,650 + $3,880) / 2 = $3,765. Day 2 close of $3,690 is well below that midpoint. Valid dark cloud cover.
Trade plan:
- Short entry: $3,690.
- Stop loss: $3,930 (above Day 2 high).
- Target 1: $3,440 (prior support).
- Target 2: $3,200 (deeper support).
Risk per unit: $3,930 - $3,690 = $240. Reward to TP1: $250. R:R approximately 1.04:1. Reward to TP2: $490. R:R approximately 2.04:1.
TP1 barely clears break-even, so a common plan is to take partial profit there to reduce risk, then let remaining size run toward TP2 where the full setup pays closer to 2:1.
Common Mistakes When Trading Dark Cloud Cover
Even traders who recognize the pattern make the same errors. Avoid these:
- Entering without a prior uptrend.
- Accepting weak penetration (less than 50% of Candle 1's body).
- Ignoring volume and trading every pattern regardless of participation.
- Placing stops too tight at Candle 2's high, which invites wick stop-outs.
- Trading the pattern in sideways consolidation ranges.
- Shorting blindly into a strong uptrend without lower highs or structure breaks.
- Oversizing because the setup "looks obvious."
A B-grade setup at strong resistance with good risk-reward usually beats an A-grade setup with poor structure.
Dark Cloud Cover in Crypto Markets
Crypto markets are open 24/7, which breaks one classic dark cloud cover rule: the gap up on Candle 2's open. Traditional stock charts close overnight and can open higher. Crypto does not close.
In practice, traders relax the gap-up requirement. On daily crypto candles, Candle 2 rarely opens above Candle 1's high because it opens exactly where the previous candle closed. Instead, look for:
- Candle 2 poking above Candle 1's high with its upper wick before closing down.
- Candle 2 opening above Candle 1's close and closing deep into Candle 1's body.
- Strong rejection wicks at prior resistance to replace the missing gap.
Crypto traders treat dark cloud cover as a behavior pattern rather than a strict gap pattern. The psychology (bullish push, intraday failure, deep red close) is what matters.
How Altrady Helps You Spot and Trade Dark Cloud Cover
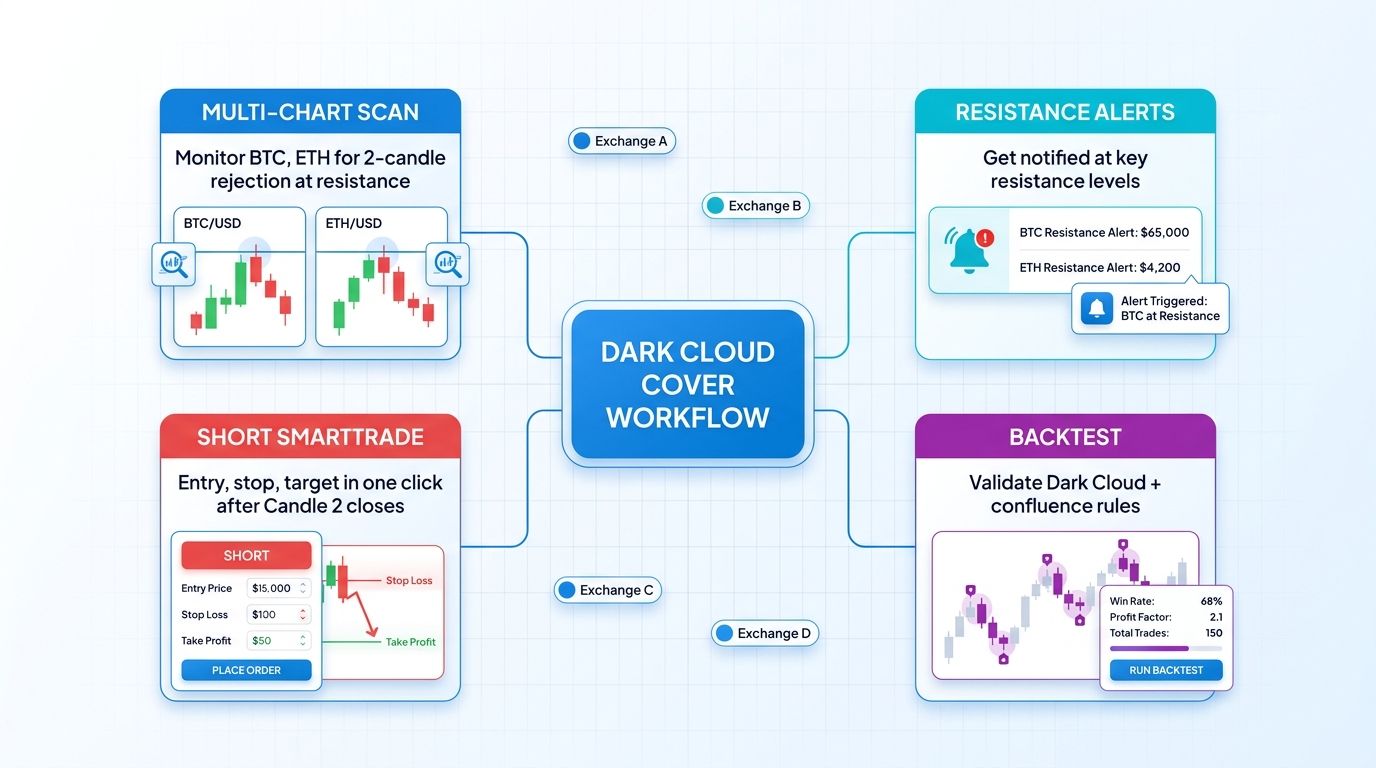
Spotting clean dark cloud covers across dozens of pairs is tiring manually. Altrady is built for exactly this kind of multi-market scanning and execution workflow.
- Multi-chart view: watch several pairs and timeframes side by side to catch a setup on ETH while tracking BTC's trend context.
- Price alerts: set alerts at resistance so you never miss the candle forming.
- SmartTrade orders: attach entry, stop loss, and multiple take-profit targets in one ticket, matching the framework above.
- Paper trading: practice the pattern with zero risk before committing capital.
- Backtest and base scanner tools: check how the pattern performs on your favorite pairs across market regimes.
If you want a unified workspace to identify bearish reversal setups and execute them with disciplined risk, start your free trial with Altrady and see how the tools feel on live markets.
Frequently Asked Questions
Is dark cloud cover a reliable pattern?
Dark cloud cover is a useful early warning of a bearish reversal but it is not a standalone strategy. Studies and trader experience generally suggest the pattern works best when combined with resistance, high volume on Candle 2, and overbought momentum readings. On its own, accuracy tends to be modest. With multiple layers of confluence and strict penetration requirements, it becomes a reliable part of a broader playbook, especially on daily and 4-hour timeframes where noise is reduced.
What is the difference between dark cloud cover and bearish engulfing?
The comparison of dark cloud cover vs bearish engulfing comes down to how deeply Candle 2 closes into Candle 1. In a dark cloud cover, Candle 2 closes below the midpoint of Candle 1 but above Candle 1's open. In a bearish engulfing, Candle 2's body fully covers Candle 1's body, closing at or below Candle 1's open. Bearish engulfing is usually seen as the stronger signal because sellers have taken out the entire prior bullish range.
Can dark cloud cover appear in crypto without a gap up?
Yes. Because crypto trades 24/7, there is rarely a literal overnight gap. Traders adapt by treating the pattern as a behavior signal rather than a strict gap pattern. If Candle 2 wicks above Candle 1's high and then closes below Candle 1's midpoint, most crypto traders accept it as a valid dark cloud cover. The underlying psychology (bullish push, intraday rejection, deep bearish close) is what drives the signal, not the literal opening gap.
What timeframe is best for trading dark cloud cover?
Higher timeframes generally produce stronger signals. The daily chart is the classic home of dark cloud cover because each candle represents a full session of positioning. The 4-hour chart is a solid compromise for active traders. The 1-hour chart can work but produces more false signals and demands tighter risk controls. Lower than 1-hour, noise tends to overwhelm the pattern. Pick a timeframe that matches your holding period and trade only patterns that align with the higher timeframe trend.
Where should I place my stop loss for a dark cloud cover trade?
A common approach is to place the stop just above the high of Candle 2, since that high represents the failed bullish breakout. Giving the stop a small buffer (a fraction of a percent or a few ticks) helps avoid wick stop-outs. If Candle 2's high is very far from your entry and creates poor risk-reward, either wait for a tighter retest entry or reduce position size so the total dollar risk stays within your plan.
Conclusion
Dark cloud cover is a clean, repeatable 2-candle pattern that marks the moment bulls lose control at or near resistance. The setup captures a simple but powerful story: buyers push one more time, sellers overwhelm them intraday, and price closes deep into the prior bullish body. When combined with a clear uptrend, volume confirmation, and a thoughtful entry, stop, and target framework, the pattern becomes a practical tool rather than a chart curiosity.
Crypto traders need to adjust for the 24/7 nature of the market by treating the gap-up requirement as optional and focusing instead on the penetration depth and rejection behavior. Pair that adjustment with solid confluence at resistance, and you have a repeatable bearish reversal setup you can scan for across dozens of pairs. Ready to put the pattern to work with a professional toolkit? Start your free trial with Altrady and begin spotting dark cloud cover setups across your favorite crypto markets today.