What Is a Doji Candlestick Pattern?
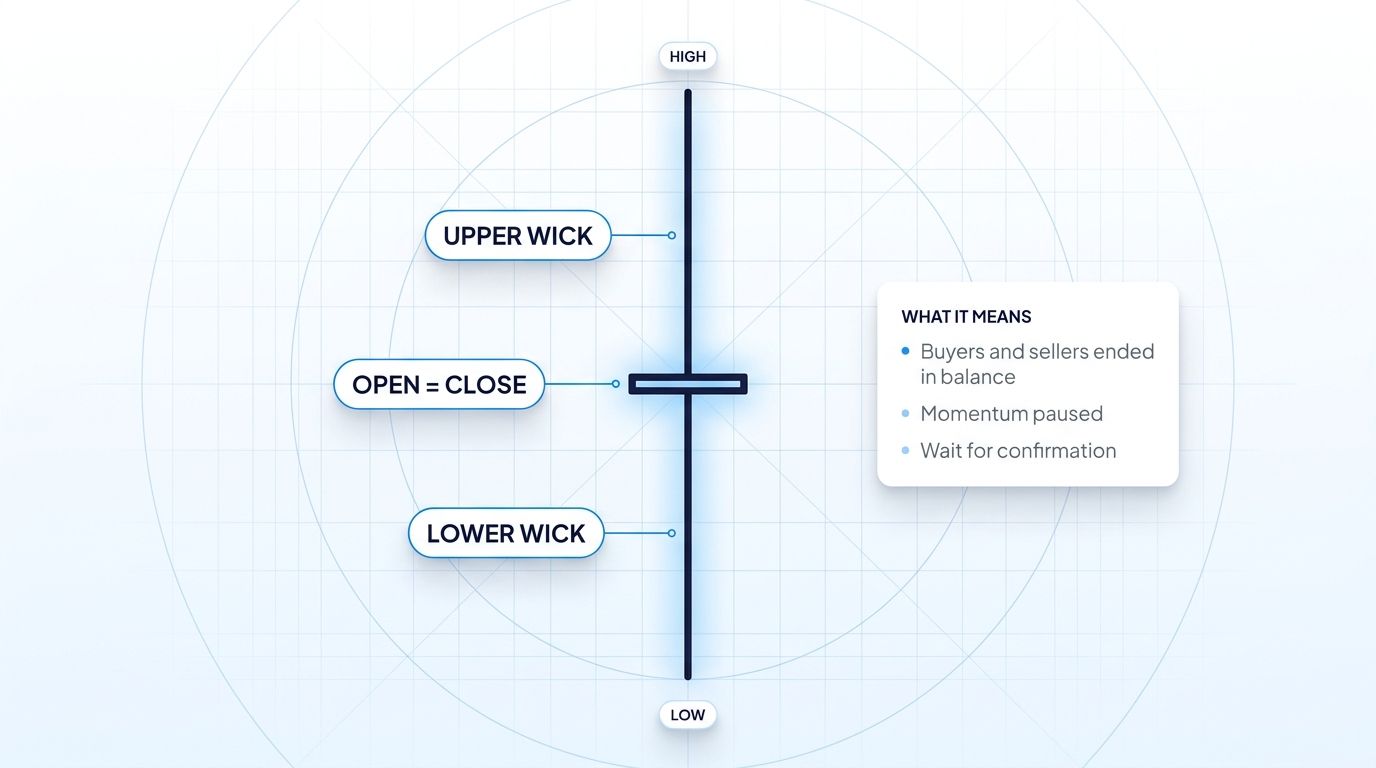
A doji candlestick pattern is a single-candle formation where the open and close prices are virtually identical, creating a thin horizontal line or cross shape on the chart. The visual hallmark is simple: almost no real body, with wicks extending above, below, or on both sides. For active crypto traders, a doji candlestick pattern is one of the clearest visual cues that momentum has stalled and buyers and sellers are locked in a temporary standoff.
The reason traders pay attention to the doji candlestick pattern is psychological. When a candle opens and closes at the same level after a session of pushing and pulling, it tells you neither side could close the period in their favor. That pause often precedes a shift in direction, especially when the doji appears after an extended move or at a technically significant price level. On its own, the doji does not predict which side will win next, but it signals that the current trend has lost conviction.
A doji is best understood as a question the market is asking itself. The answer comes in the form of the next candle. That is why experienced traders never act on a doji in isolation. They treat it as a heads-up that a setup may be forming, then use confirmation tools such as volume, support and resistance, and momentum indicators to decide whether to act.
How to Identify a Doji on a Chart
Spotting a doji candle is straightforward once you know what to look for. A true doji has the following characteristics:
- Open and close prices are extremely close, typically within 0.05 to 0.1 percent of each other
- The candle body looks like a horizontal line or a small cross shape, with little to no visible fill
- Upper and lower wicks show the intraday trading range, which can be small or very wide depending on volatility
- It can appear on any timeframe, but the pattern gains significantly more weight on the 4-hour, daily, and weekly charts
On lower timeframes such as 1-minute or 5-minute charts, dojis appear constantly and are often just market noise. On higher timeframes, a doji reflects hours or days of collective indecision, which is much more meaningful. When scanning for doji setups, your eyes should be drawn to candles that look almost two-dimensional compared to their neighbors. If the body is visible as a clear rectangle, it is not a doji, it is a small-bodied candle, which carries different implications.
Types of Doji Candlestick Patterns
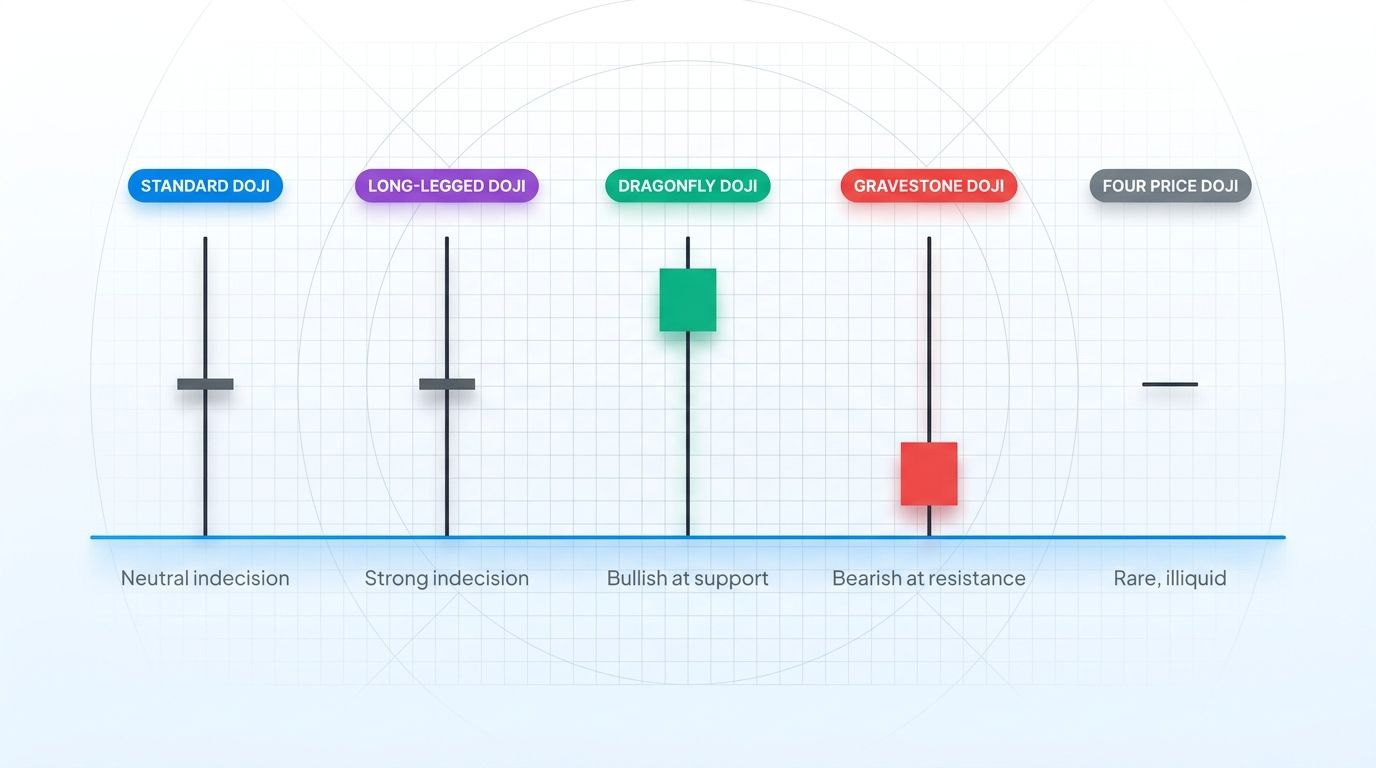
Not every doji candle means the same thing. The length and placement of the wicks tell you what kind of indecision is on display, and each variant has its own typical use case. Here are the five main types every crypto trader should recognize.
Standard Doji
A standard doji has a small body with roughly equal wicks on top and bottom. The candle looks like a plus sign. This is the most neutral version of the pattern and signals general indecision without any directional bias. On its own, a standard doji does not suggest a reversal. It simply tells you that the current push has lost steam. Context from the surrounding price action determines whether it matters.
Long-Legged Doji
The long-legged doji has very long wicks on both sides, with the body sitting near the middle of the range. It shows extreme volatility within the session but a complete lack of directional resolution. Long-legged dojis often appear after news events, high-volume sessions, or sharp moves that get fully retraced. They are a strong signal that the market is genuinely uncertain and that a meaningful shift may be building.
Dragonfly Doji
A dragonfly doji forms when the open, close, and high are essentially the same price, with a long lower wick. Visually, it looks like a capital T. This variant is a classic bullish reversal signal when it appears at a support level during a downtrend. It shows that sellers pushed price lower during the session, but buyers absorbed all the selling pressure and closed the candle back at the highs. When paired with rising volume, a dragonfly doji at support is one of the higher-probability reversal setups in the doji family.
Gravestone Doji
The gravestone doji is the mirror image of the dragonfly. Open, close, and low are essentially the same, with a long upper wick. The shape resembles an inverted T. A gravestone doji at resistance after an extended uptrend is a bearish reversal signal. It tells you that buyers tried to push higher, failed, and price collapsed back to the opening level. This is often a sign that distribution is happening and that a top may be forming.
Four Price Doji
The four price doji is extremely rare. Open, close, high, and low are all the same price, forming a single horizontal line with no wicks at all. It indicates zero volatility during the session, which usually happens only in illiquid markets or during very low-volume hours. In crypto, you will occasionally see four price dojis on small-cap altcoins during dead weekend trading hours. They are generally not actionable on their own.
What a Doji Really Tells You About Market Sentiment
A doji is a snapshot of a battle that ended in a draw. Buyers attempted to push price higher, sellers tried to push lower, and by the close neither side had made progress. That equilibrium matters because markets do not stay in equilibrium for long. One side eventually gains control, and the direction of that resolution is what you are trying to catch.
Momentum traders should think of a doji as a pause signal. If price has been trending higher and suddenly prints a doji at resistance, the trend is no longer in full control. That does not automatically mean reversal, but it does mean you should tighten stops, lighten exposure, or plan a counter-trend entry. The same logic applies in reverse during downtrends.
The key insight is that the next candle confirms intent. A doji followed by a strong bullish engulfing candle tells a very different story than a doji followed by another weak candle. Treat the doji as the setup and the next candle as the trigger.
How to Trade a Doji Pattern
Trading doji crypto setups consistently requires a repeatable process. The pattern is common, which makes it easy to get excited and take low-quality trades. These four rules filter the noise so you focus on setups that actually have an edge.
Rule 1: Always Require Confirmation
A doji alone is not a trade signal. Wait for the next candle to close in a clear direction before entering. For a bullish reversal after a dragonfly doji, do not enter until the next candle closes strongly above the doji high. Jumping in before confirmation means trading the absence of information.
Rule 2: Context Matters More Than the Candle
A dragonfly doji in the middle of a range means almost nothing. The same dragonfly forming at a daily support level after an extended downtrend is a high-probability reversal setup. Always ask where the doji is forming. Support, resistance, Fibonacci levels, moving averages, and prior swing points are the zones where dojis matter most.
Rule 3: Use Volume as a Filter
A doji with above-average volume carries significantly more weight than a doji in thin trading. High volume at an indecision candle means a large number of participants were active, which increases the probability that the resolution will be meaningful. Low-volume dojis, especially on weekends in crypto, often resolve into nothing more than continued chop.
Rule 4: Combine With Support, Resistance, Trend, or Indicators
Confluence is what separates amateur pattern traders from professionals. Pair your doji signal with EMA 50 or EMA 200 tests, Fibonacci retracement levels at 0.382, 0.5, or 0.618, prior swing highs or lows, or momentum divergences on RSI or MACD. The more independent factors that line up, the more reliable the doji reversal becomes.
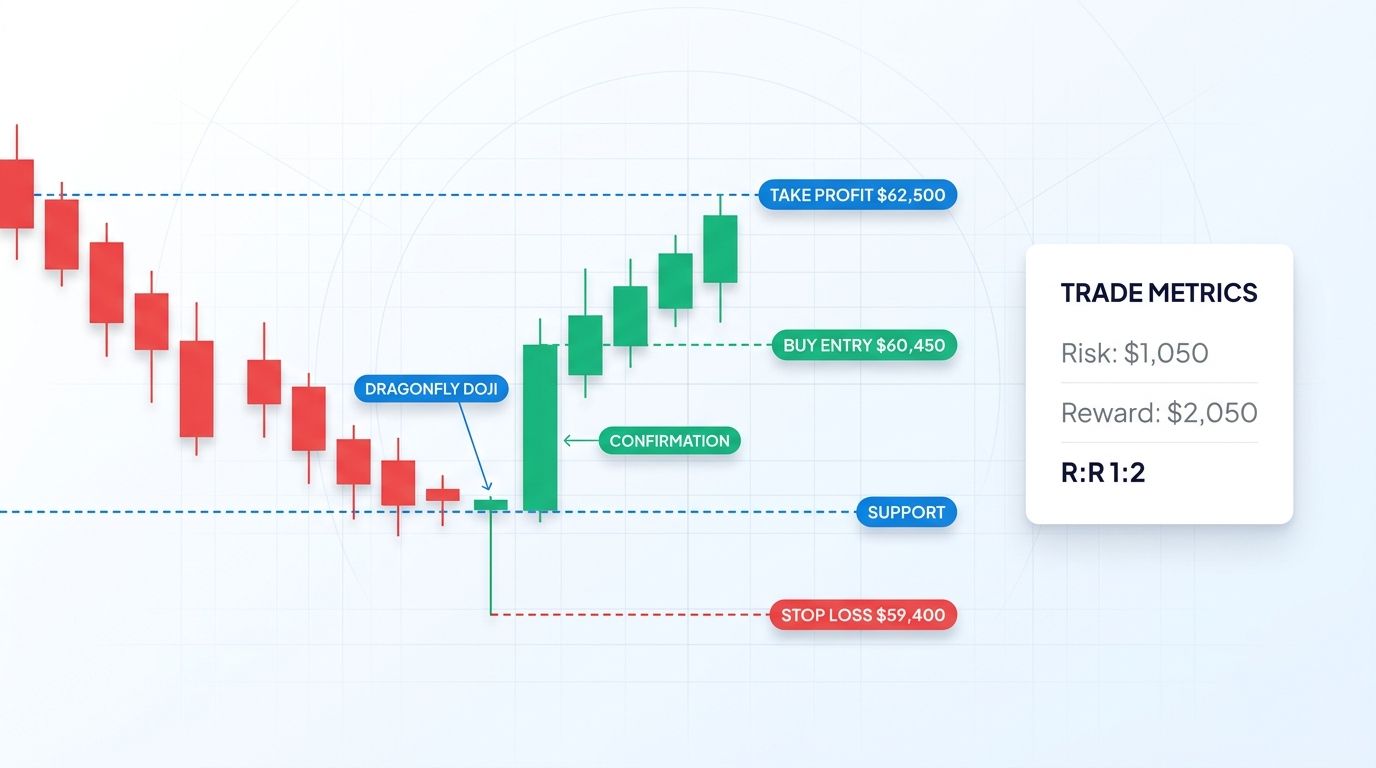
Example: Trading a Dragonfly Doji at Support
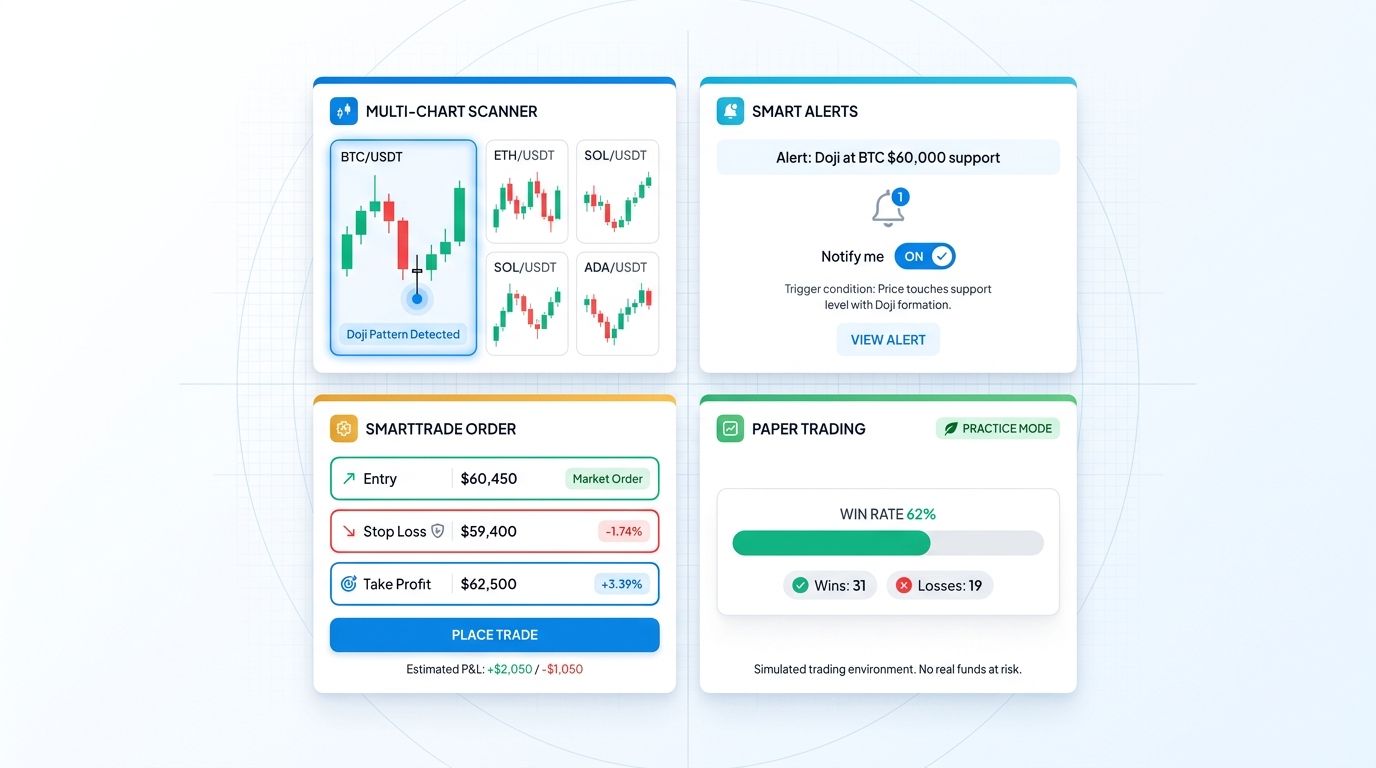
Here is a walk-through of a specific setup. Imagine BTC has been in a multi-day downtrend on the 4-hour chart and is approaching a well-tested support level at 60,000 USD. Price touches that level and prints a dragonfly doji with a long lower wick, closing right back at the highs of the session. Volume on the doji candle is clearly above the recent average.
The trade plan works like this. You do not enter on the doji. You wait for the next 4-hour candle. If it closes above the doji high with continued volume, that is your confirmation. Your entry goes just above the confirmation candle high, for example at 60,450 USD. Your stop-loss sits just below the doji low, which is the lowest point of the long wick, for instance at 59,400 USD. Your first target is the next visible resistance or swing high, perhaps at 62,500 USD. That setup gives you a defined risk-to-reward ratio around 1:2 or better, with a clear invalidation level and a logical target.
If the confirmation candle fails to close above the doji high, you do nothing. No trade. The setup did not complete. Walking away from unconfirmed dojis is what keeps your account healthy over time.
Common Mistakes When Trading Doji Patterns
Most traders who struggle with dojis make the same handful of errors. Avoiding these will dramatically improve your results.
- Treating every doji as a reversal signal. Most dojis resolve as continuations or simply fade into the existing trend. Location and context determine whether a reversal is likely.
- Ignoring the prior trend. A doji has meaning only in relation to what came before it. Without a clear trend, the signal is diluted.
- Entering without a confirmation candle. Pre-empting the confirmation turns a high-probability setup into a coin flip.
- Using dojis in ranging markets where they are noise. During sideways consolidation, dojis print constantly and carry no predictive value.
- Not adjusting position size for uncertain signals. Even confirmed dojis carry more uncertainty than trend-continuation setups. Size down accordingly and protect your capital.
Doji Pattern in Crypto Markets: What Makes It Different
Crypto markets behave differently from traditional equities, and the doji pattern reflects those differences. Crypto trades 24/7 with heavy volume drops over weekends and sharp spikes driven by whale activity or news. A doji crypto setup often forms during thin liquidity hours and may not survive contact with Monday volume.
Higher timeframe dojis carry much more weight than intraday ones in crypto. A daily or weekly doji on BTC or ETH at major support or resistance is a genuine signal worth monitoring. A 15-minute doji during a slow Sunday afternoon usually means nothing. Low-float altcoins are especially prone to false dojis because a single large order can open and close a candle at the same price without any real market agreement.
Most discretionary traders focus doji analysis on BTC, ETH, and top-50 market cap coins, where the pattern has more statistical backing. Smaller-cap tokens can be monitored, but setups there should require even stronger confluence and tighter risk controls.
How Altrady Helps You Spot and Trade Doji Patterns
Altrady is a multi-exchange crypto trading terminal built for active traders who need speed, precision, and clean execution. Several features directly support doji-based workflows.
- Multi-exchange charting lets you watch BTC, ETH, and altcoins across Binance, Kraken, Coinbase, and dozens of other exchanges on a single screen, so you never miss a forming doji on your preferred pair.
- Custom alerts at support and resistance levels notify you the moment price reaches a zone where a doji would matter, so you can review the candle formation instead of constantly staring at charts.
- SmartTrade orders let you place entry, stop-loss, and take-profit in one click, which is exactly what you need after a doji confirmation candle closes.
- The Altrady backtest tool lets you validate doji plus confluence strategies on historical data before going live, so you know which setups actually produce results on the pairs and timeframes you trade.
- Paper trading mode gives you a risk-free environment to practice identifying dojis, waiting for confirmation, and executing setups without putting capital at risk.
If you want to turn doji pattern recognition into a repeatable edge, you can start a free Altrady trial and explore the full toolkit risk-free.
Frequently Asked Questions
Is a doji candlestick bullish or bearish?
A doji is neither bullish nor bearish on its own. It signals indecision. The meaning comes from its location, whether it forms at support or resistance, the prior trend, and the confirmation candle that follows. The same doji shape can be bullish at support after a downtrend and bearish at resistance after an uptrend.
What is the most reliable doji pattern?
Dragonfly and gravestone dojis at key levels with volume confirmation are the most reliable variants. Standard dojis in the middle of a range are usually noise. The highest-probability setups combine a dragonfly at support or a gravestone at resistance with above-average volume and a clear prior trend.
How do I confirm a doji reversal?
Wait for the next candle to close strongly in the opposite direction of the prior trend. For a bullish reversal, the confirmation candle should close above the doji high with above-average volume. For a bearish reversal, look for a strong close below the doji low. Entering before confirmation is guessing.
Do dojis work on lower timeframes like 5-minute charts?
They appear constantly on low timeframes but have low reliability. Scalpers can use them with strict risk management, but most traders get better results focusing on 1-hour and higher charts for swing setups, and 4-hour or daily charts for position trading. Higher timeframe dojis reflect more collective decision-making and produce cleaner signals.
Can I trade dojis in crypto the same way as stocks?
The core principles are the same, but crypto's 24/7 nature and higher volatility mean you should demand stronger confluence and use tighter risk management. Weekend dojis often get invalidated by Monday liquidity. Focus on BTC, ETH, and top-50 coins where the pattern has more statistical backing, and always adjust position sizing to reflect crypto's wider average true range.
Conclusion
The doji candlestick pattern is a pause signal, not a standalone trade signal. It tells you that buyers and sellers fought to a draw and that the current trend has lost conviction, but it does not tell you what happens next. Consistent results come from combining dojis with context, confirmation, and confluence. Know which variant you are looking at, where it is forming, what the prior trend looks like, and what the next candle does before acting.
If you want to apply these rules across multiple exchanges with professional-grade tools, try Altrady free. Use the paper trading mode to practice spotting and trading dojis without risking capital, then graduate to live markets once the process feels automatic.