Picture this: Bitcoin has rallied for two weeks and finally pushes into a major resistance zone near $72,000. The next session prints a small-bodied candle at the highs, and the one after closes deep into the prior bullish body. That sequence is the evening star candlestick pattern, and it often marks the turning point before a sharp decline. This guide walks through how to identify it, why it works, and how to trade it with disciplined risk management.
What Is an Evening Star Candlestick Pattern?
The evening star candlestick pattern is a 3-candle bearish reversal formation that appears after an uptrend and signals a shift from buying pressure to selling pressure. It takes its name from the planet Venus, visible in the evening sky just before darkness falls, a fitting metaphor for the end of a bullish advance.
The pattern's mirror image is the morning star, which marks bullish reversals after downtrends. The evening star is one of the most respected bearish reversal patterns in classical candlestick analysis because it packs a full psychological story into three sessions: strong buying, hesitation, and decisive selling. Traders across equities, forex, and crypto rely on it to time short entries, protect long positions, and anticipate corrections at resistance zones.
How to Identify an Evening Star on a Chart
Spotting the pattern reliably means knowing what each candle must look like and what conditions must surround it. Stick to the strict rules below.
The three-candle structure
The evening star is a textbook 3-candle pattern with a specific sequence:
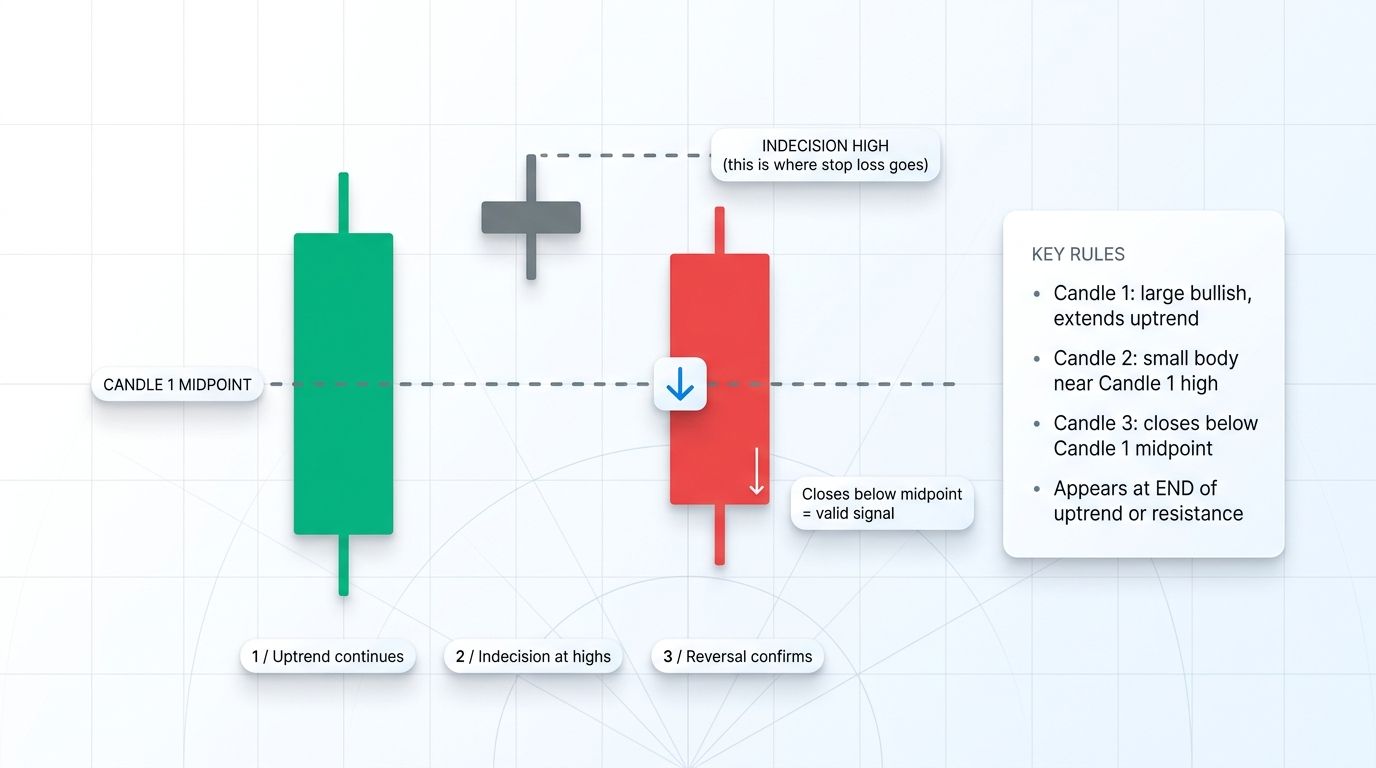
- Candle 1 (large bullish): A tall green or white candle with a body that clearly continues the uptrend. Shows aggressive buying and confirms bullish control heading into the pattern.
- Candle 2 (small indecision or doji): A small-bodied candle that can be bullish or bearish. In crypto, where gaps are rare, look for the body to sit near the highs with long wicks. A doji here is the strongest version.
- Candle 3 (large bearish): A tall red or black candle that closes well into Candle 1's body. The deeper it penetrates, the stronger the reversal signal. It should ideally close past the midpoint of Candle 1.
This sequence captures three distinct phases: trend continuation, stall, and reversal.
Key identification rules
Not every three-candle cluster qualifies. Apply these filters before acting:
- Uptrend prerequisite: The pattern must appear after a meaningful advance, not in choppy, sideways price action. Without an uptrend, there is nothing to reverse.
- Candle 2 small body: The middle candle's body should be visibly smaller than Candle 1's body. A large middle candle breaks the indecision narrative.
- Candle 3 closes past 50% of Candle 1: This is the non-negotiable rule. If Candle 3 only nibbles into Candle 1's body, the reversal is weak and more prone to failure.
- Volume confirmation: Ideally, volume expands on Candle 3 relative to Candle 2. Rising sell-side volume confirms that sellers are genuinely taking control.
- Confluence at resistance: The pattern carries far more weight when it forms at a prior swing high, a round number, a Fibonacci extension, or a known supply zone.
Why the Evening Star Works: The Psychology
Every candlestick pattern is a map of crowd psychology, and the evening star tells a clean story. Candle 1 shows the uptrend is healthy, with buyers pushing price higher and holding gains into the close. Most participants expect continuation.
Candle 2 is the inflection point. Price tries to push higher but fails to close at new highs. Buyers are still present, but new buying is no longer aggressive enough to overwhelm sellers. Long wicks, small bodies, or a doji visualize this handover of control.
Candle 3 is capitulation. Early longs book profits, trapped late longs cut losses, and fresh short sellers step in. The aggressive close deep into Candle 1 signals that the bulls have officially lost the initiative. The pattern is essentially a three-session handover from buyers to sellers, visible on the chart before most indicators confirm the shift.
Evening Star vs Other Bearish Reversal Patterns
The evening star is not the only bearish reversal signal traders watch. Understanding how it differs from similar patterns helps you pick the right tool.
Evening Star vs Bearish Engulfing
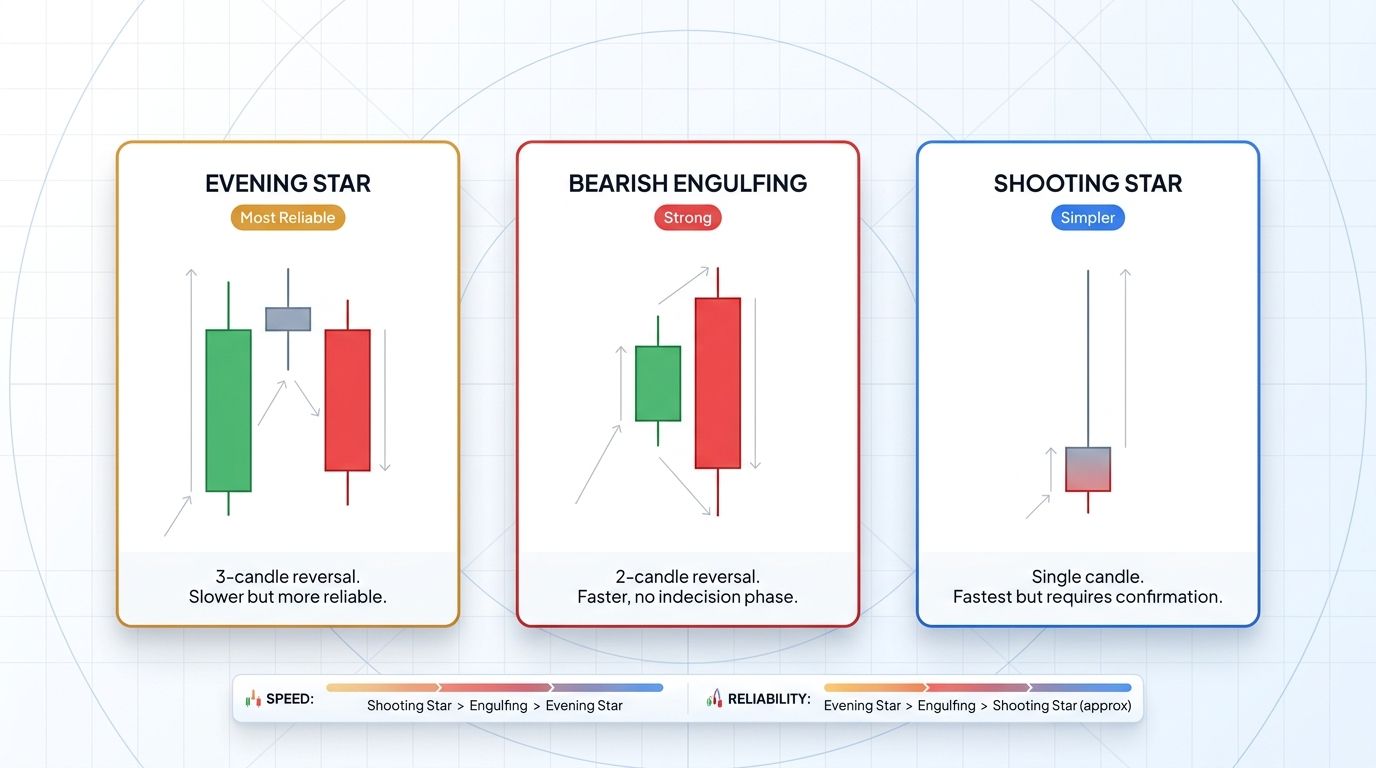
When comparing evening star vs bearish engulfing, the key difference is candle count. Bearish engulfing is a 2-candle signal where a large bearish candle completely engulfs the prior bullish candle. The evening star is a 3-candle pattern with an indecision candle in the middle.
- Strength: Bearish engulfing is faster but often less reliable because there is no indecision phase.
- Timing: Evening star gives slightly later entries but higher-quality reversals.
- Use case: Bearish engulfing suits momentum traders; evening star suits swing traders who wait for confirmation.
Evening Star vs Shooting Star
The evening star vs shooting star comparison often confuses newer traders because both are bearish reversal signals at the top of uptrends.
- Candle count: A shooting star is a single candle with a small body and long upper wick. The evening star is three candles.
- Signal strength: The evening star is generally more reliable because it encodes a full three-session narrative.
- Relationship: A shooting star can serve as Candle 2 inside an evening star, strengthening the pattern.
Evening Star vs Three Black Crows
Three black crows is another 3-candle pattern, but it lacks a leading bullish session and an indecision middle.
- Structure: Three consecutive large bearish candles, each closing near the lows.
- Context: Often appears after a top has already formed, signaling continuation lower.
- Role: Use it to confirm a completed evening star, not as a standalone reversal in the same spot.
How to Trade an Evening Star Pattern
Pattern recognition alone is not a strategy. The rules below translate the setup into actionable trades with defined risk.
Rule 1: Require a clear uptrend first
The evening star is a reversal pattern, so it needs something to reverse. Confirm the prior trend with a visible sequence of higher highs and higher lows, a rising 20 or 50 period moving average, or a clear breakout rally. Do not take the pattern in chop.
Rule 2: Confirm Candle 3 closes past Candle 1's midpoint
This rule filters out most weak setups. If Candle 3 only closes a fraction of the way into Candle 1, sellers have not yet proven control. Wait for the candle to close, measure the midpoint of Candle 1, and confirm Candle 3 settled below it.
Rule 3: Volume confirmation
Check that Candle 3's volume is at least as high as the recent average and ideally higher than Candle 2. Low-volume reversals often get faded. On crypto exchanges, compare volume across major venues for a cleaner picture.
Rule 4: Use confluence
The highest-probability evening stars form at known resistance: prior swing highs, horizontal supply zones, descending trendlines, or Fibonacci extensions such as 1.272 or 1.618. A pattern aligned with multiple technical levels is far more trustworthy than one floating in open space.
Entry, Stop, Target Framework
Once the pattern confirms, use a simple, repeatable framework:
- Entry: Enter short on the close of Candle 3, or on a retracement to the midpoint of Candle 3 the following session.
- Stop loss: Place your stop just above the high of Candle 2, which is usually the pattern's peak.
- Target 1: The most recent swing low or first visible support zone.
- Target 2: The prior consolidation range or a measured-move projection equal to the height of the pattern.
- Management: Move stop to breakeven once price reaches Target 1, then trail below minor lower highs.
Example: Evening Star at BTC Resistance
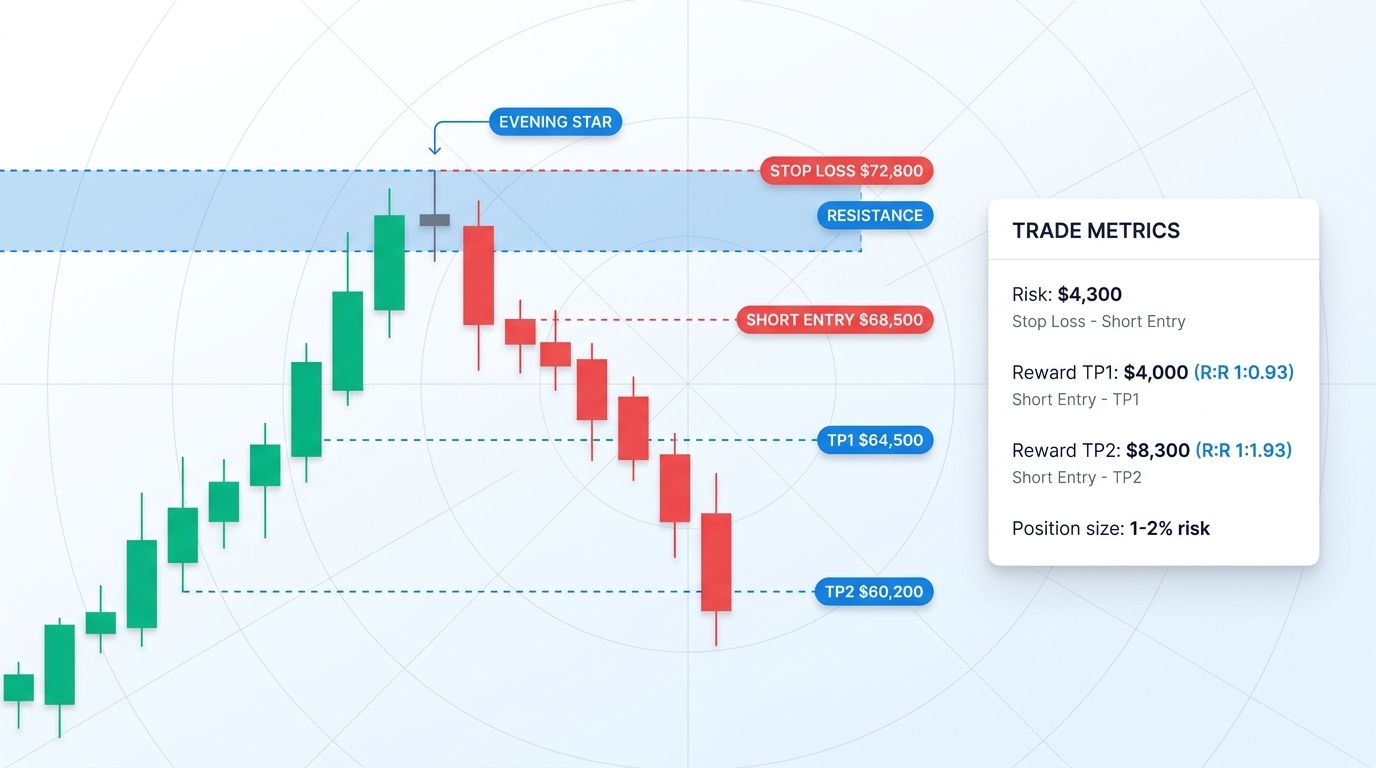
Imagine BTC has rallied from $58,000 to $71,500 over four weeks and is approaching a clear resistance zone around $72,000.
- Day 1: A strong bullish candle closes at $71,400, continuing the rally with healthy volume.
- Day 2: Price pushes to a high of $72,800 but prints a small doji body near the highs, closing at $71,600. Long upper wick, indecision confirmed.
- Day 3: A large bearish candle opens at $71,500 and closes at $68,500, penetrating deep below Candle 1's midpoint with expanded volume.
Trade setup:
- Short entry: $68,500 on Candle 3 close
- Stop loss: $72,800, just above Candle 2's high
- Target 1: $64,500, at the prior swing low
- Target 2: $60,200, at the larger consolidation base
Risk per coin: $72,800 - $68,500 = $4,300. Reward to Target 1: $68,500 - $64,500 = $4,000, giving a risk-reward of about 0.93:1. Reward to Target 2: $68,500 - $60,200 = $8,300, producing a risk-reward of roughly 1.93:1. By scaling out half the position at Target 1 and trailing the rest to Target 2, the blended expectancy stays firmly positive even with a 50% win rate.
Common Mistakes When Trading Evening Stars
Even traders who memorize the rules fall into repeatable traps. Watch for these:
- Trading the pattern in a downtrend or sideways chop. The evening star only reverses uptrends.
- Accepting Candle 3 closes that fail the midpoint rule. A shallow third candle is not a completed pattern.
- Ignoring volume. Weak-volume patterns get overrun in the next session.
- Entering without confluence. A pattern floating in open air is far less reliable.
- Placing stops too tight. Stops below Candle 3 or inside Candle 2 are routinely clipped by wicks.
- Oversizing because the pattern looks clean. The cleanest setups still fail.
- Forgetting the higher timeframe. A daily evening star inside a larger weekly uptrend tends to produce smaller, faster moves than one at major weekly resistance.
Evening Star Patterns in Crypto Markets
Crypto markets have unique characteristics that affect how the evening star behaves.
- 24/7 trading with no gaps: Traditional evening stars often feature gaps between candles. Crypto rarely gaps, so the pattern is defined by body placement and wick structure rather than overnight price jumps.
- Higher volatility: Crypto candles are typically larger than equity candles, which means Candle 3's penetration depth and stop distances are proportionally bigger. Size positions accordingly.
- Timeframe reliability: Daily and 4-hour evening stars tend to produce the cleanest signals. Sub-15-minute patterns generate more noise and false reversals.
- Alt-coin exaggeration: On lower-liquidity altcoins, evening stars can mark sharper reversals, but slippage and wick manipulation are more common. Favor liquid pairs such as BTC, ETH, and top-20 assets.
- Correlated reversals: When BTC prints an evening star at major resistance, altcoins often follow. Use a multi-chart view to watch BTC and key alts simultaneously.
How Altrady Helps You Spot and Trade Evening Star Patterns
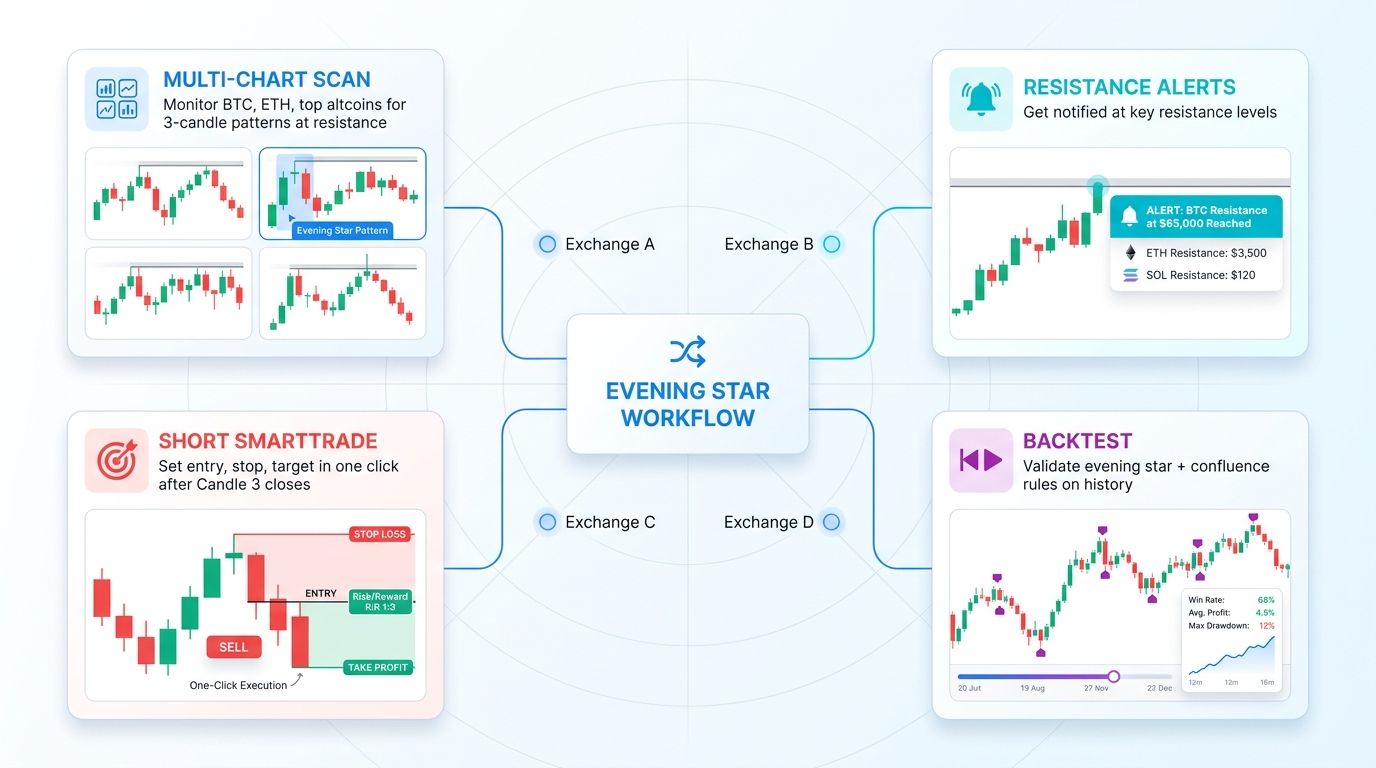
Finding and executing evening star setups across dozens of pairs is a full-time job without the right tooling. Altrady is built for this workflow.
- Multi-chart view: Monitor BTC, ETH, and your top watchlist pairs side by side, so you catch evening stars forming at resistance across multiple markets without tab hopping.
- Custom alerts: Set price alerts at known resistance zones so you are notified the moment Candle 1 or Candle 2 prints near your levels.
- SmartTrade orders: When the pattern confirms, place entry, stop loss, and multiple take-profit targets in a single order ticket with automatic scaling and trailing stops.
- Paper trading: Validate your rule set in live market conditions before risking real capital.
- Backtest: Test how evening star entries would have performed on your favorite pairs and timeframes, then refine your filters.
To trade high-quality bearish reversals with structured risk, start your free trial with Altrady and explore the full multi-exchange toolkit built for serious crypto traders.
Frequently Asked Questions
Is the evening star pattern reliable?
The evening star is one of the more reliable candlestick reversal patterns when strict rules are followed. Studies across equities and crypto typically show win rates in the 55% to 65% range when the pattern forms at meaningful resistance with volume confirmation. Reliability drops sharply if you ignore the midpoint rule, trade the pattern in choppy markets, or skip confluence. Treat it as one input in a broader trading plan rather than a standalone signal, and pair it with risk management for best results.
What is the difference between an evening star and a shooting star?
A shooting star is a single candle with a small body and a long upper wick, appearing after an uptrend. An evening star is a three-candle pattern: a large bullish candle, a small indecision candle, and a large bearish candle closing deep into the first. The evening star encodes more information and is generally considered the higher-probability signal. A shooting star can actually serve as the middle candle inside an evening star, which further strengthens the pattern.
Can an evening star appear without a gap?
Yes, and in crypto it almost always does. Classical evening stars on stocks often include gaps between candles because equity markets have overnight pauses. Crypto trades 24/7, so true gaps are rare. In crypto, focus on body placement, wick structure, and the relative size of each candle rather than gaps. A valid crypto evening star still requires a tall bullish Candle 1, a small-bodied Candle 2 near the highs, and a large bearish Candle 3 that closes past the midpoint of Candle 1.
What timeframe is best for trading evening stars?
The daily and 4-hour timeframes tend to produce the highest-quality evening star signals in crypto. These timeframes filter out much of the intraday noise and align with how swing traders and institutional desks operate. The 1-hour timeframe can work for active traders with tight risk control. Timeframes below 15 minutes generate frequent false signals, especially on lower-liquidity pairs. If you are new to the pattern, start on the daily chart of BTC or ETH, then gradually work down as your recognition improves.
How do I set a stop loss for an evening star trade?
Place your stop loss just above the high of Candle 2, which is typically the peak of the pattern. This level invalidates the bearish reversal if broken, so it is a natural invalidation point. Avoid placing stops inside Candle 3 or directly at Candle 2's close, because normal volatility and wicks will clip them out. For volatile crypto pairs, adding a small buffer, such as 0.3% to 0.5% above Candle 2's high, reduces whipsaw risk without giving up meaningful edge.
Conclusion
The evening star candlestick pattern is a battle-tested bearish reversal signal that shows the full handover from buyers to sellers in just three sessions. When it forms at resistance, with volume confirmation and a Candle 3 close past the midpoint of Candle 1, it gives traders a structured way to enter shorts, protect long positions, and anticipate corrections. Pair the pattern with disciplined entries, clear stops above Candle 2, and scaled-out targets, and you have a repeatable setup across BTC, ETH, and the broader crypto market. To put these rules into practice, start your free trial with Altrady and sharpen your edge with real tools, real alerts, and real execution.