Most candlestick patterns are easy to spot but hard to trade. The Hanging Man is the textbook example - a small-bodied candle with a long lower shadow that appears at the top of an uptrend and warns that buyers are running out of fuel. Get the context right and it is one of the highest-conviction bearish reversal signals in technical analysis. Get it wrong and you short into a continuation that grinds your stop. This guide covers exactly what makes a valid Hanging Man, how to confirm it, and how to trade it without getting chopped.
What Is the Hanging Man Pattern?
The Hanging Man is a single-candle bearish reversal pattern that appears at the top of an uptrend. The shape is distinctive: a small real body at the upper end of the candle's range, a long lower shadow at least twice the size of the body, and little or no upper wick. The body color (red or green) matters less than the shape - a green Hanging Man is technically slightly less bearish than a red one, but both are warning signs.
The name comes from the visual resemblance to a person hanging - a small head (body) with long legs (lower wick) dangling below. The psychology is what matters: during the day, sellers pushed price significantly below the open, but buyers managed to push back up to close near the open. Price action looks neutral on the close, but the intraday range reveals that selling pressure has entered the market for the first time in the recent uptrend.
Anatomy of a Hanging Man Candle
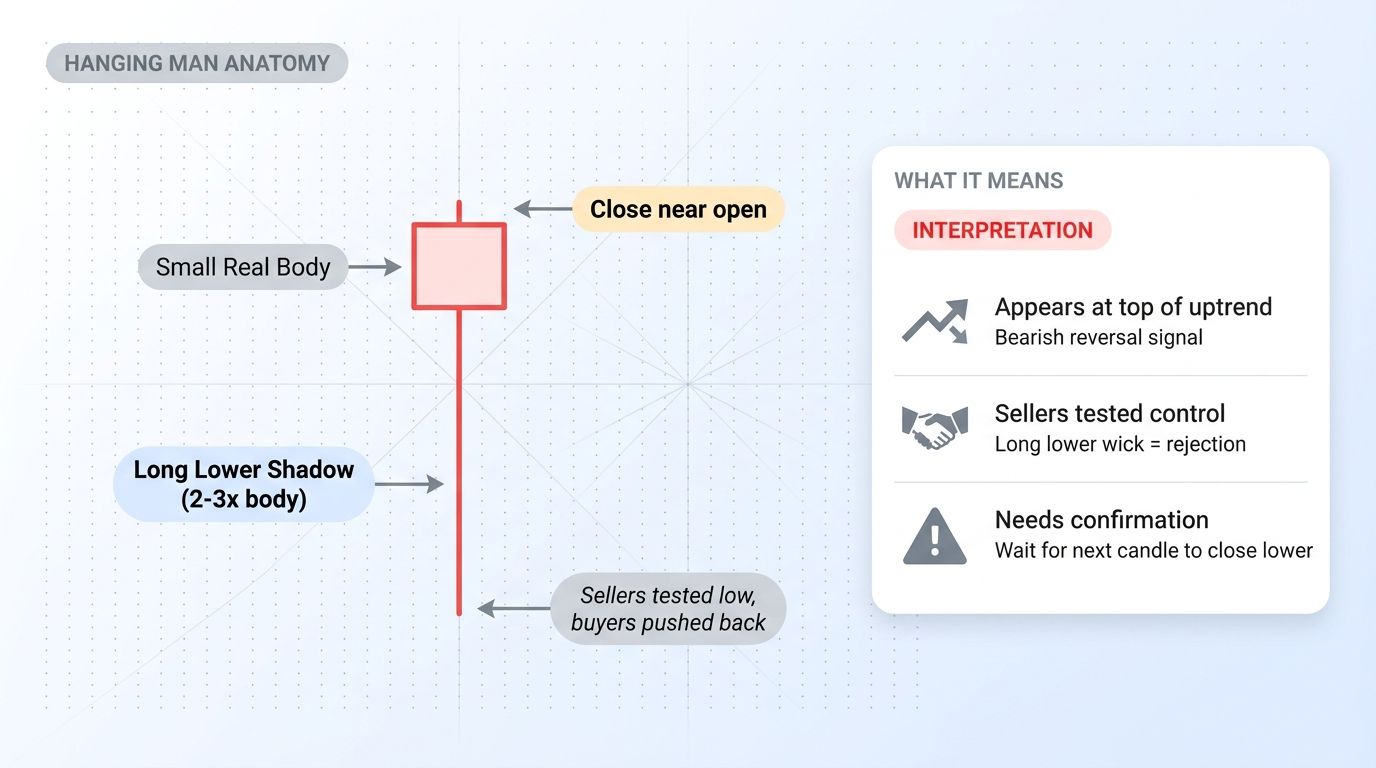
A valid Hanging Man has four specific characteristics:
- Small real body located at the upper third of the candle's full range. The body should be relatively small compared to recent average candle bodies.
- Long lower shadow at least 2x (preferably 3x) the size of the real body. This is the defining feature.
- Little to no upper shadow. The body should be at or very near the high of the candle.
- Appears after a sustained uptrend. Without prior bullish context, the same shape is just a hammer or a doji - it carries no bearish meaning.
The color of the body is secondary. A red Hanging Man (close below open) shows slightly more bearish conviction than a green Hanging Man (close above open), but the shape and context are what signal the potential reversal.
Hanging Man vs Hammer (Critical Difference)
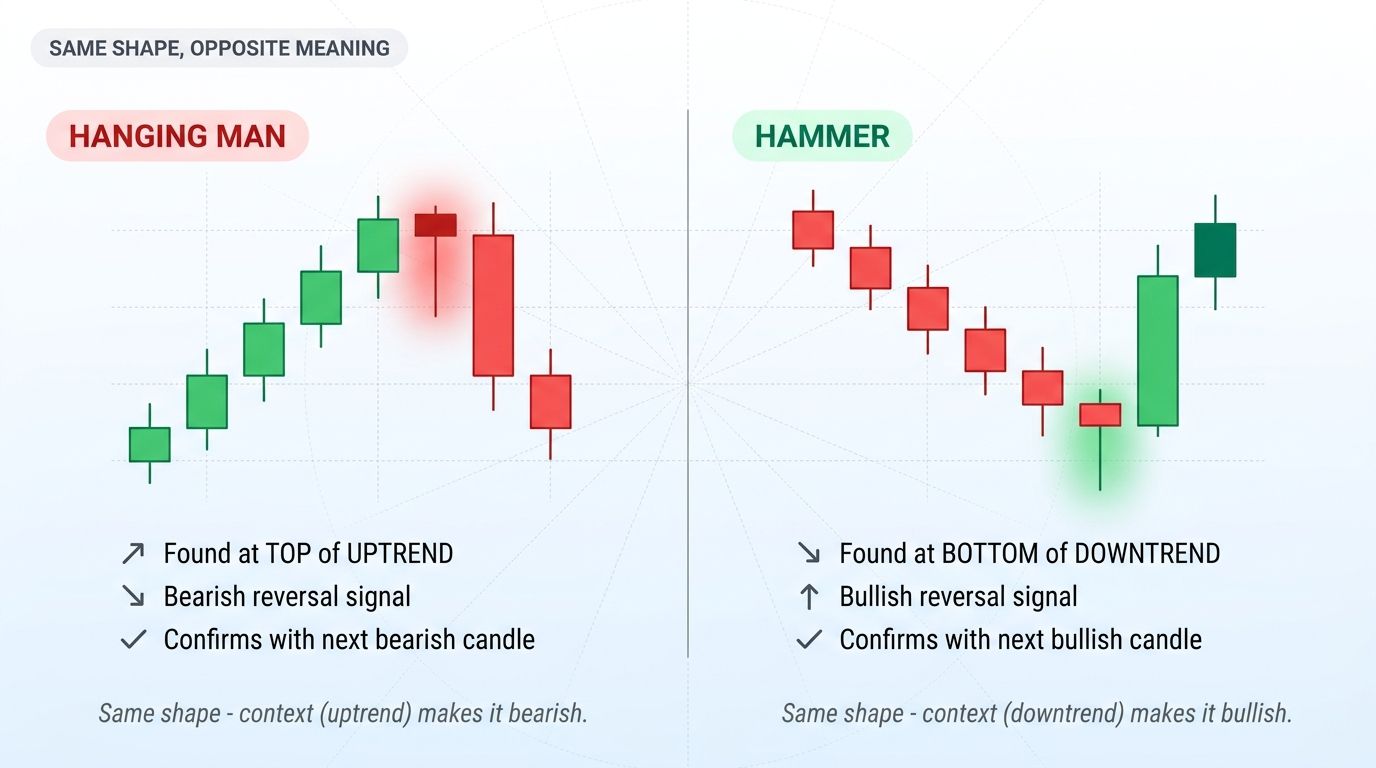
The Hanging Man and the Hammer are visually identical - same body, same long lower shadow, same minimal upper wick. The difference is entirely contextual:
- Hammer: appears at the bottom of a downtrend. Bullish reversal signal. Says "sellers tested lower prices, buyers stepped in aggressively to push back up - buying interest is returning."
- Hanging Man: appears at the top of an uptrend. Bearish reversal signal. Says "for the first time in this uptrend, sellers had enough force to push price significantly lower - even though buyers reclaimed the level, the selling pressure is new and concerning."
This is why context drives interpretation. The same candle pattern at $50,000 BTC after a month-long uptrend is bearish. At $20,000 BTC after a month-long downtrend, it is bullish. Always identify the trend first, then read the candle.
How to Identify a Valid Hanging Man
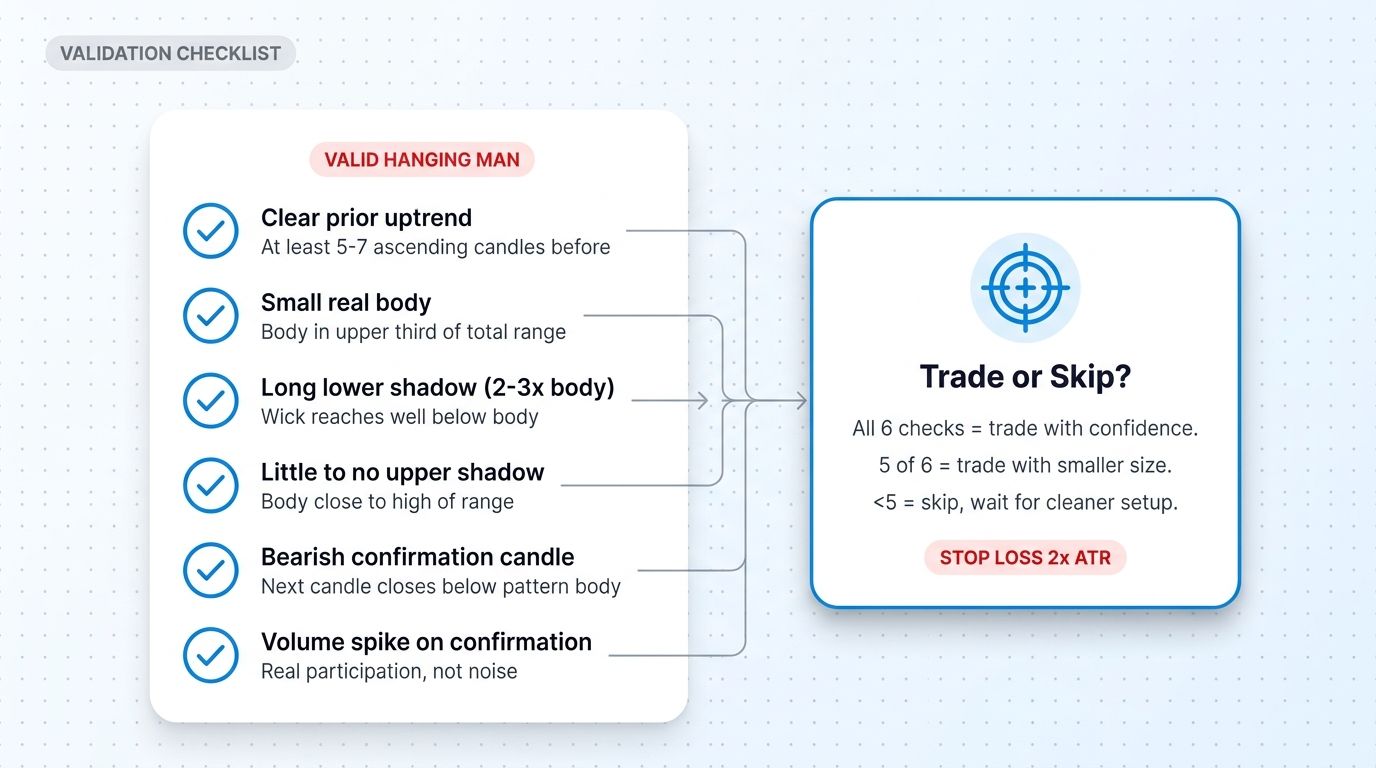
Run any potential Hanging Man through this validation check before treating it as a tradable signal:
- Clear prior uptrend? At least 5-7 ascending candles showing higher highs and higher lows. No uptrend, no Hanging Man - just a candle with a long wick.
- Body in upper third of range? The body should clearly sit at the top of the candle's high-to-low span.
- Lower shadow at least 2x the body? Measure visually or with the candle's high/low/open/close numbers.
- Upper shadow minimal or absent? Body should be close to the candle's high. Significant upper shadow disqualifies the pattern.
- Volume spike? Higher-than-average volume on the Hanging Man candle increases conviction. Volume confirms participation.
If all five check, the pattern is valid. If 4 of 5 check, the pattern is tradable with smaller size. Below 4 of 5, skip and wait for cleaner setup.
How to Trade the Hanging Man
The Hanging Man itself is only the warning. Trading it requires waiting for confirmation from the next candle.
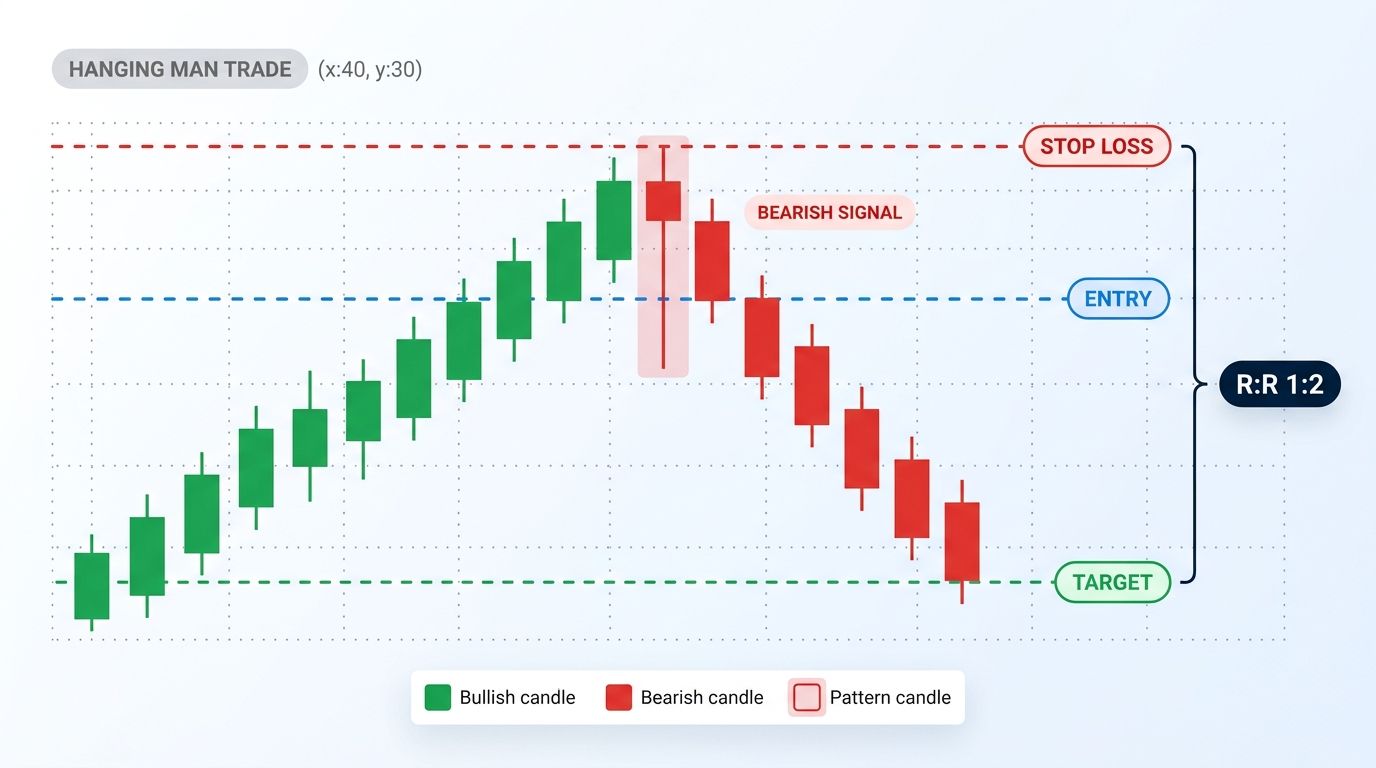
Entry rules
- Wait for the candle after the Hanging Man to close lower than the Hanging Man's body (some traders require a close below the Hanging Man's low for higher conviction).
- Enter short at the open of the candle following the confirmation, OR on a break of the Hanging Man's low if you are using intraday triggers.
Stop loss
- Place stop just above the high of the Hanging Man candle, plus a small buffer (5-10% of the average daily range).
- If the high of the Hanging Man is broken, the bearish thesis is invalidated and the trade is over.
Take profit
- Target the most recent significant support level (prior swing low, 50% Fibonacci retracement, etc.).
- Demand a minimum 1:2 risk-reward. If the target does not give 1:2, skip the trade.
Single-candle patterns are weaker than multi-candle patterns (engulfing, three black crows). Use Hanging Man as one input among several - combined with overbought oscillators (RSI > 70), prior resistance levels, and divergences, the conviction stacks.
Confirmation Signals to Pair With Hanging Man
Trade the Hanging Man with corroborating evidence to filter false signals:
- Bearish RSI divergence. Price made a higher high but RSI made a lower high. Combined with Hanging Man at the higher high, the reversal odds increase significantly.
- Resistance level rejection. Hanging Man forming at a clear prior swing high or fib level adds context.
- Bearish engulfing as confirmation. If the candle after the Hanging Man is a large bearish engulfing, the reversal signal is now multi-candle and far stronger.
- Volume spike on Hanging Man + volume spike on confirmation. Two days of elevated volume around a reversal is institutional repositioning, not retail noise.
- Higher-timeframe trend exhaustion. If the daily trend has run for weeks and Hanging Man appears on the 4-hour, the higher-timeframe context supports the reversal.
Common Mistakes Traders Make with Hanging Man
The pattern is simple. Most failures come from breaking these rules:
- Trading without confirmation. The Hanging Man alone fails roughly 50% of the time. Wait for the next-candle bearish close before entering. Yes, you give up some price - that price is the cost of filtering false signals.
- Ignoring trend context. Hanging Man in a sideways market is just a candle. The pattern requires a sustained uptrend to mean anything.
- Tightening stops to the body close. Crypto routinely whips through small wicks on overnight liquidity events. Place stops above the Hanging Man's high with a buffer.
- Confusing with Hammer at support. If the same shape appears after a downtrend and at support, it is a Hammer (bullish), not a Hanging Man. Read context first.
- Trading every Hanging Man. The pattern works best at major resistance levels, after extended trends, or with corroborating evidence. Skip the marginal setups.
Real Crypto Examples (Where Hanging Man Has Worked)
Crypto markets generate Hanging Man patterns regularly because high volatility produces frequent long-wick candles. Some recent examples that played out cleanly:
- BTC at the November 2021 cycle top. A clear Hanging Man on the daily chart at the all-time high, followed by a bearish engulfing two days later, marked the top of the 2021 bull cycle. Traders who shorted on confirmation captured the start of the 2022 bear market.
- ETH at the March 2024 local top near $4,000. A 4-hour Hanging Man at resistance, confirmed by a sharp red candle, preceded a 30% pullback over the next 6 weeks.
- SOL during the January 2024 high. Daily Hanging Man at $125 followed by aggressive bearish continuation provided a clean short setup with 1:3 risk-reward.
Failed Hanging Man examples are equally common in low-conviction setups - mid-trend, no resistance, no volume - which is exactly why the validation checklist matters.
Hanging Man in an Altrady Workflow
Altrady gives you the tools to scan for, validate, and execute Hanging Man trades across multiple exchanges from one terminal.
- Multi-exchange charts with full candlestick rendering across BTC, ETH, SOL, and major altcoins on Binance, Coinbase, Kraken, and others. Spot Hanging Man patterns simultaneously across timeframes.
- Quick Scanner filters across hundreds of pairs to surface assets currently printing Hanging Man-shaped candles at the top of recent uptrends. Cuts manual chart-flipping to seconds.
- Smart Trading order types let you bracket each short entry with a stop above the Hanging Man's high and a target at prior support, all in a single ticket.
- Alert system on key resistance levels so you know when price approaches a zone where Hanging Man patterns are most likely to fire.
- Paper trading environment for testing the pattern across historical and live data before risking capital.
Start with a free trial, run Hanging Man scans on BTC and ETH for a quarter, and let the pattern recognition do the work.
Conclusion
The Hanging Man is one of the cleanest single-candle bearish reversal signals in technical analysis. The shape is unambiguous, the context (top of uptrend) is intuitive, and the trading rules - wait for confirmation, stop above the high, target prior support - are mechanical enough to follow without emotion.
The pattern works best when paired with corroborating signals: bearish divergence, resistance rejection, volume spike, multi-candle confirmation. Trading it in isolation, without context, produces a coin-flip win rate. Layering it into a broader technical framework turns it into one of the highest-edge setups available on any chart.
Frequently Asked Questions
What is the Hanging Man candlestick pattern?
The Hanging Man is a single-candle bearish reversal pattern with a small real body, a long lower shadow at least 2x the body size, and little or no upper shadow. It appears at the top of an uptrend and signals that selling pressure has entered the market for the first time in recent price action.
What is the difference between a Hanging Man and a Hammer?
The shape is identical - same small body, same long lower shadow, same minimal upper wick. The difference is context: a Hammer appears at the bottom of a downtrend (bullish reversal signal), and a Hanging Man appears at the top of an uptrend (bearish reversal signal). Always identify the trend first.
Does the Hanging Man have to be a red candle?
No. Both red (bearish) and green (bullish) Hanging Man candles are valid. A red Hanging Man shows slightly more bearish conviction, but the shape and context (uptrend) are what define the signal. The color is secondary.
How reliable is the Hanging Man pattern?
On its own, the Hanging Man has roughly a 50-60% success rate. Combined with confirmation (bearish next candle, volume spike, RSI divergence, or resistance level), success rate improves to 65-75%. Always wait for confirmation before entering and demand 1:2 minimum risk-reward.
Where do I place the stop loss for a Hanging Man trade?
Place the stop just above the high of the Hanging Man candle, plus a buffer of 5-10% of the average daily range. If price breaks above the Hanging Man's high, the bearish thesis is invalidated and the trade is over.
Can the Hanging Man pattern be used in crypto trading?
Yes. Crypto markets produce Hanging Man patterns frequently due to high volatility. The pattern works on any timeframe (4-hour, daily, weekly) and any major crypto pair. Validate context (clear prior uptrend) and confirmation (bearish next candle) the same way you would in equities or forex.
What confirmation do I need to trade a Hanging Man?
The next candle should close below the Hanging Man's body (some traders require a close below the Hanging Man's low for higher conviction). Pair this with at least one corroborating signal - bearish RSI divergence, resistance rejection, volume spike, or bearish engulfing on the confirmation candle.
Spotting Hanging Man patterns across dozens of crypto pairs by hand is a full-time job. Altrady gives you multi-exchange scanning, alerting, and execution tools that surface these patterns automatically. Sign up for a free trial and run the workflow on a real exchange feed without risking capital.