
The Head and Shoulders pattern is the most-cited reversal signal in technical analysis for one reason: when it forms cleanly, it produces some of the highest-probability short setups available on any chart. Crypto traders see it print at every major top, from Bitcoin's 2017 peak to Ethereum's 2021 highs. The pattern works because it visualizes a real shift in market structure - buyers exhausting, sellers gaining ground - in a way that is easy to identify, validate, and trade. This guide covers exactly how.
What Is the Head and Shoulders Pattern?
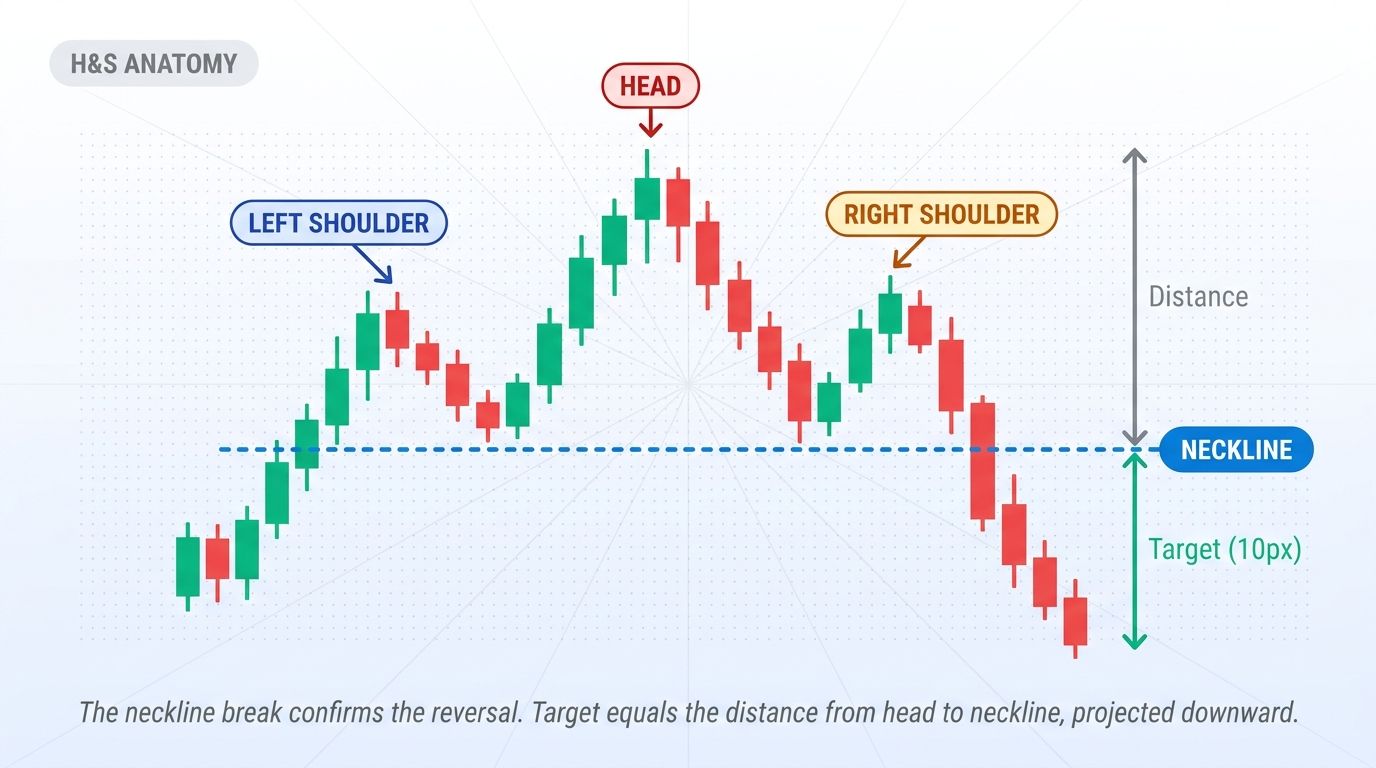
The Head and Shoulders is a bearish reversal chart pattern that appears at the top of an uptrend. It signals that buying pressure is fading and that a sustained downtrend is likely. The pattern gets its name from its visual shape: three consecutive peaks where the middle peak (the "head") is the highest, flanked by two lower peaks (the "shoulders") that are roughly equal in height.
The pattern is widely considered one of the most reliable reversal signals because it reflects a real change in market structure. Each peak represents a buying attempt; each subsequent failure to make a new high signals weakening demand. By the time the right shoulder forms, sellers have outnumbered buyers at the previous peak, and the breakdown through the neckline confirms the new downtrend has begun.
Anatomy of the Head and Shoulders Pattern
A valid Head and Shoulders has five distinct components:
- Prior uptrend: the pattern only matters at the top of a sustained uptrend. Without prior bullish context, three peaks are just noise.
- Left shoulder: the first peak. Price rallies to a new high, then pulls back to a swing low.
- Head: the second peak, which makes a higher high than the left shoulder. Price then pulls back to roughly the same swing low as before.
- Right shoulder: the third peak, which fails to exceed the head's high. This failure is the first concrete evidence buyers are losing control.
- Neckline: a trendline connecting the two swing lows between the shoulders. The neckline can be horizontal or slightly sloped. A close below the neckline confirms the pattern.
Once price breaks below the neckline with conviction (volume spike helps), the pattern is confirmed and the bearish thesis is in play. The measured-move target is the vertical distance from the head's peak down to the neckline, projected downward from the breakout point. This target gives a defined exit goal for the trade.
Standard vs Inverse Head and Shoulders
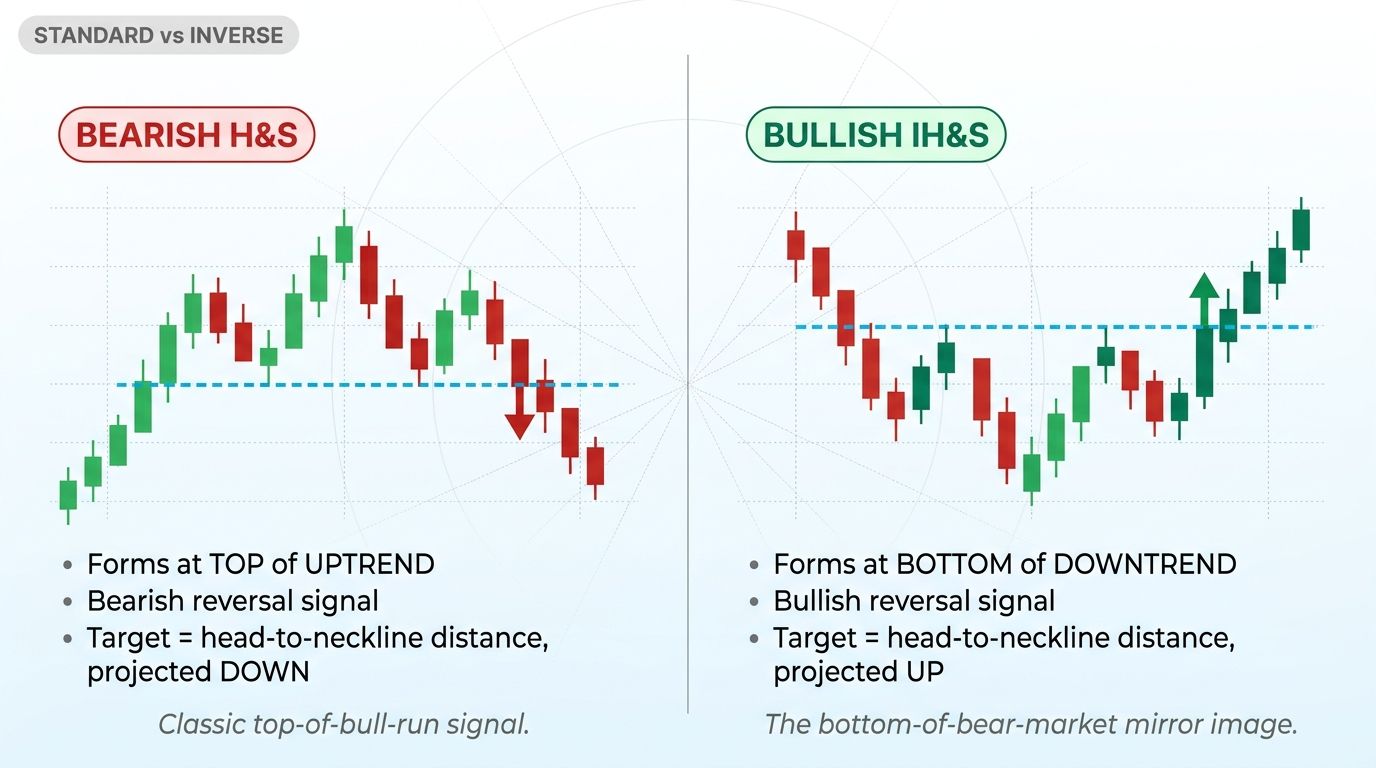
The Inverse Head and Shoulders (also called "head and shoulders bottom") is the bullish mirror image. It forms at the bottom of a downtrend and signals a likely upward reversal. The structure flips:
- Standard H&S: three peaks at the top of an uptrend. Middle peak is highest. Bearish reversal signal. Neckline break = short entry.
- Inverse H&S: three troughs at the bottom of a downtrend. Middle trough is the lowest. Bullish reversal signal. Neckline break = long entry.
The trading logic is identical, just inverted. Crypto traders see the inverse pattern frequently at major cycle bottoms - the 2018 BTC low, the 2022 BTC low, and major altcoin bottoms in 2023 all printed clean inverse Head and Shoulders patterns on weekly charts.
How to Identify a Valid Head and Shoulders
Run any potential pattern through this validation check before treating it as tradable:
- Clear prior uptrend? At least 4-6 weeks of higher highs and higher lows on your timeframe. No uptrend, no head and shoulders - just three random peaks.
- Head clearly higher than both shoulders? If the right shoulder matches or exceeds the head, you have a different pattern (double top, triple top, or continuation).
- Shoulders roughly symmetrical? The two shoulders should be similar in height and time-distance from the head. Wildly asymmetric patterns are less reliable.
- Neckline definable? You should be able to draw a clean line through the two valleys. If the troughs are at very different prices, the neckline is ambiguous.
- Volume profile correct? Volume should be highest on the head's rally, lower on the right shoulder's rally, and spike on the neckline break. Declining volume on each successive peak is a tell that buying interest is fading.
If all five check, the pattern is valid. If 4 of 5 check, the pattern is still tradable with reduced size. Below 4 of 5, skip - false H&S patterns are common in volatile markets and produce expensive losses.
How to Trade the Head and Shoulders Pattern
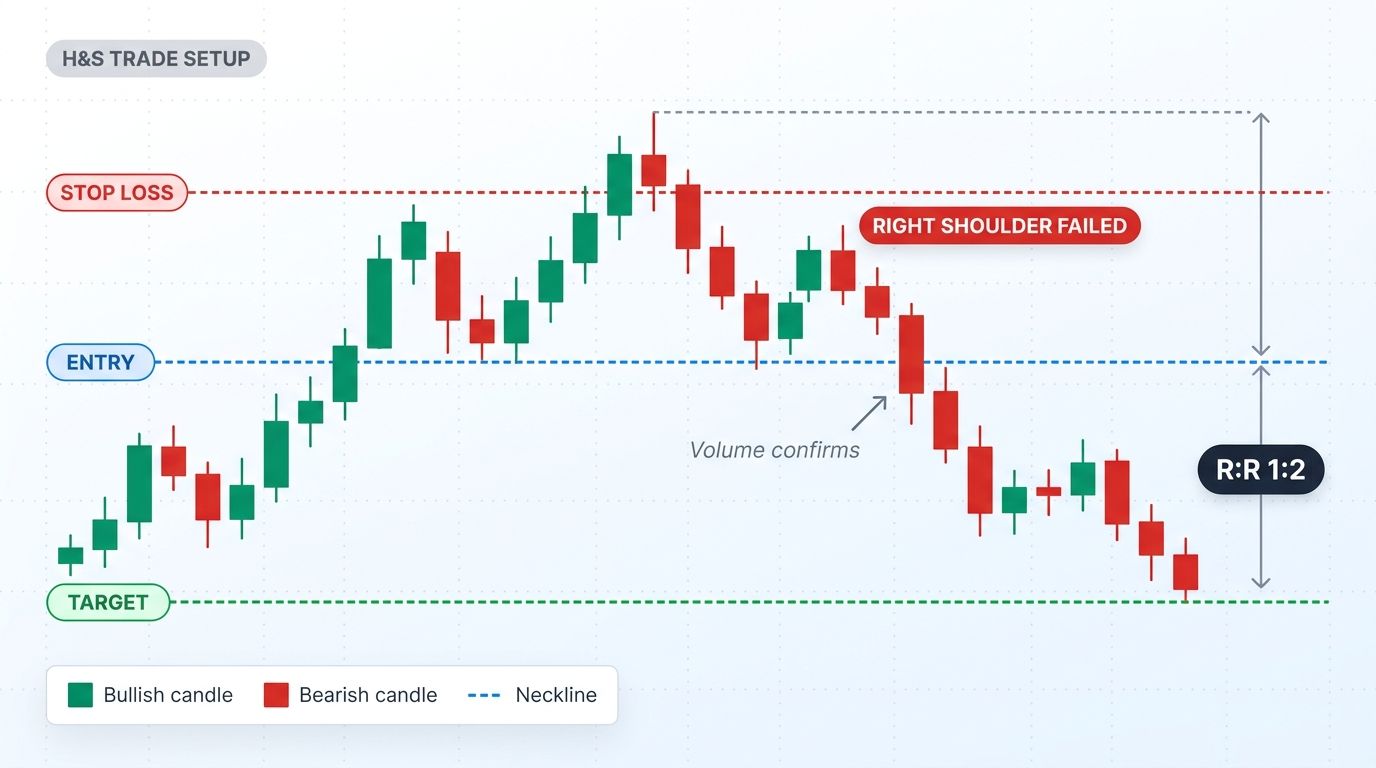
The pattern itself is the signal. Trading it requires waiting for confirmation and using mechanical entry, stop, and target rules.
Entry rules
- Wait for a candle to close below the neckline. Intraday wicks that pierce but close back above don't count.
- Enter short on the open of the candle following the breakdown close.
- Some traders use a 1-2% confirmation buffer below the neckline to filter false breaks. Tradeoff: better filtering vs late entry.
Stop loss
- Place stop above the right shoulder's high, plus a small buffer (5-10% of average daily range).
- Aggressive traders use the neckline as the stop level - tighter stop but more whipsaws on retests.
- If price recovers above the right shoulder, the bearish thesis is invalidated.
Target
- Measure the vertical distance from the head's peak to the neckline.
- Project that distance downward from the neckline-break point. That projection is the measured-move target.
- Demand minimum 1:2 risk-reward. If target gives less than 1:2, skip the trade.
Pro traders often scale out: take half off at a 1:1 R:R level, move stop to break-even, and let the remaining half run to the measured-move target.
Volume Confirmation: The Filter That Separates Real from Fake
Volume is the single most important confirmation factor for Head and Shoulders trades. The pattern is much more reliable when volume profile follows this sequence:
- Volume highest on left shoulder rally. Initial buying enthusiasm.
- Volume slightly lower on head rally. Buying interest is fading even though price makes a new high.
- Volume noticeably lower on right shoulder rally. Buyers are tired. The new high cannot be reached.
- Volume spike on the neckline breakdown. Sellers commit aggressively. This is the confirmation.
Without that volume sequence, the pattern is suspect. A right shoulder with higher volume than the head, for example, suggests buyers are still committed and the breakdown may fail. Crypto markets often have manipulated volume on smaller alts, so always check volume on a major exchange (BTC/USDT on Binance, ETH/USDT on Coinbase) where flow is genuine.
Common Mistakes Trading Head and Shoulders
The pattern is widely known, which is why most failures come from breaking the rules:
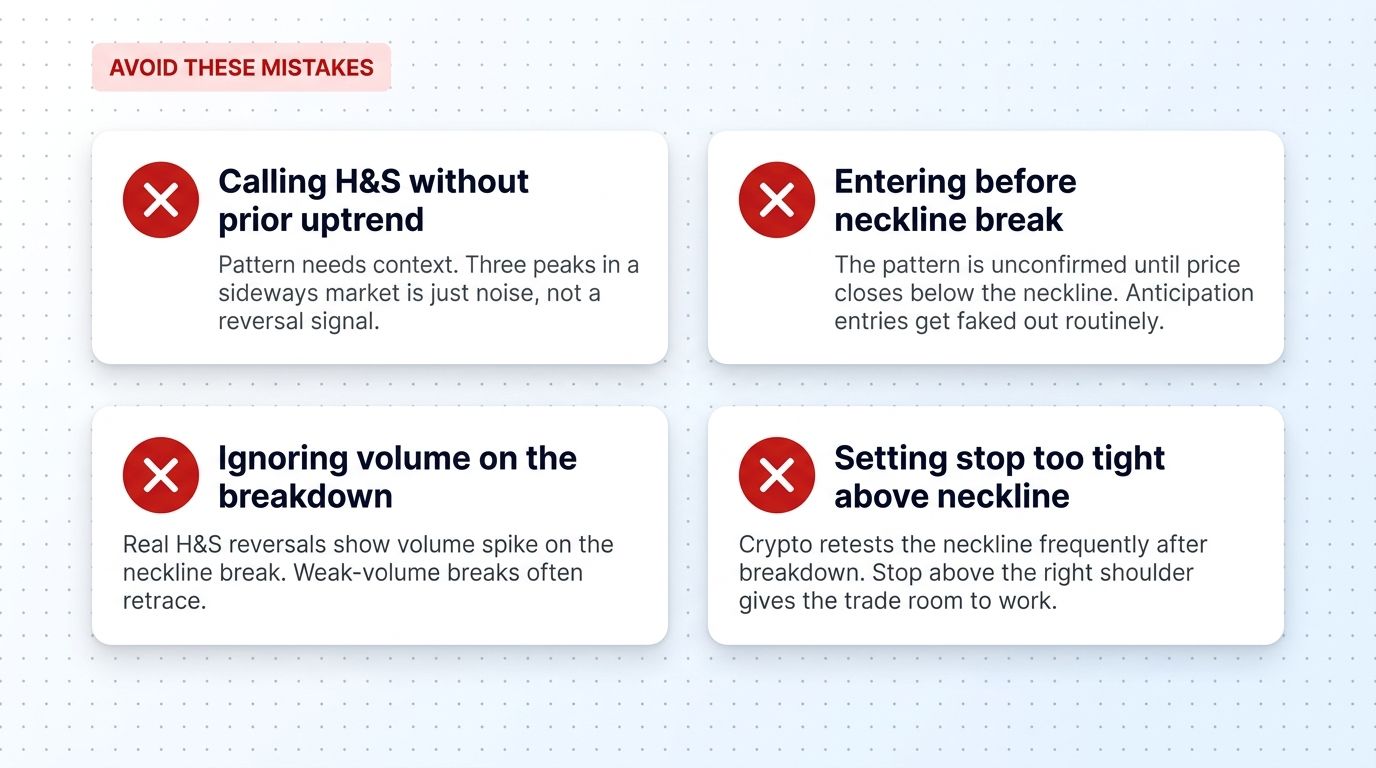
- Calling H&S without a prior uptrend. Three peaks in a sideways or choppy market is just noise. Pattern only works at the top of an established uptrend.
- Entering before the neckline break. Anticipation entries (shorting at the right shoulder peak) get faked out routinely. Wait for the close below the neckline.
- Ignoring volume on the breakdown. Real H&S reversals show volume spike on the neckline break. Weak-volume breaks often retrace and fail.
- Setting the stop too tight above the neckline. Crypto retests the neckline frequently after breakdown. Stops at the neckline get hit before the trade has a chance to work. Place stops above the right shoulder.
- Skipping the measured-move target and taking profits early. The pattern's edge comes from the full target. Traders who close at +5% miss the +15% the math says is achievable.
Real Crypto Examples
Crypto markets produce Head and Shoulders patterns regularly. Some textbook examples:
- Bitcoin, December 2017: a clean H&S formed on the daily chart at the all-time high near $19,800. Neckline break around $13,500 confirmed the bear market that ran for the next 12 months.
- Ethereum, May 2021: a daily H&S near $4,200 with right shoulder around $3,950. Neckline break at ~$3,400 led to a six-week pullback to $1,700.
- Solana, November 2021: classic H&S on the daily chart at the cycle top near $260. Measured-move target near $40 - eventually hit through the 2022 bear market.
Failed H&S patterns are equally common in low-conviction setups - mid-trend, no clear neckline, weak volume - which is exactly why the validation checklist matters.
Using Head and Shoulders in an Altrady Workflow
Altrady gives you the tools to scan for, validate, and execute Head and Shoulders trades across multiple exchanges from one terminal.
- Multi-exchange charting with built-in drawing tools. Plot necklines and shoulders on BTC, ETH, SOL, and major altcoins simultaneously across Binance, Coinbase, Kraken, and others.
- Quick Scanner filters across hundreds of pairs to surface assets currently printing peaks at resistance levels - the early-warning signal that an H&S might be forming.
- Smart Trading order types let you bracket each short entry with a stop above the right shoulder and a measured-move target, all in a single ticket.
- Alert system on neckline levels so you know the moment price breaks below the trigger zone.
- Paper trading environment to test the pattern across historical and live data before risking capital.
Start with a free trial, run H&S scans on BTC and ETH for a quarter, and let the pattern recognition do the work.
Conclusion
The Head and Shoulders is the most-respected reversal pattern in technical analysis for good reason: it visualizes a real shift in market structure, has clear validation rules, and produces a defined target through measured-move geometry. Crypto markets, with their persistent trends and volatile reversals, are an ideal environment for the pattern.
The hard part is not identifying the pattern. It is following the rules - waiting for the neckline close, demanding volume confirmation, sitting through neckline retests, and holding to the measured-move target. Traders who build the discipline to follow each step capture the high-probability moves; traders who eyeball entries and exits fight the pattern's edge.
Frequently Asked Questions
What is the Head and Shoulders pattern in trading?
The Head and Shoulders is a bearish reversal chart pattern that forms at the top of an uptrend. It consists of three consecutive peaks where the middle peak (head) is the highest, flanked by two lower peaks (shoulders) of similar height. A breakdown through the neckline (the trendline connecting the two valleys between peaks) confirms the bearish reversal.
How reliable is the Head and Shoulders pattern in crypto?
When validated correctly (prior uptrend, symmetric shoulders, clean neckline, volume confirmation on breakdown), the pattern has a historical success rate of 65-80% in equities and a similar range in crypto. Without validation, success drops to 40-50%. The pattern is one of the most reliable in technical analysis when filtered properly.
What is the difference between standard and inverse Head and Shoulders?
Standard Head and Shoulders forms at the top of an uptrend with three peaks (head higher than shoulders) and is a bearish reversal signal. Inverse Head and Shoulders forms at the bottom of a downtrend with three troughs (head deeper than shoulders) and is a bullish reversal signal. The geometry and trading logic are mirrored.
How do I calculate the target for a Head and Shoulders trade?
Measure the vertical distance from the head's peak down to the neckline. Then project that same distance downward from the breakout point on the neckline. The result is the measured-move target. For example, if the head is $50,000 and the neckline is at $40,000, the distance is $10,000, and the target is $30,000 (neckline minus distance).
Where should I place the stop loss for a Head and Shoulders trade?
Place the stop above the high of the right shoulder, plus a small buffer (5-10% of the average daily range). This level is the natural invalidation point - if price recovers above the right shoulder, the bearish thesis is broken and the trade should be closed.
Does volume matter for the Head and Shoulders pattern?
Yes, volume is the most important confirmation factor. The ideal volume profile shows highest volume on the left-shoulder rally, slightly lower on the head, noticeably lower on the right shoulder, and a spike on the neckline breakdown. A breakdown without a volume spike is suspect and often retraces.
Can the Head and Shoulders pattern fail?
Yes. The most common failure mode is a right shoulder that exceeds the head, which negates the pattern entirely. Other failures include neckline breaks on weak volume that quickly retrace, and patterns formed in sideways markets without a prior uptrend. Always validate with the 5-point checklist before trading.
Spotting clean Head and Shoulders patterns across dozens of crypto pairs by hand is exhausting. Altrady gives you multi-exchange scanning, drawing tools, alerts, and paper trading to surface and execute these setups efficiently. Sign up for a free trial and run the workflow on a real exchange feed without risking capital.