Modern crypto traders pull up candlestick charts so reflexively they forget the bars in front of them are 250 years old. The visualization, the patterns, and the psychology behind both came from rice-trading floors in 18th-century Osaka. Understanding why those candles work the way they do, not just memorizing what each shape looks like, is the difference between a trader who calls reversals once in a while and one who reads the screen like a story.
Where Japanese Candlestick Charting Techniques Came From
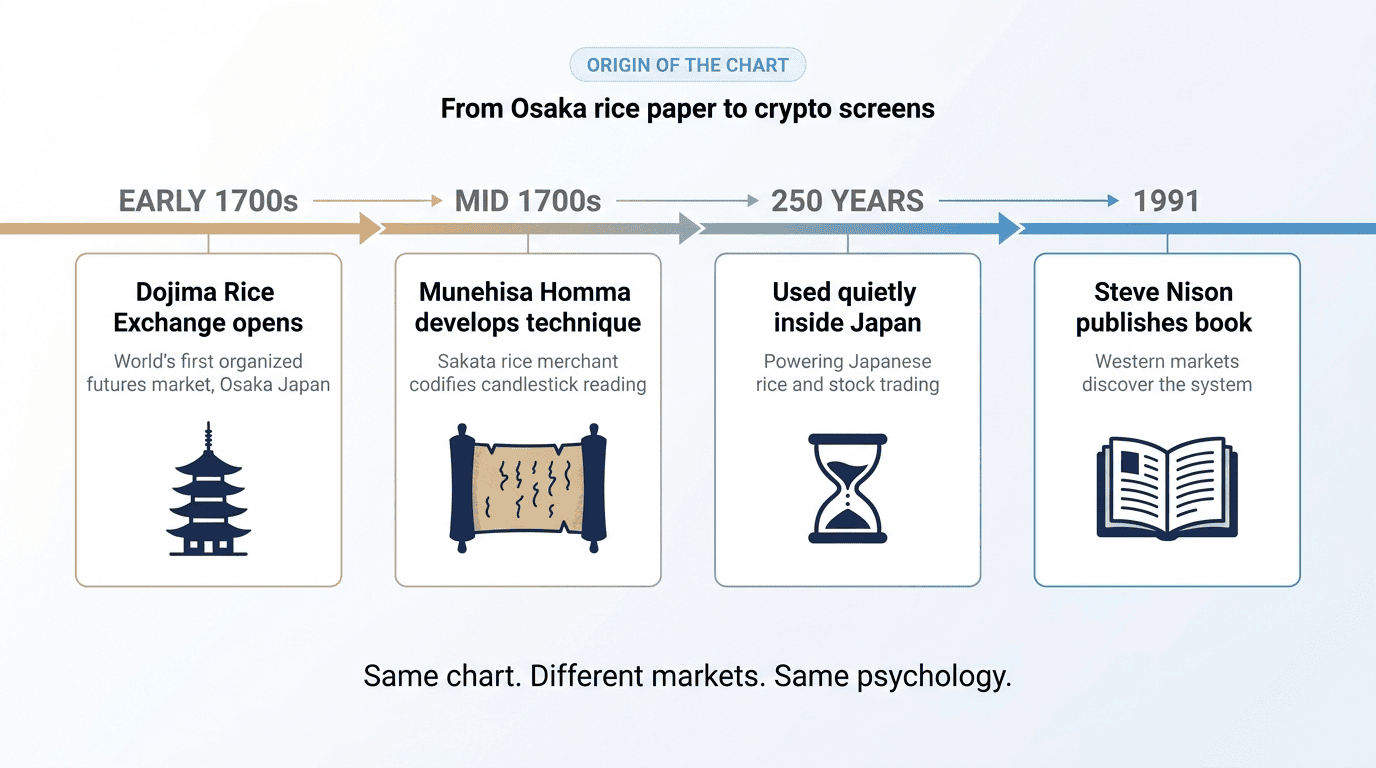
The candlestick chart was developed in Japan during the Tokugawa shogunate (early 1700s). Munehisa Homma, a rice merchant from Sakata, is credited with formalizing the technique to track price action on the Dojima Rice Exchange in Osaka, the world's first organized futures market.
Homma's insight was simple but ahead of its time: market price is not a function of supply and demand alone. It is a function of trader psychology, specifically the emotions of the crowd participating in that supply and demand. By drawing each session's open, high, low, and close as a candle-shaped bar, Homma could read at a glance who was winning the day's psychological battle and how decisively.
His writings, particularly The Fountain of Gold and Sakata Senho (the Sakata Method), formed the foundation of what Western traders now call Japanese candlestick charting. The technique stayed contained inside Japan for centuries until Steve Nison published Japanese Candlestick Charting Techniques in 1991, which exposed Western markets to the system that had been quietly running Japanese rice and stock trading for 250 years.
Today the same charts you see in Altrady, TradingView, Binance, and every serious crypto exchange are direct descendants of Homma's bars on rice paper.
What Made Candlesticks Different from Western Charts
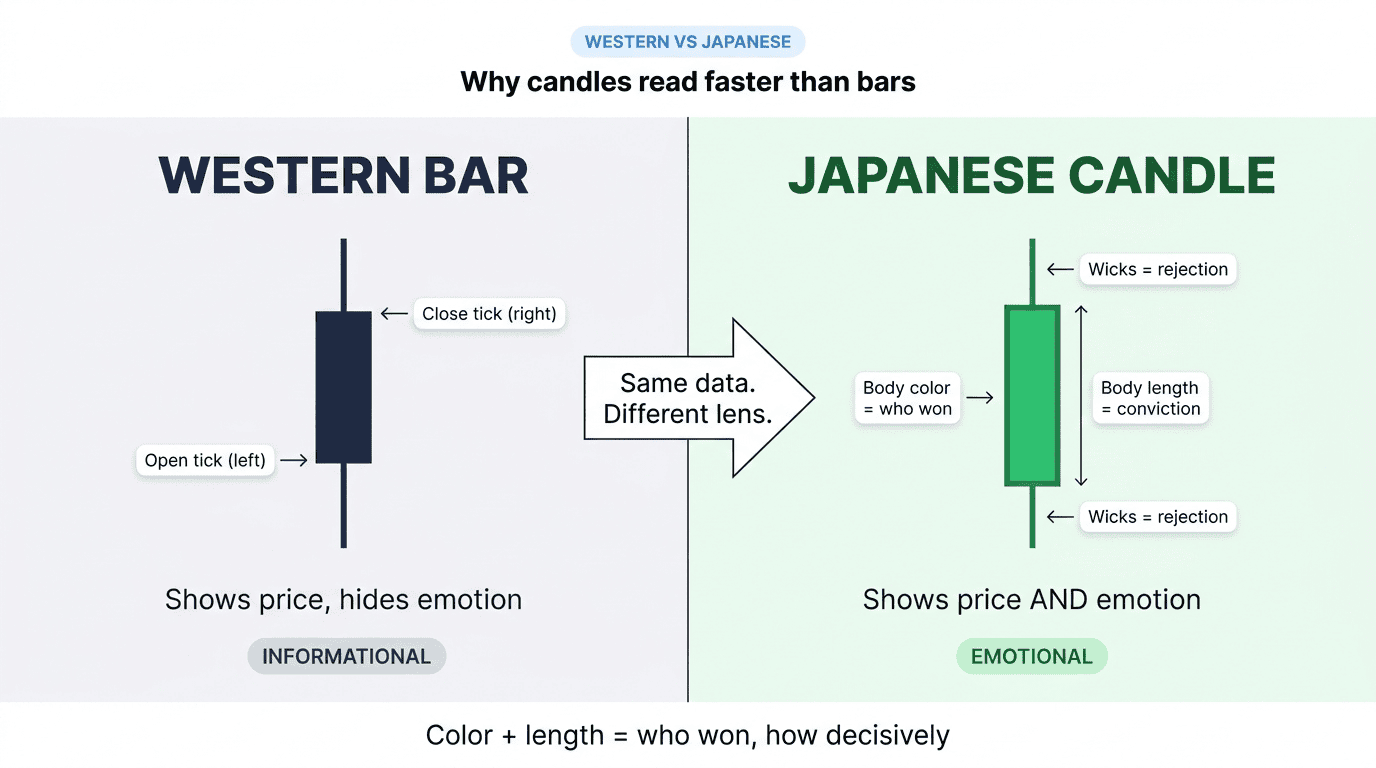
Western technical analysis at the time used bar charts (a vertical line with two ticks for open and close) or line charts (closes only). Both showed price but hid the emotion. A bar chart told you the high and low; it did not tell you whether buyers or sellers held control across the period.
The Japanese candle solved that with two design choices:
1. The body color shows who won the period. A green body means close above open: buyers won. Red body means close below open: sellers won. You see the outcome before you read the numbers.
2. The body length shows how decisively they won. A long body says one side dominated start to finish. A short body says the period was a coin flip. The eye absorbs this at a glance.
These two changes turned chart reading from arithmetic ("close was higher than open by $42") into pattern recognition ("buyers ran the period with conviction"). That is why candlesticks read faster than bars, even before you start spotting reversal patterns.
The Psychology Encoded in Every Candle
Homma's deeper insight was that price action is just the physical signature of crowd psychology. Every candle is a snapshot of how thousands of traders felt about an asset during that period.
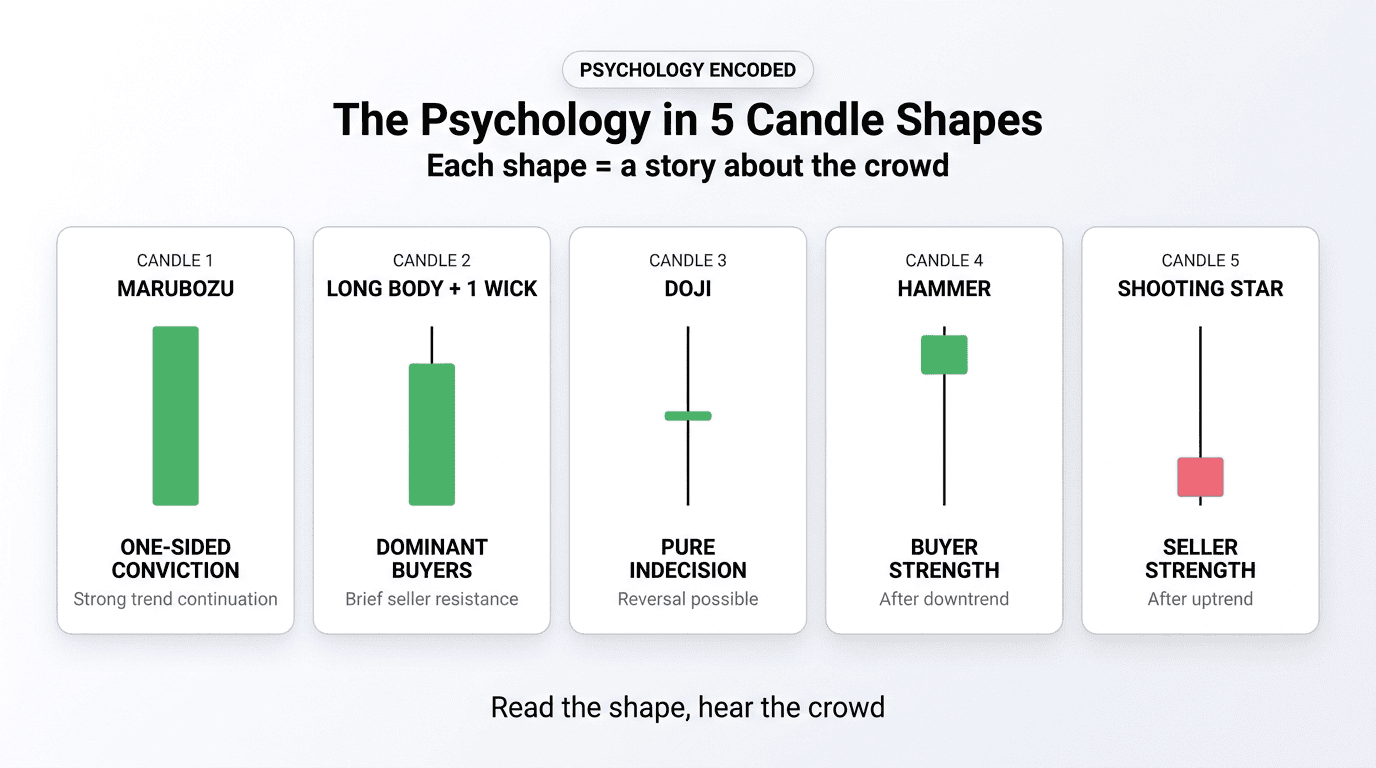
Long body, no wicks (marubozu). One side controlled start to finish without giving an inch. Strong conviction, often the start of a trend or the continuation of momentum.
Long body with one wick. Most of the period went to one side, but the other side made a brief stand and got rejected. Tells you which side has actual ammunition versus which side is making token resistance.
Small body in the middle of long wicks (doji). Buyers and sellers both reached extremes, both got rejected, and the period closed near where it opened. Pure indecision. After a strong trend, this is often the first signal of exhaustion.
Long lower wick, small body at top (hammer). Sellers tried to push price down, buyers absorbed and reclaimed the loss before close. A statement of buyer strength, especially after a downtrend.
Long upper wick, small body at bottom (shooting star). Buyers tried to push price up, sellers absorbed and dragged it back down. Statement of seller strength, especially after an uptrend.
The pattern names matter less than what each shape tells you about the moment-to-moment psychology of the participants.
The Sakata Five (The Original Patterns)
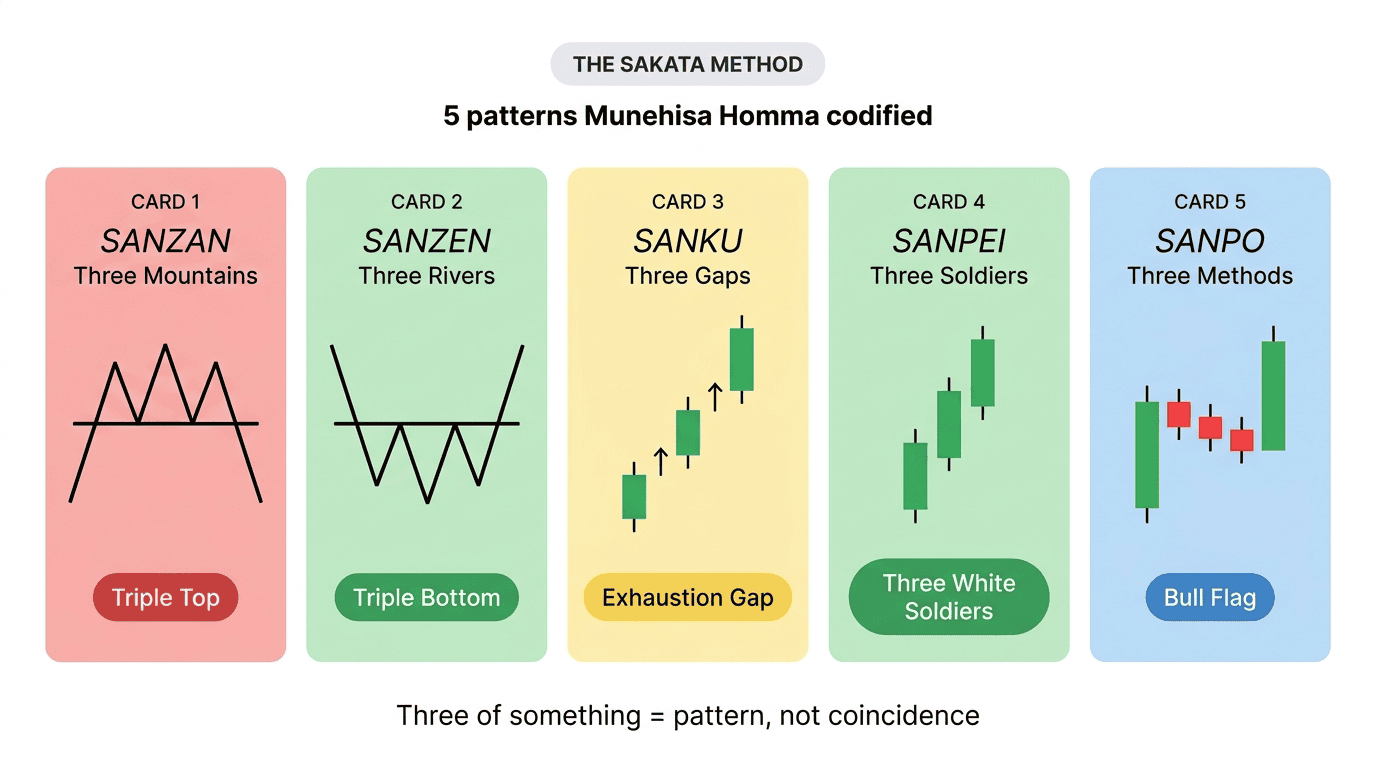
Homma codified five core patterns in the Sakata Method, all built around the idea that the market moves in repeating psychological cycles. These five patterns are still the backbone of most candlestick analysis today, even when traders use different names for them.
1. Sanzan (Three Mountains). Three failed attempts to break a high. In modern terms this is a triple top, often appearing at major reversals.
2. Sanzen (Three Rivers). Three failed attempts to break a low. The mirror image of Sanzan, equivalent to a triple bottom.
3. Sanku (Three Gaps). Three consecutive gaps in the direction of the trend. Homma's read: the market has overextended and is exhausted. Reverse.
4. Sanpei (Three Soldiers). Three consecutive long bullish candles closing near their highs. Strong continuation pattern. The Western "three white soldiers" comes directly from this.
5. Sanpo (Three Methods). A continuation pattern where a strong trend pauses for three or four small counter-trend candles, then resumes. Equivalent to bullish or bearish flags in modern technical analysis.
Notice the recurring structure: three of something. Homma believed three was the threshold where coincidence became pattern. Two failed attempts could be noise. Three established the trend or the reversal.
Why the Patterns Still Work in Crypto
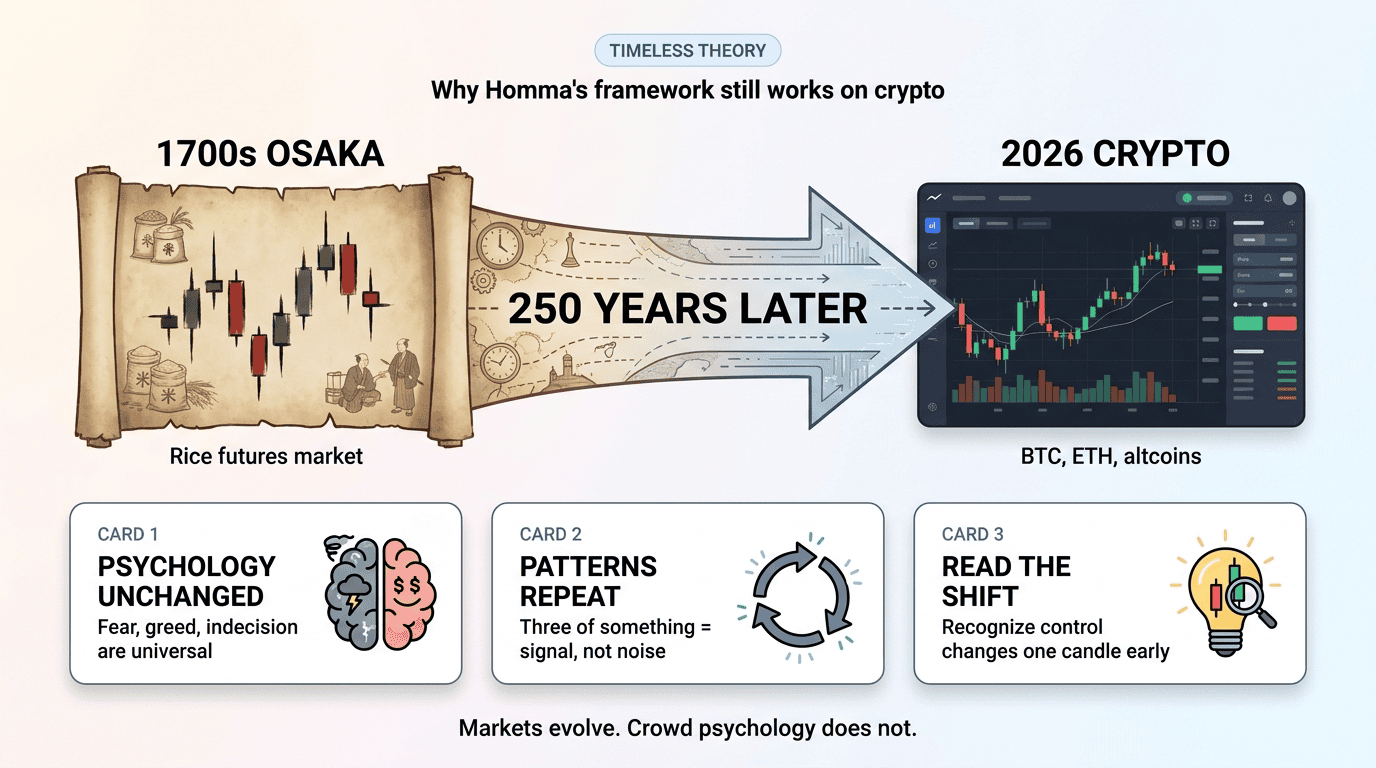
Modern crypto trading runs on algorithms, leverage, and 24/7 markets. Yet candlestick patterns originally designed to read 18th-century rice traders work just as well on Bitcoin, Ethereum, and Solana charts. Why?
Because the patterns were never about rice. They were about humans under risk. The market participants change (rice merchants then, leveraged whales and retail today), but the psychological responses to fear, greed, and indecision are universal. When BTC stages a hammer reversal at $40,000 support, it is the same crowd dynamic that played out at the Dojima Rice Exchange in 1750: sellers pushed too hard, buyers absorbed, and the rejection signaled that the next move was up.
Crypto markets actually amplify candlestick signals in two ways. First, they run continuously, so the daily candle captures a full 24-hour psychological cycle without session breaks. Second, retail participation is unusually high compared to traditional markets, which means crowd psychology drives a larger share of price action. Both factors make the patterns more reliable, not less.
The Three Truths Homma Wanted Traders to Internalize
Reading the original Japanese sources (translated), three principles keep showing up. They are worth memorizing.
1. The market reflects crowd psychology, not fundamentals. Fundamental value matters in the long run, but in the short run, price is determined by what the crowd believes about value. Candles read crowd belief.
2. Patterns repeat because human nature does not change. Fear after a sharp drop, greed after a sharp rise, indecision at extremes. These reactions are wired into the human brain and have not evolved out in 250 years. The crypto crowd today reacts the same way.
3. The trader's job is to read the shift, not predict the future. Candlestick patterns do not tell you what will happen next. They tell you what is happening right now in the minds of the participants. Reversals begin when that psychology shifts. Your edge is recognizing the shift one candle earlier than the crowd.
Applying Japanese Candlestick Theory to Crypto Trading Today
Here is what changes when you internalize the theory rather than just memorizing the shapes.
You stop hunting for a single magic pattern. No pattern guarantees a winning trade. Each pattern is a probabilistic signal about a psychological state. You stack candles, context, volume, and key levels to build conviction.
You weight context heavily. A hammer at random support means little. A hammer at a major weekly support after a strong downtrend, on a volume spike, after a long-tailed doji the prior session, means a lot. The pattern is the trigger, but the context is the engine.
You read the sequence, not the snapshot. Single candles tell snapshots. Sequences tell stories. The hanging man followed by a bearish engulfing followed by a long red body is a complete reversal narrative, not three separate signals.
You let the market disprove you. Homma's Sakata Method explicitly required confirmation candles after a pattern. A hammer alone is a setup; the next candle's close above the hammer's high is the confirmation. Modern traders skip confirmation and pay for it.
Inside Altrady, this theory translates into a workflow: pull up multiple timeframes for any pair, watch for pattern formations at meaningful levels, wait for the confirmation candle, then size position based on R-multiple risk. The platform handles execution; the candles handle psychology.
Frequently Asked Questions
Who invented Japanese candlestick charts?
Munehisa Homma, an 18th-century Japanese rice merchant from Sakata, is credited with developing candlestick charting to track price action on the Dojima Rice Exchange in Osaka. Steve Nison brought the technique to Western markets in his 1991 book Japanese Candlestick Charting Techniques.
Are candlesticks still relevant in modern crypto trading?
Yes. Candlestick patterns reflect crowd psychology, which is universal and time-invariant. The patterns work on Bitcoin, Ethereum, and altcoins for the same reason they worked on 18th-century rice: they capture how participants react to fear, greed, and indecision under risk.
What is the Sakata Method?
The Sakata Method is the codification of five core candlestick patterns by Munehisa Homma: Sanzan (three mountains, triple top), Sanzen (three rivers, triple bottom), Sanku (three gaps), Sanpei (three soldiers), and Sanpo (three methods, flags). These five patterns remain the foundation of modern candlestick analysis.
How is candlestick analysis different from Western technical analysis?
Candlestick analysis emphasizes psychological reading of crowd behavior over mathematical signals. Western charting prioritizes indicators and oscillators derived from price. Most modern traders combine both: candles for entry timing and crowd reading, indicators for trend confirmation and overbought/oversold context.
Should I read Steve Nison's book?
Japanese Candlestick Charting Techniques is the standard reference for Western traders learning the system. It is dense but practical. For crypto traders, supplement it with a focus on volatility-adjusted patterns since crypto's higher volatility produces more frequent and more pronounced wicks than equities.
Final Thoughts
Japanese candlestick charting techniques are not a set of rules to memorize. They are a framework for reading the psychological state of the market in real time. Once you internalize that the body shows who won, the wicks show who got rejected, and the sequences show how control passes between buyers and sellers, every pattern stops being a flashcard and starts being a sentence.
The traders who consistently profit from crypto markets are not the ones who recognize the most patterns. They are the ones who read the candles like Homma did: as the visible signature of an invisible crowd, telling them where psychology is shifting before price proves it.
Ready to apply 250 years of pattern theory to live crypto markets? Start your Altrady free trial and use multi-exchange charts, smart watchlists, and paper trading to practice reading candlesticks the way Homma taught.