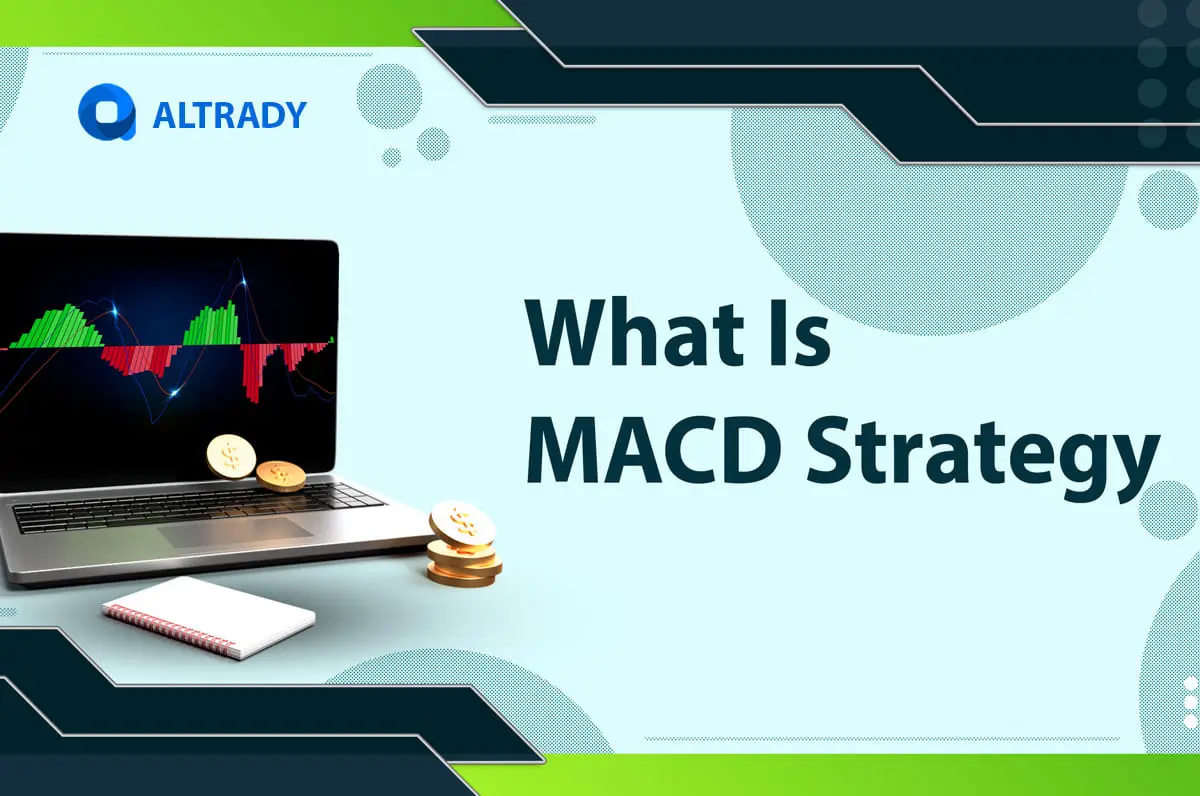
The Moving Average Convergence Divergence indicator tool has settled its place in the ever-evolving space of crypto trading as a primary option guiding the decisions of advanced and beginner traders.
This indicator tool stands out for its potential to identify trends, reversal momentums, and market conditions shifts. MACD shows an intuitive interface of analysis charged by a histogram, allowing the study of complex conditions from an understandable starting point.
In this guide, we will explore the core aspects of MACD and how to craft a trading strategy that helps to identify trends and market momentum.

What is the MACD Indicator
The MACD is a momentum oscillator that analyzes in-depth correlations between price movement and its moving average, featuring the composition of three inside indicators assessing various market conditions.
These inside indicators respond to the name of the MACD Line, Signal Line, working on top of a histogram. Let's explore those terms.
MACD Line
Subtracting the 12-period from the 26-period Exponential Moving Average (EMA), this line follows the short-term direction of a trending market relative to the long-term trend.
Signal Line
Composed by the 9-period EMA, this line acts as a confirmation signal for entry and exit points during trend changes.
Histogram
Visually represents the difference between the MACD Line and the Signal Line through a bar chart emphasizing the divergence between the two lines.

How Does the MACD Signal Work?
Traders use the MACD to spot crossovers and divergences, employing histogram analysis to confirm the signals and set up trade entries. The indicator ranges from top to bottom, classifying the MACD into positive or negative values.
Positive MACD
The positive value means that the EMA 12-period is above the 26-period, suggesting the market is in an uptrend.
Negative MACD
The negative value means that the EMA 12-period is below the 26-period, suggesting the market is in a downtrend.
Interpretations of MACD for crypto trading
The MACD values allow for multiple interpretations and applications while trading crypto assets. Let's overview the most common.
- Crossovers: Similar to traditional SMA and EMA, in the MACD, line crossovers suggest bullish or bearish price movements. In this case, when the MACD Line crosses above the signal line, a bullish signal is detected; when the MACD Line crosses below the signal line, a bearish signal appears. In both scenarios, traders expect potential trends in the direction of those signals.
- Divergences: These discrepancies detect trend weaknesses. When the price reaches a new high while the MACD is not following the movement, a bullish divergence appears, suggesting a reversal. Similarly, the bearish divergence comes when the MACD plunges lower than the price, with a possible upside reversal about to happen.
Advanced MACD Techniques
The MACD offers even deeper insights for seasoned traders who can be exposed to complex scenarios. Let's see some.
- Zero Line Crossovers: The zero value is the line that splits the histogram between positive and negative values. When the MACD line crosses above zero, it indicates strengthened bullish momentum; otherwise, crossing below indicates bearish momentum.
- Double Crossovers and Divergence: In some scenarios, the MACD and signal lines can cross up to two times or even show double divergences. Imagine a market where the MACD line crosses above zero to a positive value and the price corrects a little, the indicator remains positive with the MACD line crossing above the signal line, suggesting the continuation of the trend. Similarly, double divergences strengthen the signals for a trend reversal.
The Double-Cross Strategy
The MACD combined with other indicators increases its trustworthiness. One well-known way is combining MACD with The Stochastic Oscillator under the Double-Cross Strategy.
So, how does the MADC work with the Stochastic? Since both tools are momentum oscillators, traders will find conditions of potential convergence that confirm strong price movements.
Even though the MACD could be a more reliable option as a sole tool for trends, Stochastic better identifies overbought and oversold zones. These two characteristics give this strategy a unique power, especially for crypto traders who can't ignore volatility and market jolts.
The key to spotting double-cross signals is to look for:
- The lines crossing in each of the two indicators for price reversals.
- Strong confirmation signals as results of spotted divergences and convergences.
- Signals of oversold or overbought indicating weaknesses in the current trend.
Creating a MACD Trading Strategy
The best approach for creating a MACD strategy is to focus on the following:
- 1. Identifying the Trend: As we mentioned previously, positive and negative values suggest the direction of a trend.
- 2. Entry and Exit Points: Analyze line crossovers and divergences for potential trade points.
- 3. Confirmation: Use price action, chart patterns, and candlestick patterns to empower the strategy in continuation or reversal conditions.
- 4. Risk Management: Implement concepts of smart trading using stop-loss and take profit orders to protect positions. Consider calculating the most common risk-reward ratios offered by entries based on MACD.
Limitations of the MACD Strategy and How to Overcome Them
Indicators are not indisputable tools, they carry disadvantages to be aware of to get the most out of them. It is important to understand that they are not prediction tools but indicators that, being treated properly, might help to predict.
It is necessary to be aware of things like imprecision, lagging, and false signals. To overcome this situation, consider:
- Indicator's Reaction: Be careful of volatile markets, the MACD reacts to past price action and can not always offer signals according to speedy changes in market conditions.
- False Signals: Crossovers and divergences can indicate misleading signals. Using the MACD in combination with charting analysis, other indicators, and different timeframe views is key to overcoming weak signals.
Conclusion
The Moving Average Convergence Divergence is a powerful tool so far for crypto trading.
As we have seen, its intuitive interface displays three components suitable for understanding price movements, especially in trending markets and for reversal opportunities.
You can use and optimize MACD accordingly and strategically with other tools to gain insights into market conditions and momentum shifts.
Try MACD in Altrady
Try out Altrady's platform and explore its library of indicators to learn more about technical tools. You can SIGN UP FREE and start paper trading MACD strategies learned through this guide.