BTC has been sliding for two weeks, printing lower lows on rising fear. Today's candle opens below the prior low, dips another leg, then buyers storm back and close deep into the previous bearish body, piercing its midpoint. That is the piercing line signature, and for crypto traders it hints a short-term bottom may be forming.
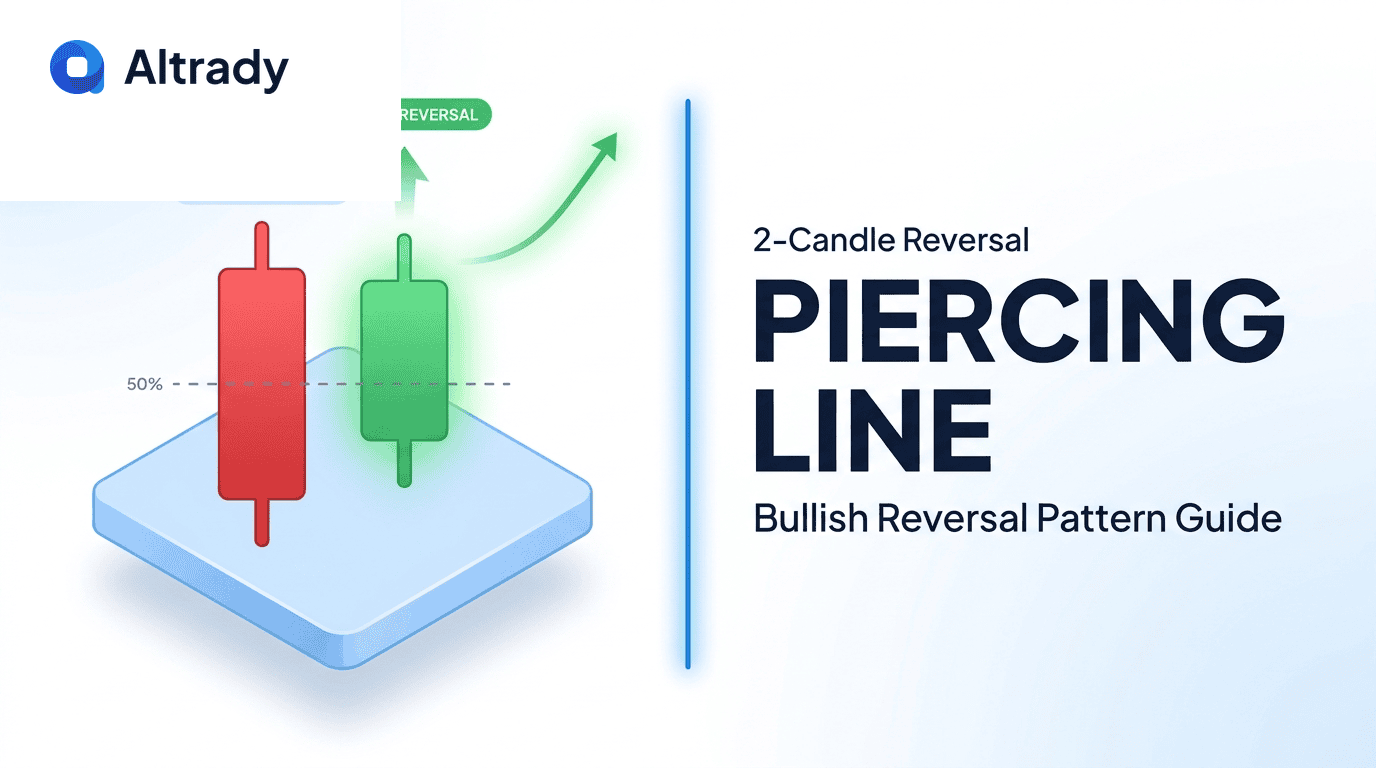
What Is a Piercing Line Pattern?
The piercing line is a 2-candle bullish reversal pattern that appears after a defined downtrend. Some traders also call it the "piercing pattern" because the second candle literally pierces deep into the body of the first. When the setup completes, it signals that sellers are losing control and that buyers are strong enough to reverse intraday sentiment in a single session.
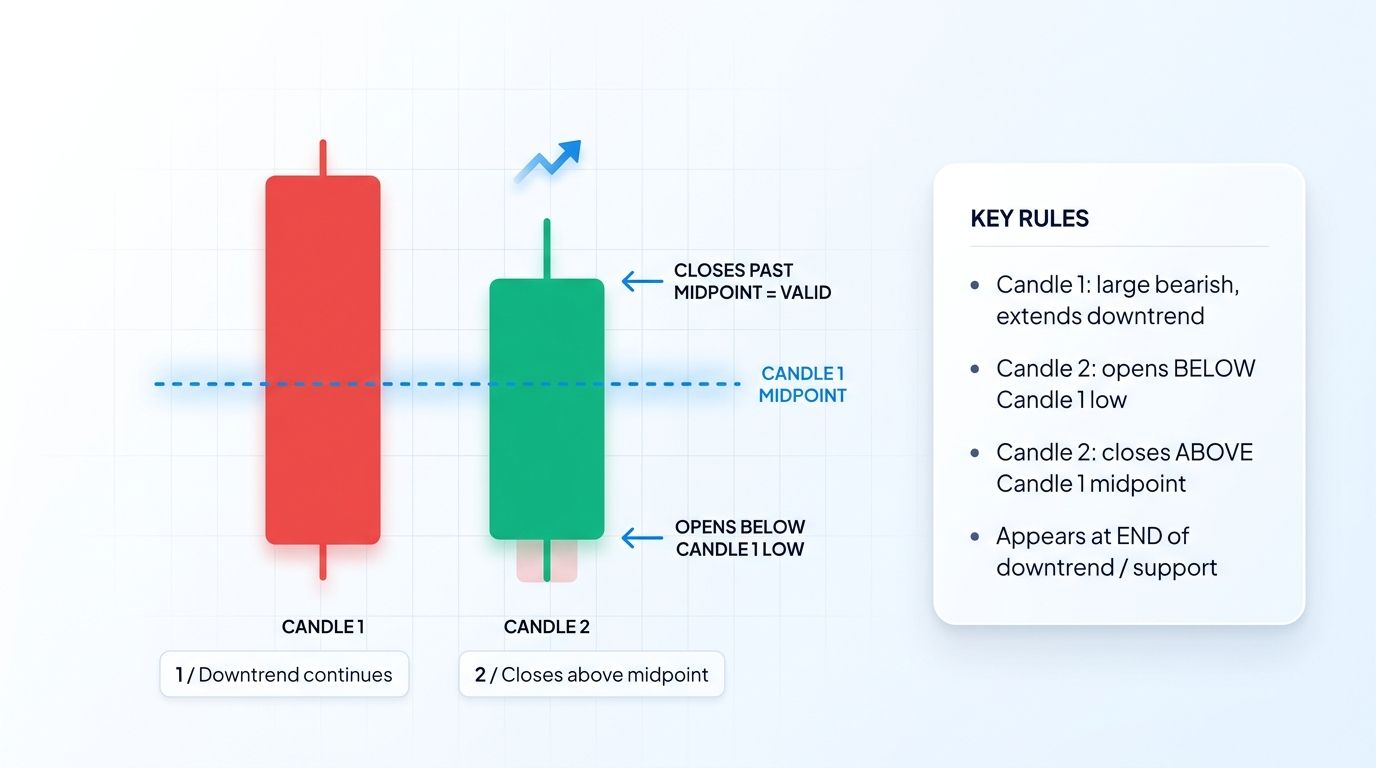
The structure has two specific candles. Candle 1 is a large bearish candle that confirms the ongoing downtrend. Candle 2 opens below Candle 1's low, trades lower early, but then closes above the midpoint of Candle 1's real body. The close must pierce past 50 percent of the prior red body, not just poke into it.
Compared to other reversal signals, the piercing line is considered moderately strong. It is weaker than a full bullish engulfing but more decisive than a single hammer because it requires confirmation from two candles and meaningful displacement into the prior range.
How to Identify a Piercing Line on a Chart
The two-candle structure
The piercing line is visually simple. Candle 1 is a tall red (bearish) candle with small wicks, showing sellers in control. Candle 2 is a green (bullish) candle that opens lower than Candle 1's close, then rallies to close well inside Candle 1's real body.
On the chart the two candles look like a staircase that changed direction mid-step: the red candle slides down, the green candle starts even lower, then climbs back up to recover more than half of the red body.
Key visual cues:
- Candle 1: large bearish body, minimal wicks.
- Candle 2: bullish body, open below prior close, close above prior midpoint.
- The close of Candle 2 is noticeably deep inside Candle 1.
Key identification rules
Not every green candle following a red candle qualifies. Use these filters:
- Downtrend prerequisite: the pattern only has meaning after a clear move lower. Look for at least 5 to 10 descending candles or a break below a prior structure low.
- Candle 2 opens below Candle 1's low: in traditional markets this is a gap down. In crypto, this requirement is softened because the market runs 24/7 and true gaps are rare. A lower open versus the prior close is acceptable.
- Candle 2 closes past the 50 percent midpoint of Candle 1's body: this is non-negotiable. If the close stops at 40 percent, the pattern fails.
- Volume confirmation: Candle 2 should show higher volume than Candle 1, confirming that real buyers stepped in, not just thin late-session drift.
- Support confluence: the setup is far more reliable at a prior support level, trendline, Fibonacci retracement, or horizontal range low.
Why Piercing Line Works: The Psychology
Every candlestick pattern is a story about crowd behavior. The piercing line tells a tight two-act drama about a failed short-side push.
In Act 1, sellers dominate. The big red candle prints on momentum, bearish traders feel confident, late longs panic-sell, and new shorts pile in. On Candle 2's open, the market opens lower and shorts celebrate. Price drifts further down and the bearish thesis appears confirmed.
Then Act 2 flips. Buyers step in, often at a known support where dip buyers and algorithmic bids are waiting. Price reverses and rallies hard. Late shorts realize they are trapped, and their forced cover adds fuel to the rally until the candle closes deep into the prior bearish body.
The deeper the close pushes into Candle 1, the more pain is inflicted on shorts and the more convincing the bullish reversal signal becomes. That is why the 50 percent midpoint rule exists. Any shallower and the sellers have not actually lost control.
Piercing Line vs Other Bullish Reversal Patterns
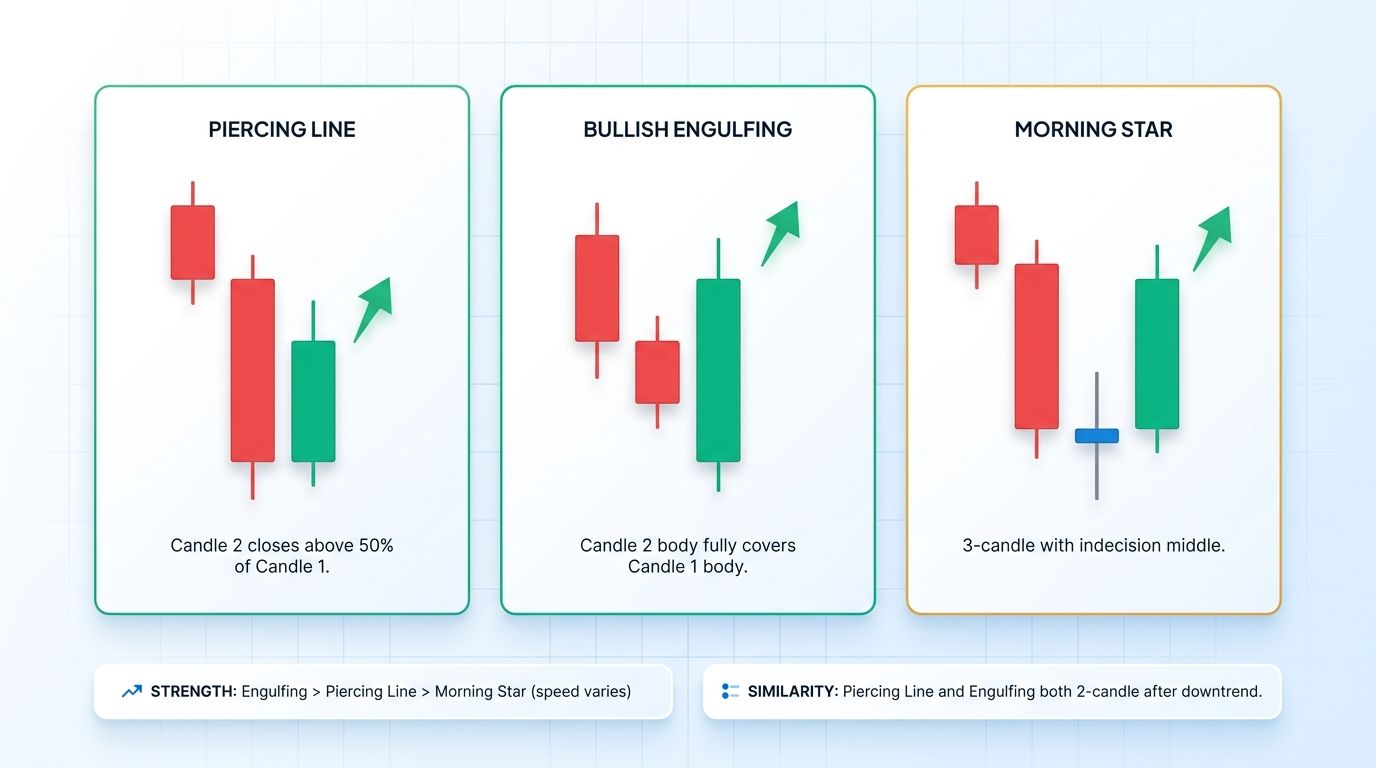
Piercing Line vs Bullish Engulfing
The piercing line and bullish engulfing are cousins, but the engulfing is stronger. In a bullish engulfing, Candle 2's body completely swallows Candle 1's body and closes above the prior open. In a piercing line, Candle 2 only recovers past the midpoint.
Comparing piercing line vs bullish engulfing on reliability, the engulfing typically produces slightly higher follow-through, but piercing lines are more frequent and still actionable with confluence.
Piercing Line vs Morning Star
The morning star is a 3-candle bullish reversal: a large red candle, a small-bodied indecision candle (doji or spinning top), then a strong green candle that closes deep into the first candle. The middle candle captures the moment of balance before the reversal.
The piercing line compresses this into 2 candles by skipping the pause. It is faster but sacrifices the confirmation the morning star provides through its middle candle.
Piercing Line vs Hammer
The hammer is a 1-candle reversal marked by a small real body near the top of the range and a long lower wick, showing intrabar rejection of lower prices in a single session.
The piercing line is a 2-candle pattern, so the buy signal extends across two sessions and requires the second candle to close strong. Hammers trigger smaller moves; piercing lines tend to mark more durable lows when combined with volume and support.
How to Trade the Piercing Line Pattern
Rule 1: Require a clear downtrend first
Without a preceding downtrend, the pattern is meaningless. Confirm the trend with a 20 or 50 period moving average sloping down, or by looking at the last 5 to 10 candles printing lower highs and lower lows.
Rule 2: Confirm Candle 2 opens below Candle 1 low
In equities this is a traditional gap down. In crypto, Candle 2 simply needs to open below Candle 1's close, preferably below the low. The lower the open, the more trapped shorts become when buyers push back.
Rule 3: Confirm Candle 2 closes past Candle 1's midpoint
Calculate the midpoint: (Candle 1 open + Candle 1 close) / 2. Candle 2's close must finish above that level. A close at 60 to 80 percent of Candle 1's body is ideal.
Rule 4: Use confluence (volume, support, indicators)
Never trade the piercing line in isolation. Stack at least two of the following:
- Higher volume on Candle 2 versus Candle 1.
- Pattern forms at prior horizontal support or a tested range low.
- RSI oversold (below 30) and starting to turn up.
- Price taps a key Fibonacci retracement (0.5, 0.618, or 0.786).
- Bullish divergence between price and RSI or MACD.
Entry, Stop, Target Framework
- Entry: market order at the close of Candle 2, or limit order on a small pullback to the midpoint.
- Stop loss: just below the low of Candle 2 or the nearest support, whichever gives a cleaner invalidation.
- Target 1: the next overhead resistance or prior swing high.
- Target 2: 1.5 to 2 times the distance from entry to Target 1, or a key Fibonacci extension.
- Risk-reward: aim for at least 2:1, ideally 3:1.
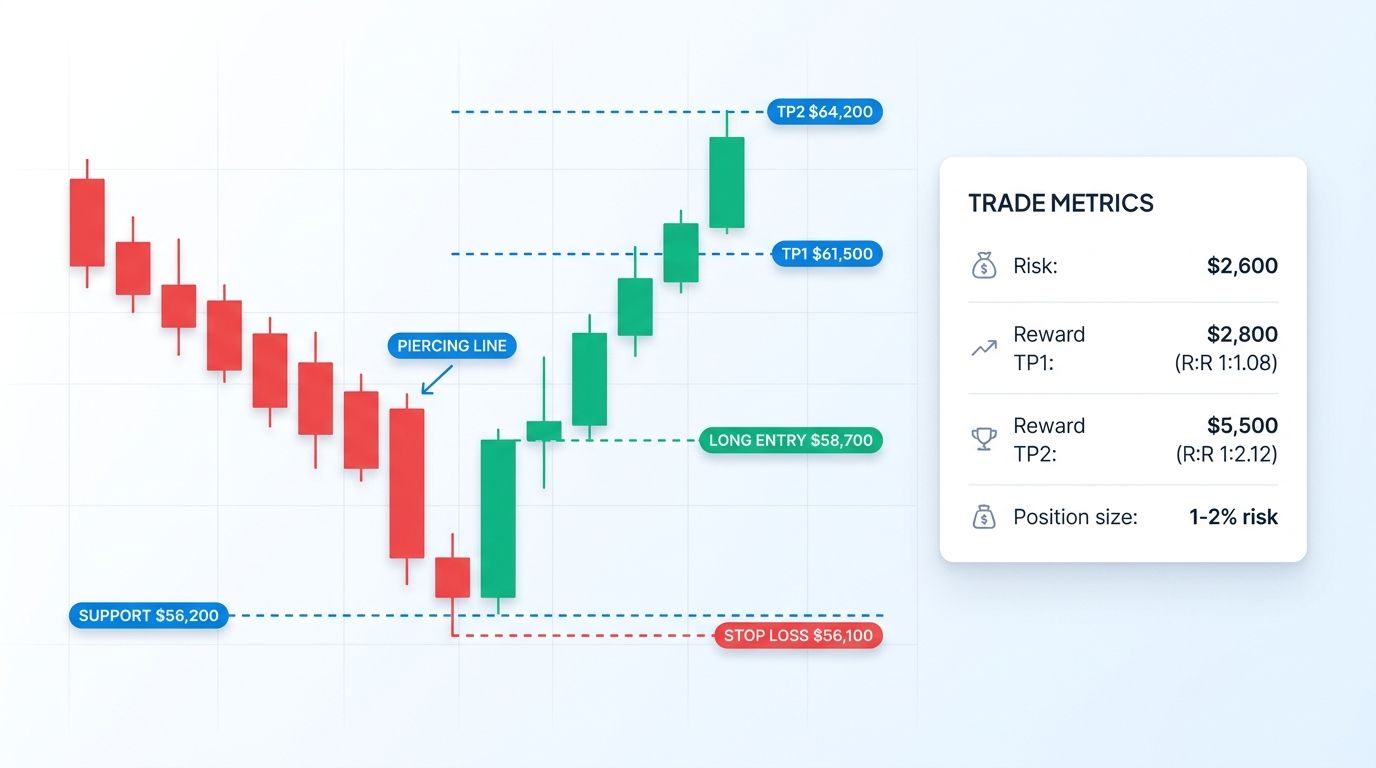
Example: Piercing Line at BTC Support
Imagine BTC has been sliding from $62,000 toward a weekly support zone near $56,000.
- Day 1: BTC opens at $59,400 and closes at $57,100. A large bearish candle. Midpoint = ($59,400 + $57,100) / 2 = $58,250.
- Day 2: BTC opens at $56,800, below Day 1's low of around $56,900. Early in the session it dips to $56,200. Buyers then defend the $56,000 weekly support and price rallies all day, closing at $58,700.
- The close of $58,700 sits above the $58,250 midpoint, confirming the piercing line. Volume on Day 2 is 30 percent higher than Day 1.
Trade plan:
- Long entry at $58,700 on Day 2 close.
- Stop loss at $56,100, just below Day 2's low and the support zone.
- Target 1 at $61,500 (prior minor resistance).
- Target 2 at $64,200 (prior swing high).
Math:
- Risk per unit: $58,700 - $56,100 = $2,600.
- Reward to TP1: $61,500 - $58,700 = $2,800. R:R ~ 1.08:1.
- Reward to TP2: $64,200 - $58,700 = $5,500. R:R ~ 2.12:1.
Scaling: take 50 percent off at TP1, trail the remainder with a structure-based stop toward TP2. Total blended R:R improves to roughly 1.6:1, which is acceptable given the clean confluence.
Common Mistakes When Trading Piercing Line
Even with a clean pattern, traders repeatedly sabotage the setup. Watch for these errors:
- Trading piercing lines in ranges: without a downtrend, the pattern loses its reversal meaning.
- Accepting shallow closes: a close at 30 or 40 percent of Candle 1's body is not a piercing line.
- Ignoring volume: a piercing line on declining or flat volume is weak. Demand expansion.
- No support confluence: entering without a structural reason invites failure.
- Oversized stops: placing a stop far below Day 2 breaks the risk math.
- Entering late: waiting for extra confirmation candles means buying at a worse price.
- Ignoring higher-timeframe trend: a piercing line on the 15-minute chart against a strong daily downtrend rarely produces a macro reversal.
Piercing Line in Crypto Markets
Crypto markets never close. There are no weekends, no overnight halts, and very few true gaps. That shifts how we apply the piercing line compared to textbook equity charts.
Key crypto-specific adaptations:
- Relax the gap-down rule: Candle 2 rarely opens below Candle 1's low because the market rolls continuously. A lower open versus the prior close is sufficient as long as the midpoint rule holds.
- Use higher timeframes: 4H, 8H, 12H, and daily piercing lines carry more weight than 5-minute patterns dominated by noise.
- Watch BTC context: altcoin piercing lines are more reliable when BTC is stabilizing or printing a similar bullish structure.
- Account for news and funding: downtrends driven by listings, delistings, or funding extremes can produce textbook piercing lines that fail if the catalyst continues.
A piercing line at major support on the daily BTC chart, with rising volume and oversold RSI, is one of the cleaner bullish reversal setups available to crypto traders.
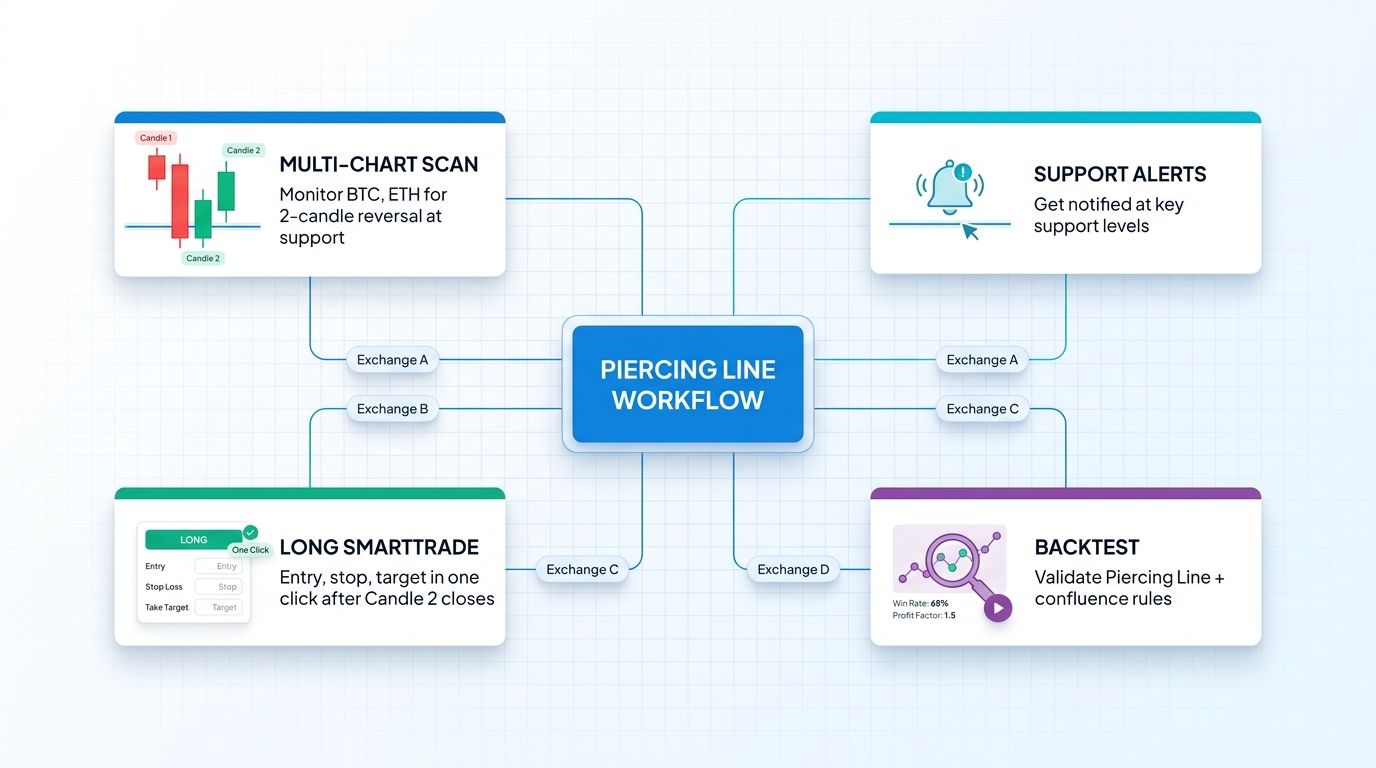
How Altrady Helps You Spot and Trade Piercing Line
Finding a piercing line is easier when your tools do half the work. Altrady is a multi-exchange crypto trading terminal built to compress pattern recognition, validation, and execution into a single workspace.
- Multi-chart view: monitor BTC, ETH, and your altcoin watchlist on one screen across timeframes to spot piercing lines as they form.
- Alerts: set price and indicator alerts on key support zones so you are notified when Candle 2 prints near a marked level.
- SmartTrade orders: enter long positions with stop loss and multiple take-profit levels in one ticket, ideal for the scaled TP1/TP2 approach.
- Paper trading: test the pattern on live markets without risking capital.
- Backtest: review historical data to measure how often piercing lines led to follow-through and what R:R to expect.
- Scanners: surface coins in downtrends and oversold conditions to narrow your candidate list fast.
Start your free trial with Altrady and turn your piercing line rules into a repeatable, multi-exchange workflow.
Frequently Asked Questions
Is the piercing line pattern reliable?
The piercing line is moderately reliable as a bullish reversal signal, but only when its conditions are strictly met. In isolation, on a random chart, it produces mixed results. In a clear downtrend, at a confluence zone such as prior support or an oversold RSI, with rising volume on Candle 2, studies and trader experience suggest follow-through improves meaningfully. Treat it as a high-probability filter, not a guarantee, and always validate with a stop loss, risk-reward framework, and broader market context before committing capital.
What is the difference between a piercing line and bullish engulfing?
Both are 2-candle bullish reversal patterns, but they differ in how much of Candle 1 the second candle reclaims. In a piercing line, Candle 2 closes above the 50 percent midpoint of Candle 1's body but below its open. In a bullish engulfing, Candle 2's body completely covers Candle 1's body and closes above its open. The bullish engulfing is stronger because buyers fully erased the prior bearish session. The piercing line vs bullish engulfing choice often comes down to availability - the engulfing is less frequent but more decisive.
Can a piercing line appear in crypto without a gap down?
Yes. Crypto markets trade 24/7, so true gaps between sessions are rare. Many clean piercing lines appear with Candle 2 opening below Candle 1's close but without a visible gap below the low. For crypto traders, the critical rule is not the gap, but the midpoint recovery. If Candle 2 opens below the prior close, trades lower initially, and then closes above Candle 1's midpoint on rising volume, the pattern is valid. The continuous market simply changes how the opening looks on the chart.
What timeframe is best for trading piercing line?
Higher timeframes produce more reliable piercing lines. The daily, 12-hour, 8-hour, and 4-hour charts are the sweet spot for most swing traders, especially on majors like BTC and ETH. Below 1 hour, noise dominates and many patterns fail quickly. Intraday traders can use 15-minute and 30-minute charts for entries, but the trend context and support zones should come from higher timeframes. A piercing line on the daily chart, aligned with a daily support and a 4-hour bullish structure, is far stronger than an isolated 5-minute signal.
Where should I place my stop loss for a piercing line trade?
The cleanest invalidation is just below the low of Candle 2. If that low is too close and creates a tiny stop that noise will trigger, use the nearest structural support below instead. Never use a stop wider than the distance between Candle 2's low and the nearest clearly visible prior swing low. Size the position so that the stop represents no more than 1 to 2 percent of your account. If Candle 2 sits directly on a major support, a stop a few percent below that support gives the trade breathing room without breaking your risk framework.
Conclusion
The piercing line is a clean, readable 2-candle pattern that gives crypto traders an early hint that sellers are losing control. It works best when the setup appears after a real downtrend, Candle 2 opens below the prior close, the close pierces past 50 percent of the prior body, and confluence lines up with support, volume, and oversold momentum.
Traded mechanically, with a fixed entry, clear stop, and scaled targets, the piercing line becomes a repeatable edge rather than a one-off hunch. Combine it with higher-timeframe context and BTC market structure and you filter out most of the weak signals.
Start your free trial with Altrady, build your piercing line watchlist across exchanges, and put these rules into action with SmartTrade orders, multi-chart views, and live alerts.