A single shooting star candle can mark the top of a months-long rally before most traders notice the shift. The shape looks nearly identical to an inverted hammer, but trend context flips its meaning from bullish to bearish in an instant. This guide covers how to spot a real shooting star, distinguish it from its lookalikes, and trade it with disciplined risk rules on any crypto timeframe.
What Is a Shooting Star Candlestick Pattern?
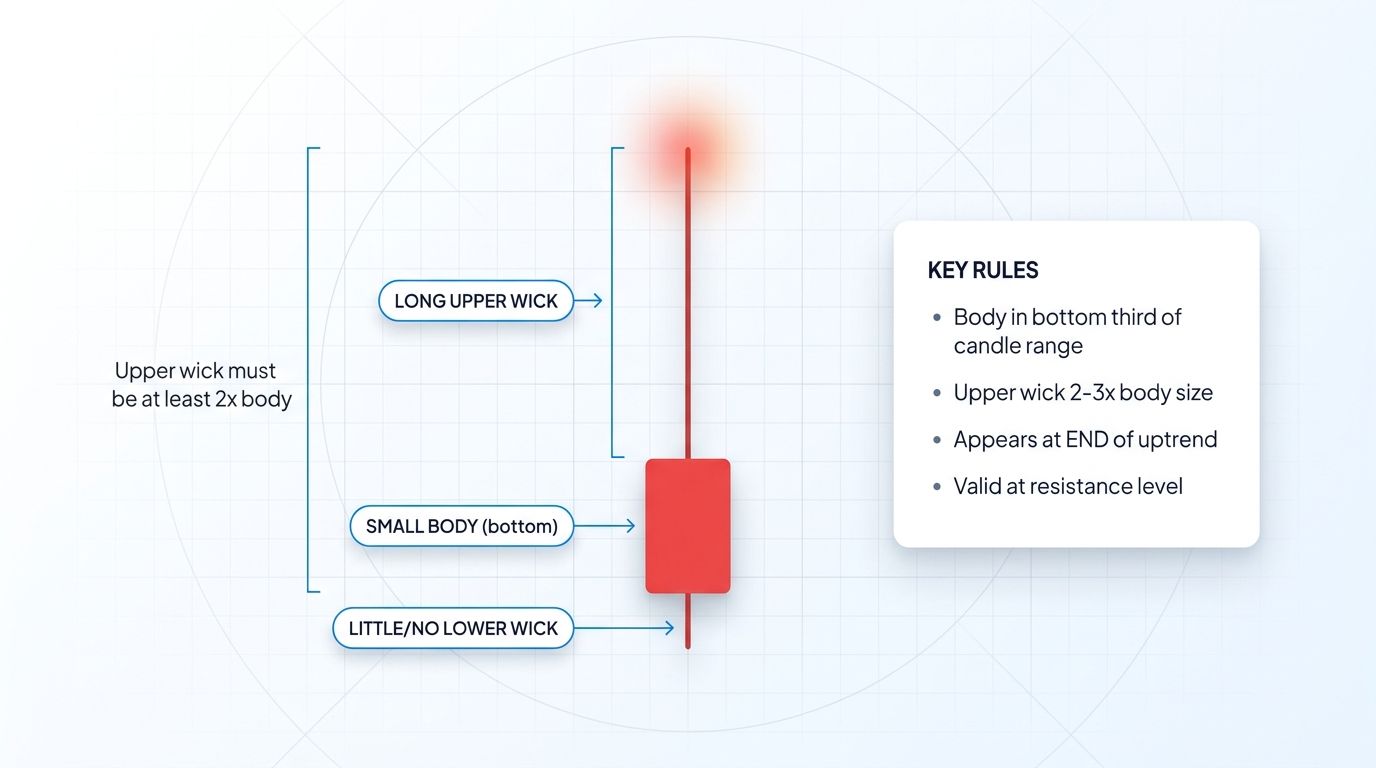
The shooting star candlestick pattern is a single-candle bearish reversal signal that appears at the top of an uptrend or near a clear resistance level. It has three visual features: a small real body near the bottom of the candle's range, a long upper wick stretching at least two to three times the body length, and little to no lower wick. The shape looks like an inverted hammer, but its position at the end of a rally flips its meaning.
This pattern matters because it offers an early visual warning that buyers have lost control. During the session, price pushed aggressively higher to test new highs, but sellers stepped in hard and dragged price back down to close near the open. That rejection wick is a printed record of failed momentum. For traders who respect context, a shooting star at the right location can flag the end of a trend before moving averages or oscillators even turn.
Not every candle with a long upper wick qualifies. A valid shooting star requires a clear prior uptrend, the correct shape, and ideally confluence with other signals.
How to Identify a Shooting Star on a Chart
Accurate identification comes down to strict visual rules. Guess the shape on the fly and you will end up shorting noise. Apply a checklist instead.
A valid shooting star must have a small real body, either green or red in color. A red (bearish) body carries a slightly stronger signal because it confirms that sellers won the session, but a small green body is still acceptable if the wick structure is correct. The body should be located at the bottom third of the candle's total range, with the upper wick towering above it.
The upper wick needs to measure at least two times the body length, and ideally two to three times. A wick that is only slightly longer than the body is not a shooting star; it is a weaker rejection candle with less predictive power. Lower wick should be minimal or absent. A candle with roughly equal upper and lower wicks is a spinning top, not a shooting star.
Context is non-negotiable. The shooting star candlestick pattern only carries weight when it forms at the top of a clear uptrend or at a tested resistance level. In a sideways range, the same shape is often just random volatility. Higher timeframes also matter. A daily or weekly shooting star at a multi-month resistance zone is a high-quality signal. A one-minute shooting star during an Asian session lull is almost always noise.
Shooting Star vs Inverted Hammer vs Gravestone Doji vs Hanging Man
Four patterns share similar visual traits but carry very different meanings. Confusing them is one of the fastest ways to lose money on a technically correct chart read.
Shooting Star
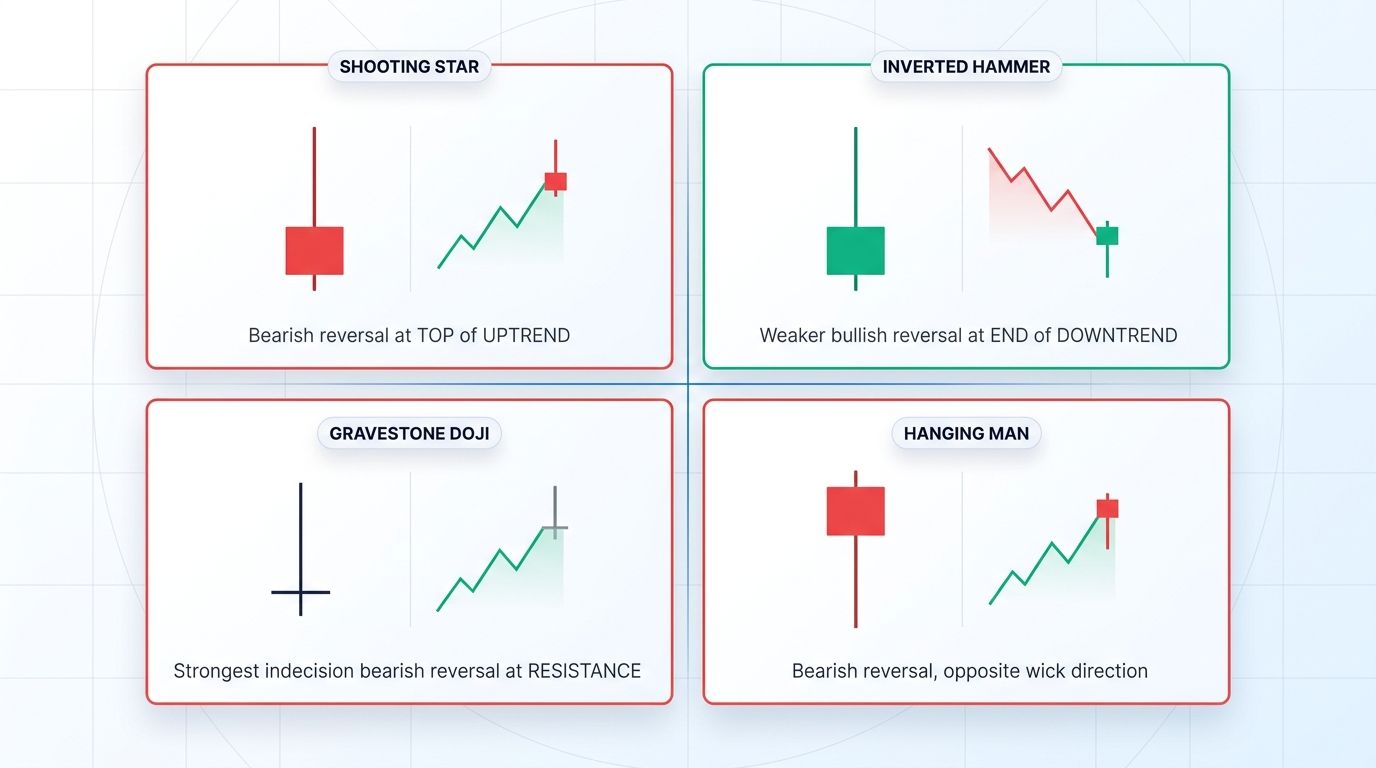
Small body at the bottom of the range, long upper wick at least two times the body, little or no lower wick. Appears at the TOP of an UPTREND or at resistance. It is a bearish reversal signal. The rejection wick shows that buyers tried to continue the rally but were overwhelmed by sellers.
Inverted Hammer
Exact same shape as the shooting star. Small body at the bottom of the range, long upper wick, minimal lower wick. The difference is location. It appears at the BOTTOM of a DOWNTREND. It is a potential bullish reversal signal, though weaker than a classic hammer because the close is near the low. Prior trend direction is the single factor that separates these two patterns, which is why trend context is everything.
Gravestone Doji
Similar long upper wick profile, but the body has zero height because the open equals the close. Appears at the TOP of an UPTREND or at resistance and signals a bearish reversal. Because the body is effectively a flat line, the gravestone doji reflects stronger indecision than a shooting star and often precedes sharper reversals when volume confirms the rejection.
Hanging Man
Different shape from the three above. The hanging man has a small body at the TOP of the candle range and a long LOWER wick. It appears at the top of an uptrend and signals a bearish reversal, but its psychology differs. The long lower wick reflects an intrasession drop that was bought back, which can look bullish but often signals that support is starting to crack at highs.
The takeaway is simple. Shooting star and inverted hammer are visually identical twins with opposite meanings defined by prior trend. Gravestone doji is the indecision cousin of the shooting star. Hanging man is a separate shape entirely. Never confuse them.
What the Shooting Star Tells You About Market Psychology
Every candle is a story of intrasession order flow. The shooting star tells a specific one. Buyers entered the session confident, pushed price to new highs, and expected continuation. Sellers waited at resistance and hit the offer in size. Price collapsed from the session high back down to close near the open.
By the end of the candle, aggressive buyers are trapped at the top of the wick with losing positions. Sellers now have momentum and a clear reference point. The longer the upper wick and the closer the close is to the open or low, the more dramatic the rejection. That is why the shooting star is read as a shift in control, not just a pause.
When this candle prints at a known resistance level or after an extended rally, it often coincides with buyer exhaustion. Latecomers chased the move, early buyers took profit, and sellers defended a structural level. The pattern captures that transfer of control in a single bar.
How to Trade a Shooting Star Candlestick Pattern
Pattern recognition alone is not a strategy. Turning a shooting star into a tradable setup requires a repeatable framework. Use the rules below as a filter, not as suggestions.
Rule 1: Demand a clear uptrend first
A shooting star in the middle of a range has no meaning. Only valid after a defined uptrend or at a retest of overhead resistance. If you cannot draw a clean series of higher highs and higher lows into the candle, skip the setup.
Rule 2: Require confirmation
Do not short on the shooting star candle itself. Wait for the next candle to close below the shooting star's low. Confirmation filters out a meaningful percentage of false signals and is one of the highest expected value rules in this playbook.
Rule 3: Check volume
A shooting star with above-average volume on the rejection session carries far more weight than one on thin volume. Heavy volume confirms that sellers were aggressive, not passive. Low-volume shooting stars on major pairs can still be useful but deserve a smaller position.
Rule 4: Use confluence
Stack signals. A shooting star at horizontal resistance with overbought RSI and a bearish divergence on a momentum oscillator is a very different setup from a shooting star in isolation. The more independent reasons the trade has, the higher the probability.
Entry, Stop, Target Framework
- Entry: on the close of the confirmation candle, or on a retest of the shooting star's midpoint for better risk-reward
- Stop loss: just above the shooting star's high (the rejection point). Stops placed inside the body get taken out on normal retracement
- Target 1: next swing low or support zone, aiming for a minimum 1:2 reward to risk
- Target 2: major structural support or a prior breakout zone
- Consider scaling out partial profit at Target 1 and trailing the remainder for Target 2
Example: Trading a Daily Shooting Star on BTC
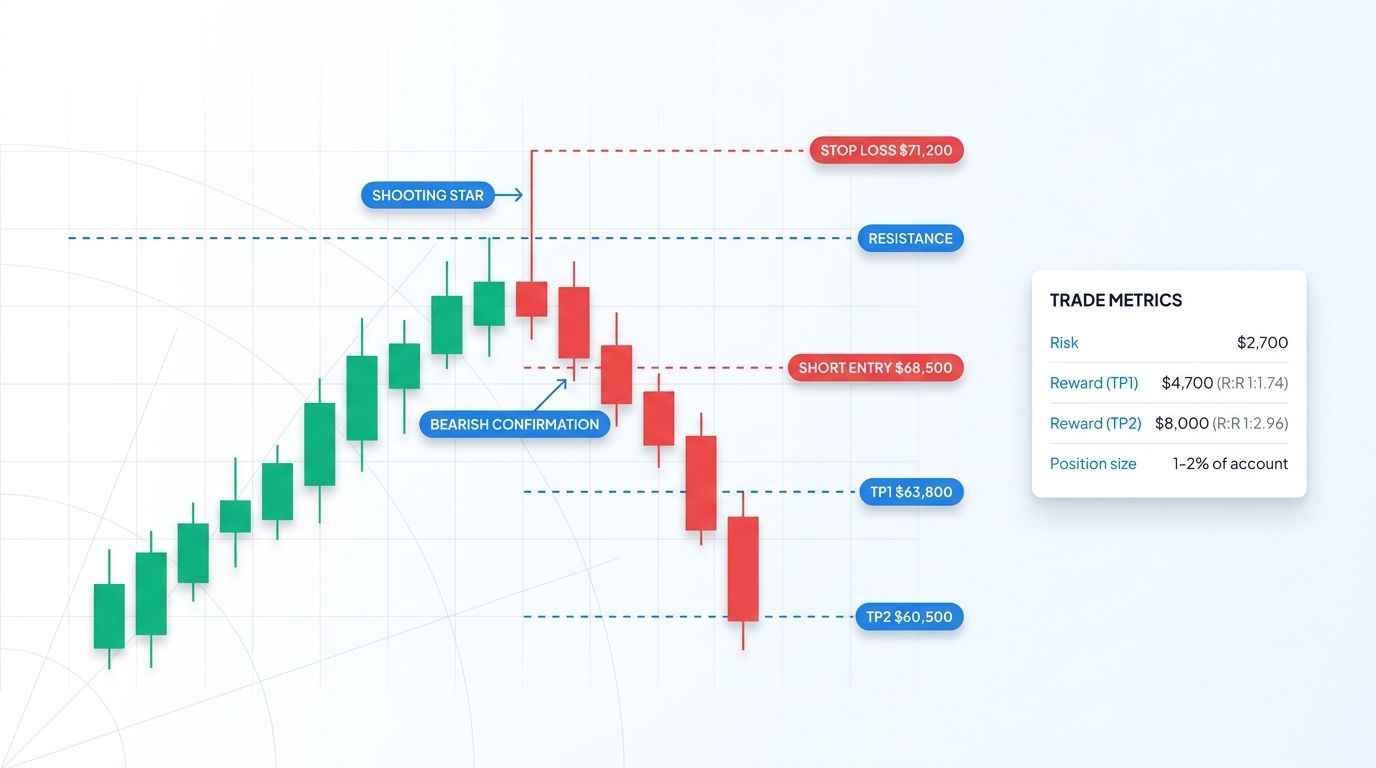
Imagine BTC has rallied for three weeks and approaches a weekly resistance at $70,000. On Tuesday, the daily candle opens at $68,200, spikes to a high of $71,000, and closes at $68,500. Volume on that day is roughly 150% of the 20-day average. The body is red, small, and sits at the bottom of the range. The upper wick measures about 2.5 times the body. This is a textbook shooting star candlestick pattern at a significant weekly level.
On Wednesday, the daily candle closes at $67,400, below the shooting star's low of $67,900. Confirmation is in. A short is entered at $68,500 on a partial retrace into the shooting star midpoint. Stop loss is placed just above the shooting star high at $71,200. Target 1 is prior support at $63,800. Target 2 is a deeper structural support near $60,500.
Risk is roughly $2,700 per unit. Reward to Target 1 is about $4,700 and to Target 2 about $8,000, yielding 1:1.7 and 1:3 reward-to-risk. With 1 to 2 percent of account equity at risk, position size is the risk budget divided by the per-unit stop distance. This is the calm, rule-based setup the shooting star was designed for.
Common Mistakes When Trading Shooting Stars
Even experienced traders repeat the same errors with this pattern. Watch out for these.
- Confusing shooting star with inverted hammer. Identical shape, opposite meaning based on prior trend. Always classify the trend before labeling the candle.
- Entering short on the shooting star itself without confirmation. The very next candle often reverses back up, especially in strong trends.
- Ignoring prior trend. A shooting star inside a sideways range is noise, not a signal.
- Using shooting stars on one-minute or five-minute charts for scalping. Low timeframe noise produces dozens of false signals per day.
- Setting stops too tight. Placing a stop inside the body instead of above the wick guarantees being shaken out on normal retracement.
- Shorting counter-trend when the higher timeframe remains strongly bullish. A four-hour shooting star against a rising weekly trend has much lower odds than one aligned with a higher timeframe downturn.
Shooting Star Patterns in Crypto Markets
Crypto's 24/7 trading and high volatility produce a steady stream of shooting star formations. Many, especially on low-cap altcoins and short timeframes, are fakeouts driven by thin liquidity, liquidation cascades, or single-whale activity.
To raise signal quality in crypto, apply four filters. First, prioritize higher timeframes. Four-hour, daily, and weekly shooting stars at structural levels carry real weight. Second, favor major pairs with deep liquidity such as BTC, ETH, SOL, and top altcoins. Third, look for confluence with horizontal resistance, Fibonacci extension zones, or key moving averages. Fourth, be skeptical of weekend shooting stars. Weekend volume is often dominated by smaller participants, and rejections that look clean Saturday sometimes fully reverse by Monday when institutional flow returns.
A shooting star crypto setup that stacks all four filters is rare, but when it appears, it is one of the more reliable short signals available to discretionary traders.
How Altrady Helps You Spot and Trade Shooting Star Patterns
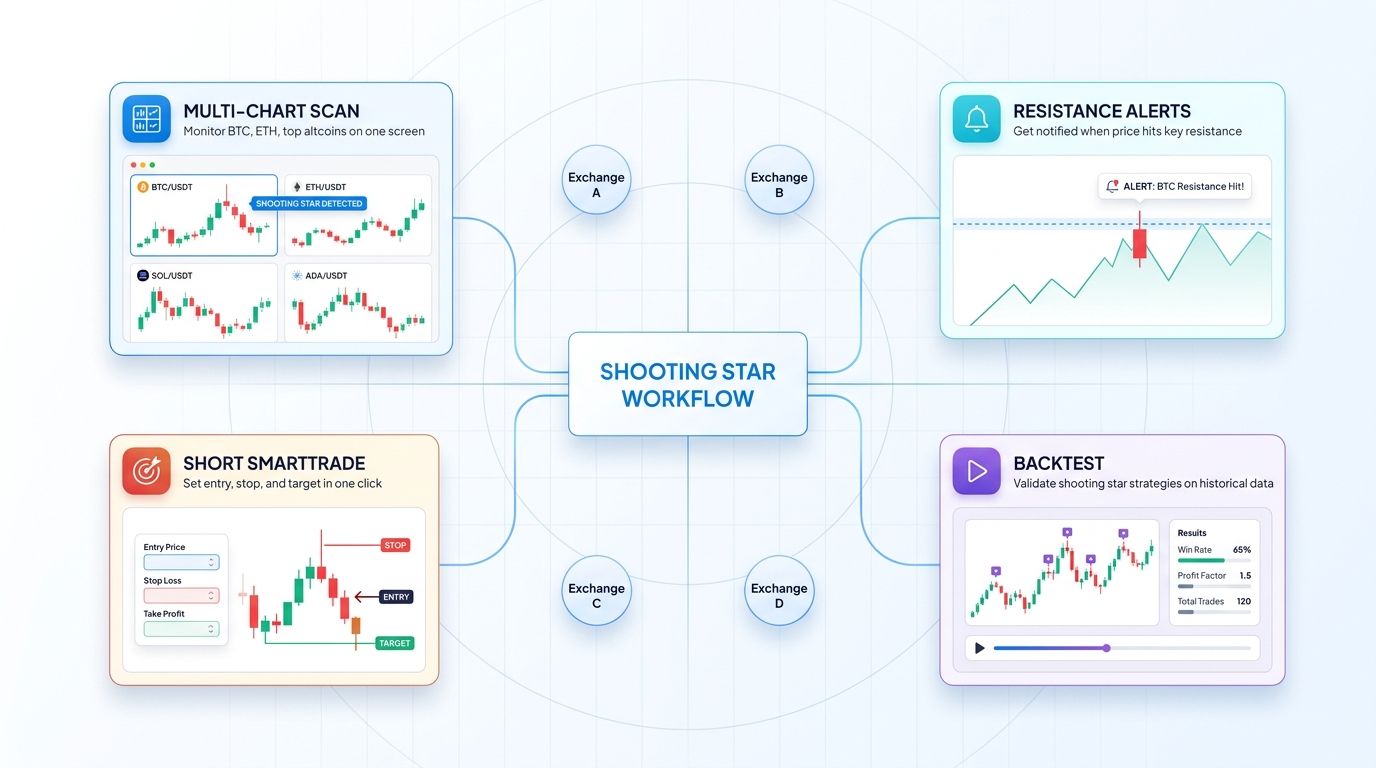
Pattern recognition is only as good as the tools that surface signals when they matter. Altrady is built to support the exact workflow described above across dozens of exchanges in one account.
- Multi-chart view scans multiple pairs at once for shooting star formations instead of flipping through tabs.
- Custom alerts at resistance levels notify you when price approaches zones where shooting stars carry weight.
- SmartTrade orders place precise entries, stops above the rejection wick, and staged take-profits in one workflow.
- The backtest tool validates shooting star plus confluence strategies on historical data before committing capital.
- Paper trading mode is ideal for practicing pattern recognition on live price action without risking real funds.
Traders who want to apply this framework across BTC, ETH, and major altcoins can start your free trial with Altrady to test the full workflow. The free trial covers the complete toolset so you can validate signals and refine entries inside a unified terminal.
Frequently Asked Questions
Is a shooting star bullish or bearish?
The shooting star is a bearish reversal pattern, but only when it appears at the top of an uptrend or at a resistance level. The same visual shape at the bottom of a downtrend is called an inverted hammer and signals a potential bullish reversal. Context flips the meaning entirely, which is why classifying the prior trend is step one.
How reliable is the shooting star candlestick pattern?
On its own, the shooting star has a mediocre win rate of roughly 55 to 60 percent depending on market and timeframe. With confluence such as a clear resistance level, overbought oscillator reading, bearish divergence, and a confirmation candle, win rates commonly reach 70 percent or higher. Never trade the shape alone.
What is the difference between a shooting star and a gravestone doji?
A shooting star has a small but visible body near the bottom of the candle range. A gravestone doji has effectively no body because the open and close are equal, with the same long upper wick above. Both signal bearish reversal at resistance, but the gravestone doji reflects stronger indecision and often precedes larger moves when volume confirms the rejection.
Can I trade shooting stars on the 15-minute chart?
You can, but signal quality drops significantly on lower timeframes. The best results come from four-hour, daily, and weekly shooting stars at clear structural resistance. Lower timeframe shooting stars are noisy and produce frequent fakeouts, especially in crypto's 24/7 environment.
Do I need volume confirmation to trade a shooting star?
It is strongly recommended. A shooting star with above-average volume signals real seller commitment on the rejection session. A shooting star on thin volume can be a weak signal or even a fakeout, particularly on altcoins or during low-activity sessions. Volume is the second layer of evidence after trend context.
Conclusion
The shooting star candlestick pattern is a powerful bearish reversal signal, but only when it appears at the end of a clear uptrend or at a tested resistance level, with confirmation and ideally volume support. The shape alone means nothing without context. Confusing it with an inverted hammer, trading it mid-range, or shorting the candle itself without confirmation are the most common ways traders lose money with this setup.
Stick to higher timeframes, demand confluence, and place stops above the rejection wick rather than inside the body. Do that consistently and the shooting star becomes a dependable tool for timing tops in crypto.
If you want a terminal built to surface these patterns across major exchanges, scan multiple pairs at once, and place disciplined entries with staged exits, start your free trial with Altrady today and put the full workflow to the test.