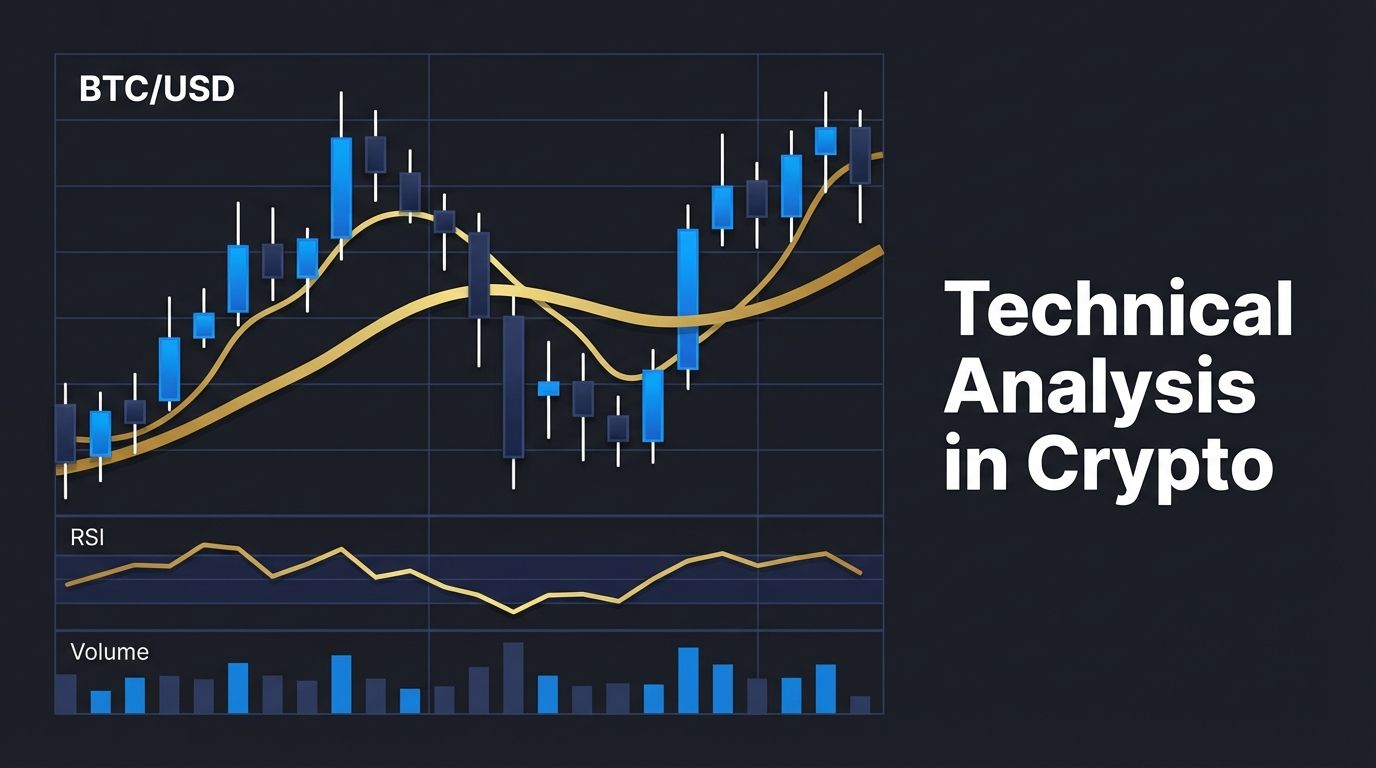
Technical analysis is one of the most widely used approaches in crypto trading. Rather than asking whether a project has good fundamentals or a promising team, technical analysis asks one question: what does the price chart say right now? By studying historical price movements, trading volume, and chart patterns, traders make informed decisions about when to enter a position, where to place a stop-loss, and when to take profit.
In crypto markets, technical analysis has taken on added importance compared to traditional markets. Prices move faster, volatility is higher, and sentiment shifts happen in hours rather than weeks. A trader who understands how to read a chart has a meaningful edge over one who is reacting purely on instinct or news headlines. This guide covers everything you need to build that edge, from the foundational concepts to the specific indicators that experienced crypto traders rely on every day.
1. What Is Technical Analysis and Why It Works in Crypto
Technical analysis, often abbreviated as TA, is the practice of evaluating assets by analyzing statistics generated by market activity. This means studying price charts, volume data, and mathematical indicators derived from price history. The goal is to identify patterns and signals that suggest where the price is likely to move next.
The core assumption behind technical analysis is that all known information about an asset is already reflected in its price. News, sentiment, fundamentals, and market psychology are all baked into the chart. Because of this, TA practitioners focus entirely on price behavior rather than external factors.
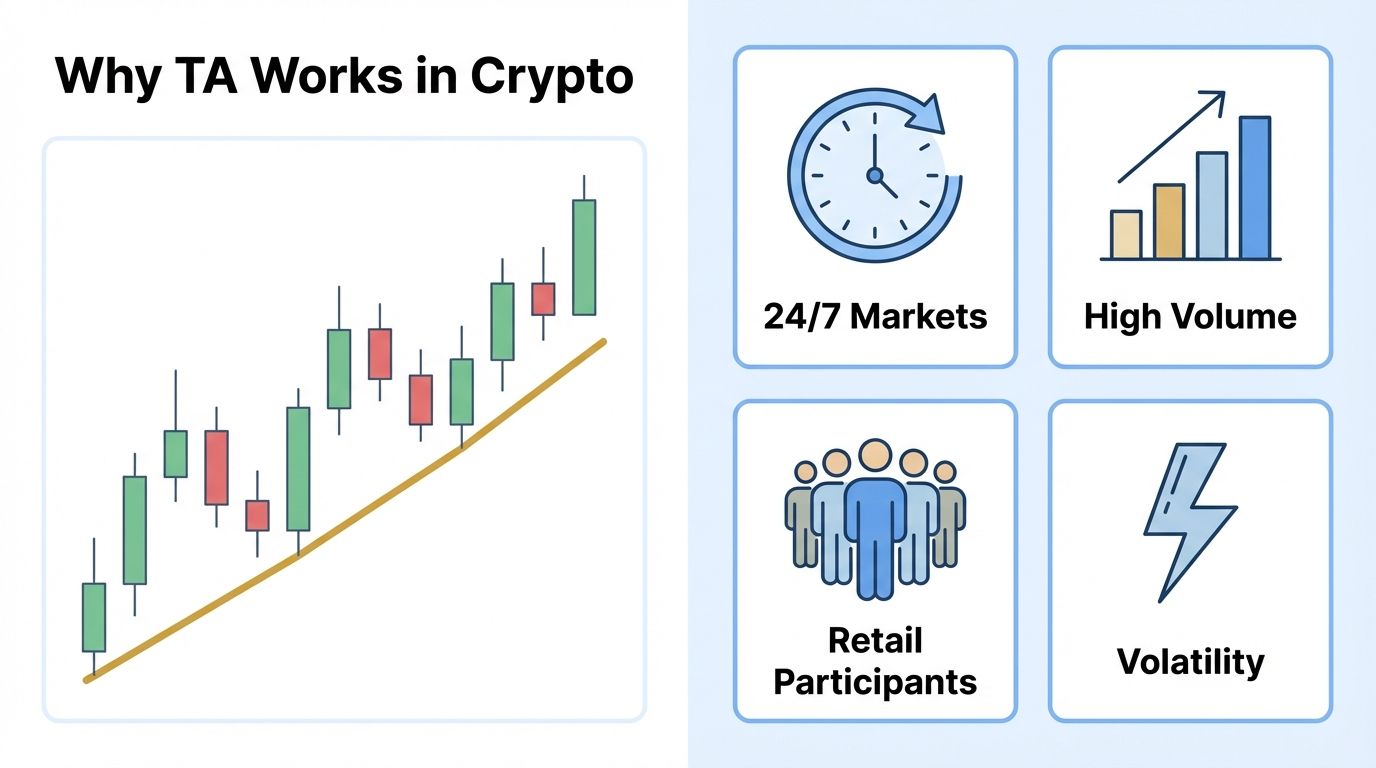
Why Technical Analysis Is Especially Effective in Crypto
Several characteristics of crypto markets make technical analysis particularly relevant:
- High liquidity on major pairs: Bitcoin, Ethereum, and the top altcoins are traded around the clock across hundreds of exchanges, creating large datasets of price action that respond predictably to key levels.
- Retail-driven markets: A large portion of crypto trading volume comes from retail participants who react to the same chart patterns, which reinforces those patterns over time.
- 24/7 trading: Unlike stock markets, crypto never closes. Technical analysis provides a framework for navigating markets that do not have fixed sessions or settlement periods.
- Emotion-driven volatility: Sharp rallies and crashes driven by fear and greed create textbook technical setups: breakouts, reversals, and consolidation patterns that experienced TA traders recognize immediately.
Technical analysis does not predict the future with certainty. It identifies high-probability setups, meaning scenarios where the risk-reward ratio favors a trade based on historical precedent. Used correctly, it transforms random-looking price movements into structured opportunities.
2. Core Concepts Every Technical Analyst Must Understand
Before diving into indicators and tools, you need to understand the foundational concepts that form the language of technical analysis. These ideas appear in every chart discussion, every trading signal, and every strategy.
Price Action
Price action refers to the raw movement of price over time, without overlaying any indicators. Reading price action means understanding what the market is doing right now through the shape of candles, the speed of moves, and the context of recent history. Many experienced traders rely primarily on price action and use indicators only as secondary confirmation.
Support and Resistance
Support is a price level where buying pressure has historically been strong enough to stop a decline. Resistance is a price level where selling pressure has historically been strong enough to stop a rally. These levels act like invisible floors and ceilings on the chart. When price breaks through a resistance level and closes above it, that level often flips into support. This concept is called role reversal and is one of the most reliable patterns in all of technical analysis.
Trend Lines and Market Structure
A trend line is a straight line drawn across a series of higher lows in an uptrend, or lower highs in a downtrend. Trend lines visually map the direction and momentum of a market. When price breaks convincingly through a major trend line, it signals a potential change in market structure. Market structure itself refers to the sequence of highs and lows that define whether a market is in an uptrend, downtrend, or ranging condition.
Chart Patterns
Chart patterns are recognizable formations that price creates on a chart, often signaling continuation or reversal of the current trend. Common continuation patterns include flags, pennants, and wedges. Common reversal patterns include head and shoulders, double tops, double bottoms, and cup and handle formations. No pattern works 100 percent of the time, but patterns with strong volume confirmation carry higher reliability.
3. Key Technical Indicators for Crypto Traders
Indicators are mathematical calculations derived from price and volume data that help traders identify trends, momentum, volatility, and potential reversal points. The best approach is to use a small selection of complementary indicators rather than loading a chart with every tool available.
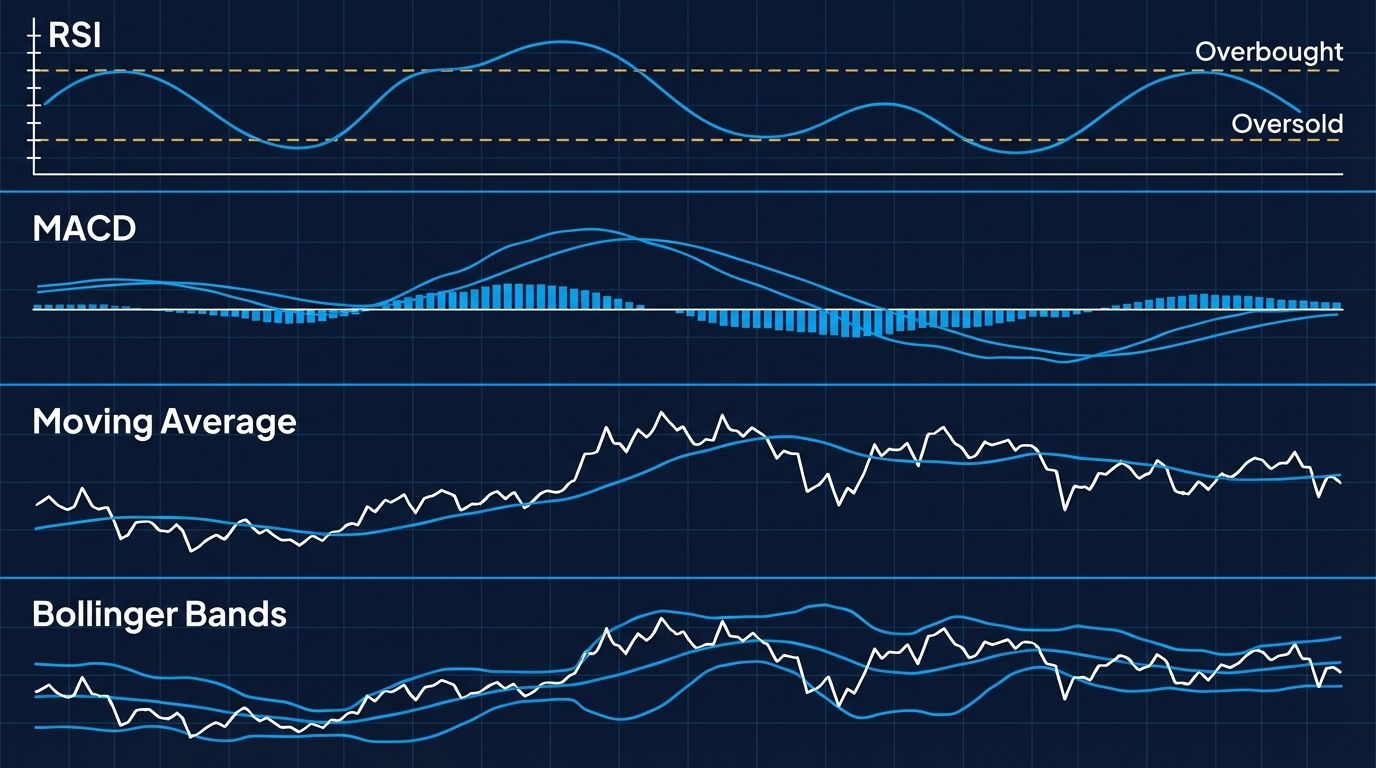
Relative Strength Index (RSI)
RSI is a momentum oscillator that measures the speed and change of price movements on a scale from 0 to 100. A reading above 70 suggests an asset may be overbought, meaning a pullback could follow. A reading below 30 suggests an asset may be oversold, meaning a bounce is more likely. In strong trending markets, RSI can stay in extreme zones for extended periods, so traders use it alongside trend context rather than as a standalone signal.
Moving Average Convergence Divergence (MACD)
MACD shows the relationship between two exponential moving averages of price, typically the 12-period and 26-period EMAs. The MACD line is the difference between those two EMAs. A signal line (9-period EMA of the MACD) is overlaid on top. When the MACD line crosses above the signal line, it is considered a bullish signal. When it crosses below, it is bearish. The histogram below the indicator shows the strength of that divergence. MACD is particularly useful for identifying momentum shifts at the early stage of a new trend.
Moving Averages
Moving averages smooth out price data over a defined period to reveal the underlying trend direction. The 50-period and 200-period moving averages are the most widely watched. When the 50 MA crosses above the 200 MA, this is called a golden cross, a widely interpreted bullish signal. The inverse, the 50 MA crossing below the 200 MA, is called a death cross and signals bearish momentum. Traders also use moving averages as dynamic support and resistance levels.
Bollinger Bands
Bollinger Bands consist of a middle band (usually a 20-period SMA) with two outer bands set at two standard deviations above and below the middle. When the bands are wide, the market is volatile. When they narrow into a squeeze, it indicates consolidation that often precedes a sharp breakout. Price touching the upper band is not automatically a sell signal, but it does mean the asset is in the upper range of recent volatility, which calls for careful assessment.
Volume
Volume is the total number of units traded in a given period and is arguably the most underused tool in crypto TA. High volume confirms a price move. A breakout on low volume is far more likely to fail than one accompanied by a significant spike in volume. Declining volume during a rally suggests weakening buying interest. Volume divergence, where price makes a new high but volume does not confirm it, is one of the strongest early warning signs of a reversal.
4. Reading Candlestick Charts
Candlestick charts are the standard charting format for crypto trading. Each candle represents a specific time period and displays four data points: the open price, the close price, the high, and the low. The body of the candle shows the open-to-close range. The wicks (also called shadows) show the high and low extremes reached during that period.
Key Candlestick Patterns
Individual candles and small groups of candles form patterns with predictive value:
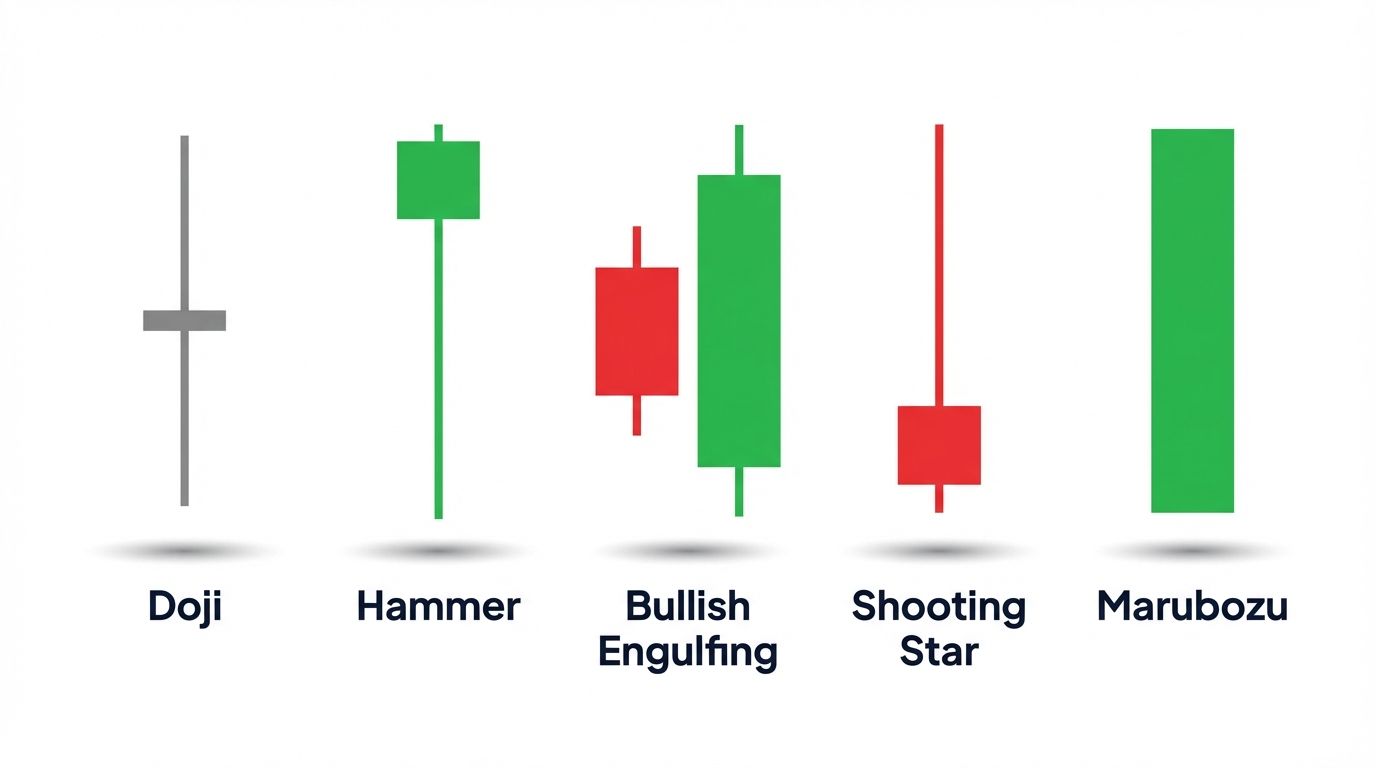
- Doji: A candle where the open and close are nearly identical, creating a very small body. It signals indecision in the market and is significant when it appears after a strong trend.
- Hammer: A candle with a small body near the top and a long lower wick, appearing at the bottom of a downtrend. It suggests buyers pushed price back up after sellers initially drove it lower, a potential reversal signal.
- Engulfing patterns: A bullish engulfing candle is a large green candle that fully engulfs the previous red candle. A bearish engulfing candle is the reverse. Both are high-probability reversal signals when they occur at key support or resistance levels.
- Shooting star: The mirror image of the hammer, with a long upper wick and small body near the bottom. It signals rejection of higher prices at the top of an uptrend.
- Marubozu: A candle with no wicks at all, meaning price opened at one extreme and closed at the other. A green marubozu indicates strong, uninterrupted buying pressure. A red marubozu signals dominant selling pressure.
Candlestick patterns gain reliability when they appear at significant price levels, such as previous support or resistance zones, major moving averages, or trend line touches. A pattern appearing in the middle of a range with no context carries far less weight.
5. Building a Technical Analysis Trading Strategy
Understanding individual concepts and indicators is necessary, but the real skill in technical analysis is combining them into a coherent trading strategy. A strategy defines your rules for entering trades, managing risk, and exiting positions. Without rules, even the best chart reading becomes reactive and inconsistent.
Define Your Timeframe
Technical analysis works across all timeframes, from one-minute scalping charts to weekly swing trading views. Your chosen timeframe should match your available time and trading style. A day trader might focus on the 15-minute and 1-hour charts. A swing trader works primarily with the 4-hour and daily charts. Always check a higher timeframe first to understand the broader market context before zooming in to find your entry.
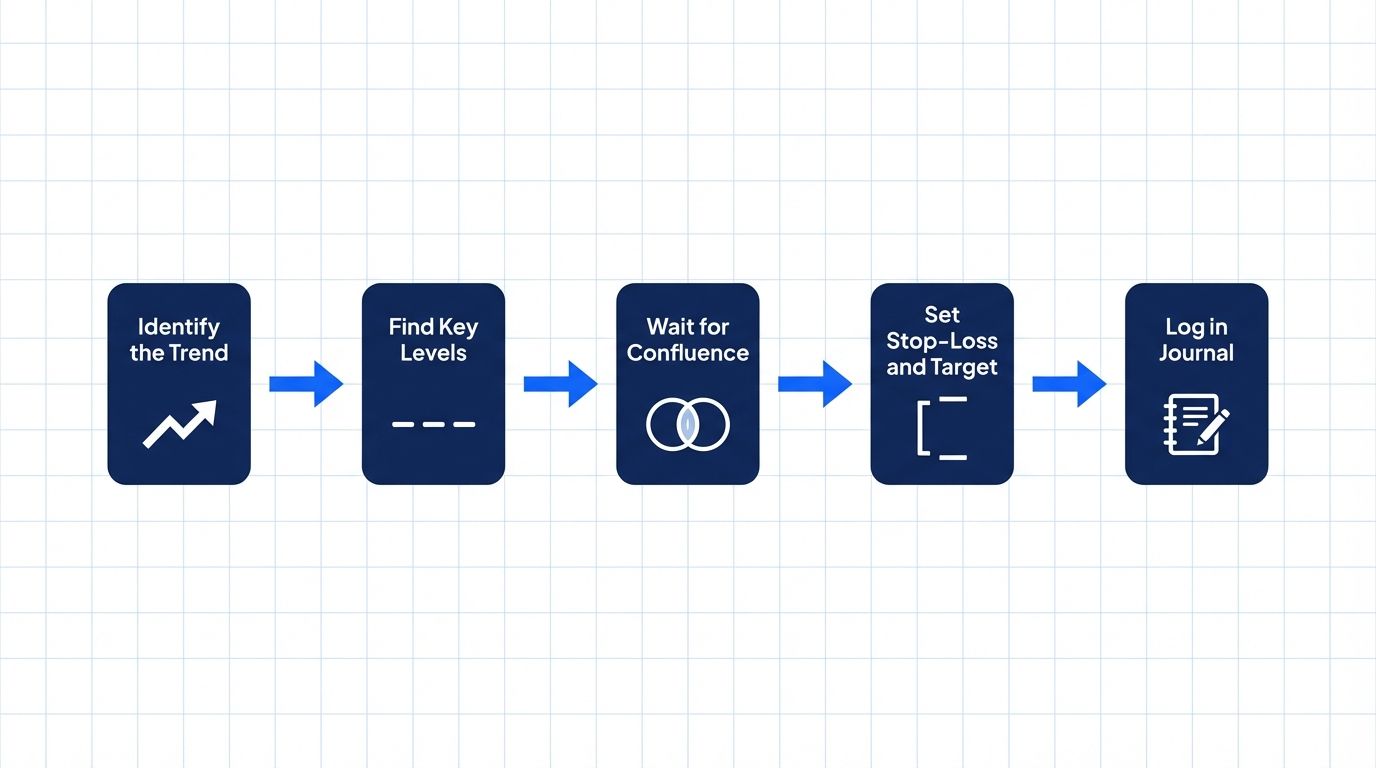
Identify the Trend Before Doing Anything Else
The first question any TA-based trade should answer is: what is the direction of the dominant trend on my target timeframe? Trading in the direction of the trend dramatically improves win rates. Use moving averages or a simple analysis of market structure (higher highs and higher lows for uptrends, lower highs and lower lows for downtrends) to answer this question before looking for entries.
Look for Confluence
Confluence means multiple signals aligning at the same price level or at the same time. For example, price reaching a major resistance level while RSI enters overbought territory while MACD shows bearish divergence is a far stronger signal than any one of those factors in isolation. The more signals that agree, the higher the probability of the expected outcome.
Set Your Risk Parameters Before Entering
Before entering any trade, you should know exactly where your stop-loss will be placed and what your profit target is. A standard risk management principle is risking no more than 1 to 2 percent of your total trading capital on any single trade. Divide your expected profit by your maximum loss to calculate your risk-reward ratio. Aim for setups with a minimum ratio of 2:1, meaning you stand to gain at least twice what you risk losing.
Keep a Trading Journal
A trading journal records every trade, including the setup rationale, entry and exit prices, indicators used, and the outcome. Reviewing your journal weekly reveals patterns in your decision-making: which setups work most reliably for you, at which times you tend to make emotional decisions, and whether your risk management is being followed consistently. This habit separates developing traders from professionals.
6. How Altrady Supercharges Your Technical Analysis Workflow
Reading charts manually on a standard exchange interface is limiting. Professional traders use dedicated platforms that bring together all the tools needed for technical analysis in one place, with speed and efficiency that a basic exchange UI cannot match. Altrady is built specifically for this purpose.
Altrady connects to all major crypto exchanges through a single dashboard, so you can analyze charts, monitor positions, and execute trades across multiple accounts without switching tabs. The platform includes a fully equipped charting suite with all the indicators covered in this guide, customizable alerts that notify you when price reaches a key level or when an indicator crosses a threshold, and advanced order types including trailing stops, scaled orders, and bracket orders that let you automate your exit strategy the moment you enter a trade.
For traders building rules-based strategies, Altrady's signal center aggregates alerts from your charts and lets you act on them with a single click. You set the conditions, Altrady watches the markets around the clock, and you execute when your setup triggers. No more watching screens all day waiting for a level to be hit.
Whether you are a new trader learning to read your first RSI signal or an experienced scalper running multi-exchange strategies, Altrady gives you the environment to execute technical analysis with precision. Start your free trial today and see how the right platform changes the way you trade.
Frequently Asked Questions
Is technical analysis reliable for crypto trading?
Technical analysis is a probability-based framework, not a guarantee. It identifies patterns and signals that have historically preceded certain price outcomes, but no signal is correct 100 percent of the time. The reliability of TA in crypto is reasonable for liquid assets like Bitcoin and Ethereum, where large amounts of trading data create consistent, well-defined patterns. For smaller, lower-liquidity tokens, TA becomes less reliable because a single large order can override any technical setup. The key is using TA with proper risk management so that losing trades stay small.
What is the best indicator for crypto technical analysis?
There is no single best indicator. Different indicators measure different things: RSI measures momentum, moving averages show trend direction, Bollinger Bands reflect volatility, and volume confirms price moves. The most effective approach is to use two or three indicators that complement each other rather than duplicate the same information. A common starter combination is a trend-following indicator like a moving average, a momentum indicator like RSI, and volume. These three together give you trend context, momentum readings, and confirmation, covering the main dimensions of technical analysis without cluttering your chart.
How is technical analysis different from fundamental analysis in crypto?
Fundamental analysis evaluates the intrinsic value of an asset by studying the project behind it: the team, the tokenomics, the technology, the adoption metrics, and the competitive landscape. Technical analysis ignores all of that and focuses only on price and volume data. Many professional crypto traders use both: fundamental analysis to decide which assets to trade, and technical analysis to decide when to enter and exit those positions. The two approaches are complementary rather than mutually exclusive.
Can technical analysis work on all crypto timeframes?
Yes. The same patterns and indicators that appear on a daily chart also appear on a 5-minute chart. The underlying principle is the same: price behavior reflects the collective psychology of market participants, and that psychology creates consistent, repeatable patterns regardless of timeframe. However, lower timeframes generate more noise and false signals. Beginners are generally better served starting with the 4-hour or daily chart, where signals are cleaner and there is more time to analyze and respond. As skills develop, shorter timeframes become more accessible.
How long does it take to learn technical analysis for crypto?
You can learn the foundational concepts of technical analysis in a few weeks of focused study. Understanding support and resistance, basic candlestick patterns, and one or two indicators is enough to begin paper trading (practicing without real money). Becoming consistently profitable through TA typically takes longer, often several months to a year of active trading with a journal, because the real skill comes from learning how your chosen setups behave in live market conditions and how to manage your own decision-making under pressure. Reading is the starting point. Deliberate practice in real market conditions is where understanding actually develops.