Welcome, Swing Traders. Have you ever experienced the ultimate market frustration where your perfectly placed stop-loss gets hit, and then the price immediately reverses and shoots toward your original target? It feels like the market makers are watching your specific screen, plotting to take your money before letting the asset pump. The reality is, they are not watching you specifically, but they are absolutely hunting for areas where thousands of retail traders have placed their orders.
This frustrating phenomenon is not just bad luck. It is a highly calculated market mechanic. If you want to stop being the fuel for massive institutional moves and start trading alongside the big players, you need to understand exactly what is a liquidity sweep in trading. In this article, we will break down the mechanics behind these market sweeps, why they happen constantly in the crypto markets, and how you can spot them on your charts to optimize your entries.
The Core Mechanics Behind a Liquidity Sweep
To answer the question of what is a liquidity sweep in trading, you first have to understand how massive institutions, often referred to as "smart money" or whales, operate. When a retail trader wants to buy $1,000 worth of Bitcoin, they simply click a button and the order is filled instantly. However, when an institution wants to buy $100 million worth of an asset, they cannot just click "buy." If they did, there would not be enough sellers at that exact price, causing massive slippage and ruining their average entry price.
The need for massive counter-orders is the driving force behind a liquidity sweep. To buy a massive amount of crypto without spiking the price, whales need a massive amount of people willing to sell. Where do they find all these sellers? Right below major support levels, where retail traders have placed their stop-loss orders.
Triggering the cascade is the execution phase. Smart money will intentionally push the price just below a strong support level. This triggers all the retail stop-losses (which are sell orders) and tricks breakout traders into opening short positions (more sell orders). Suddenly, a massive pool of sell liquidity floods the market. The whales step in, absorb all those sell orders with their massive buy orders, and the price instantly reverses upward. This entire sequence is the definition of a liquidity sweep.
Visual Clues to Spot a Sweep on Your Chart
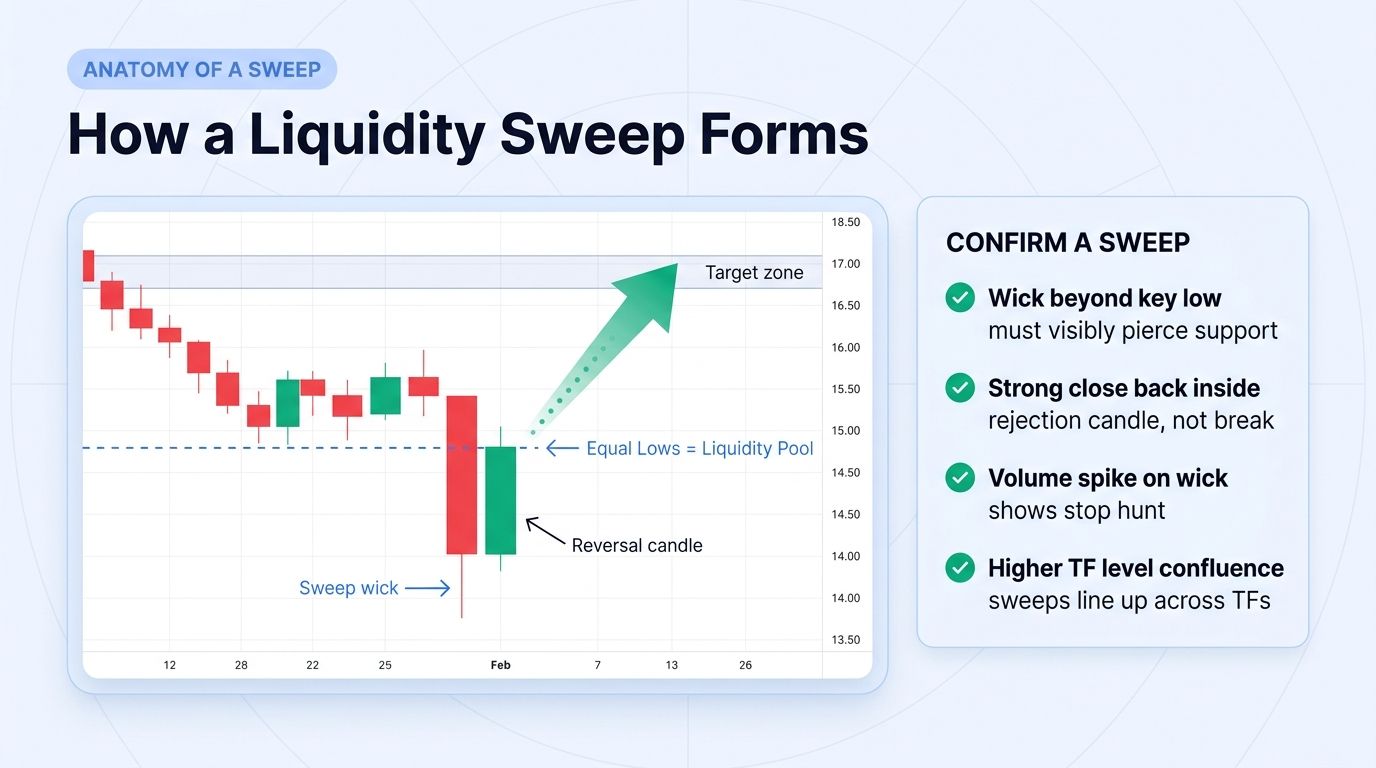
Recognizing a liquidity sweep in real-time can save your portfolio from unnecessary losses and provide incredible entry opportunities. A sweep leaves a very specific footprint on the candlestick chart. You just need to know what to look for when analyzing the price action.
Obvious zones of interest are your starting point. Look at your chart and identify the very obvious swing highs and swing lows. These are the areas where retail traders place their stop-losses. If an area looks "too perfect" as a support or resistance line, it is likely a prime target for a sweep.
The long rejection wick is the ultimate telltale sign. When a sweep happens, you will see a candlestick pierce aggressively through the support or resistance level. However, because the big players are absorbing all the orders and reversing the direction, the candle will not close outside of the range. Instead, it will snap back quickly, leaving behind a long wick (or tail) that poked through the level, with the candle body closing safely back inside the established range.
Why You Keep Falling for the Trap
The reason the liquidity sweep is so effective is that it plays perfectly into standard retail trading education. Most basic trading courses teach you to put your stop-loss just a few pips below a support line or right above a resistance line. While this sounds like logical risk management, it creates heavily concentrated pools of liquidity that market makers can easily target.
The breakout illusion is another psychological trap. When the price violently breaks a support level, retail traders panic. Those who are long will sell to cut their losses, and aggressive traders will jump in to short the market, anticipating a massive dump. This intense emotional reaction provides the exact liquidity the whales need to fill their large positions at a discount. By the time retail realizes it was a fakeout, the smart money has already reversed the trend, leaving latecomers trapped in losing positions.
Actionable Strategies to Trade the Sweep
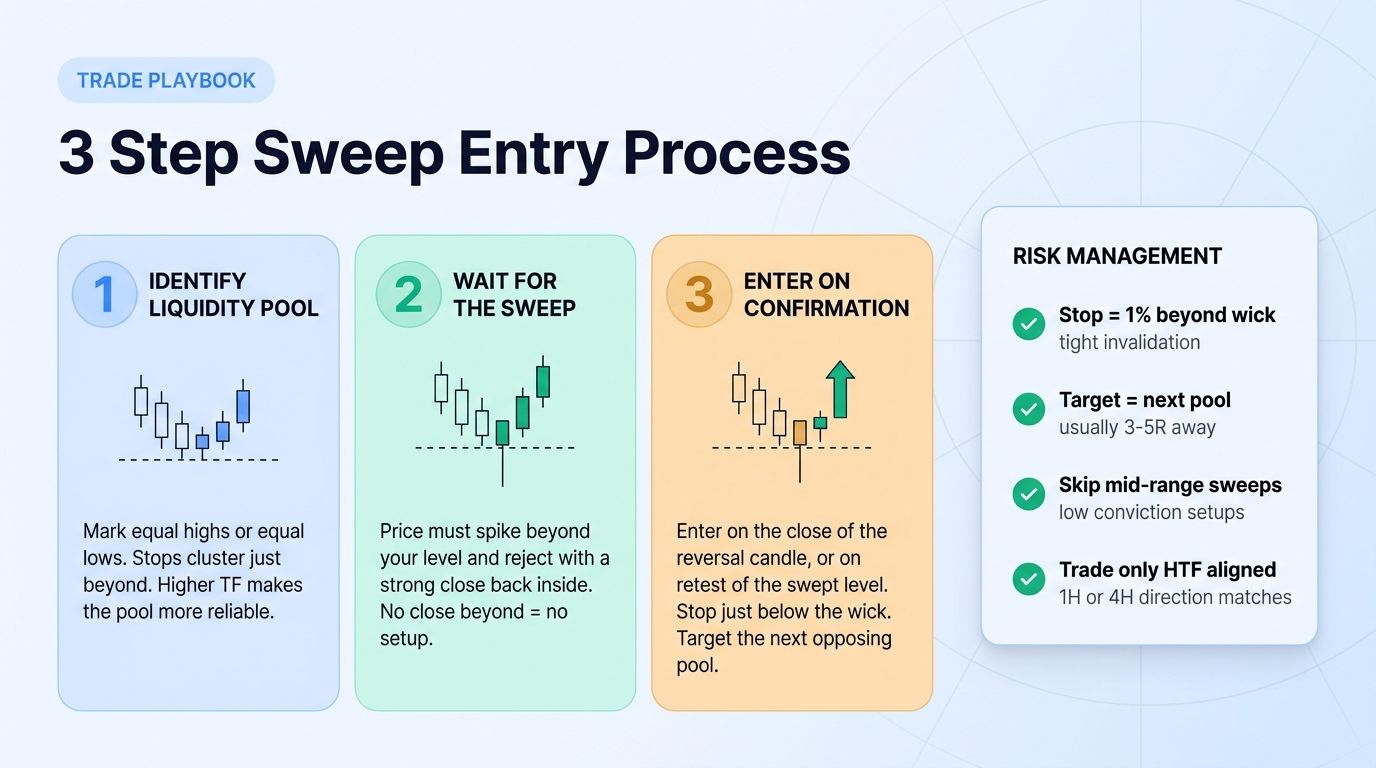
Now that you know what is a liquidity sweep in trading, the goal is to stop being the victim and start trading like the predator. Trading sweeps requires patience, discipline, and a solid understanding of price action confirmation.
Wait for the candle close before making any decisions. This is the golden rule of trading sweeps. Never try to catch the falling knife while the price is breaking a key level. Let the 1-hour or 4-hour candle finish forming. If it closes back inside the range, leaving a long wick behind, you have your confirmation that a sweep just occurred.
Enter on the reversal once the trap is confirmed. If the price sweeps the lows and closes back above support, you can enter a long position. Your stop-loss can now be safely placed just below the tip of the new wick created by the sweep. Since the liquidity has already been taken, the chances of the price returning to that exact depth immediately are statistically much lower.
Leverage advanced trading tools to manage your position. Sweeps happen incredibly fast, especially in the volatile crypto markets. By utilizing smart trading platforms, you can set up advanced parameters like trailing stops to lock in profits as the price reverses, or use automated grid bots to capitalize on the rapid volatility that follows a sweep.
Frequently Asked Questions About Liquidity Sweeps
Q: What is the main difference between a liquidity sweep and a breakout?
A: The key difference lies in the candle close. A valid breakout sees the candle body closing firmly past a support or resistance level, indicating continued momentum. A liquidity sweep, however, pierces the level but closes back inside the previous range, typically leaving a long wick behind.
Q: Which timeframe is best to spot liquidity sweeps?
A: While sweeps happen on all timeframes, for Swing Traders, the 4-hour (4H) and Daily (1D) charts offer the most reliable signals. Higher timeframes generally filter out market noise and provide stronger confirmation of smart money activity compared to lower timeframes like the 5-minute chart.
Q: Is a liquidity sweep the same thing as a "stop hunt"?
A: Yes, the terms are often used interchangeably. A "stop hunt" describes the intent (institutions hunting for retail stops), while a "liquidity sweep" describes the mechanical action on the chart. Both result in the absorption of orders to fuel a move in the opposite direction.
Q: Can I trade liquidity sweeps using automated tools?
A: Absolutely. You can use Altrady to set alerts when the price crosses a key level and then quickly reverses. You can also configure signal bots to execute trades based on specific candlestick reversal patterns automatically, ensuring you don't miss the move while you sleep.
Q: Why do sweeps mostly happen at support and resistance levels?
A: These levels are psychological barriers where the majority of retail traders cluster their stop-loss orders. Institutions target these specific zones because they provide the deep liquidity needed to fill massive buy or sell orders without causing excessive price slippage.
Trading the crypto market is a constant battle of psychology and liquidity. By understanding what is a liquidity sweep in trading, Swing Traders can completely shift their perspective. Instead of fearing market fakeouts, you can begin to anticipate them. Mark your charts, identify where the liquidity rests, and patiently wait for the smart money to make their move before you execute yours.
Ready to trade smarter and manage your risk with precision? Sign up for a free trial of Altrady today and explore our advanced Smart Trading features to automate your entries, set up trailing stops, and outsmart the market traps!