Swing Traders, SMT divergence is one of those concepts that sounds advanced at first, but the core idea is surprisingly simple once you see it on a chart. Instead of looking at one market in isolation, SMT divergence asks you to compare two related markets and pay attention to where their behavior stops matching.
That mismatch can matter because strong moves often leave clues before they fully unfold. When one asset makes a new high or low while a related asset fails to do the same, the market may be signaling weakening momentum, a possible shift in direction, or at least a warning that the current move is not as clean as it looks.
What is SMT divergence in trading?
SMT divergence in trading refers to a mismatch between two correlated or related markets when they fail to make matching highs or lows. In simple terms, if one market pushes to a new extreme while another similar market does not confirm that move, traders treat that divergence as a clue that the current move may be losing strength or setting up a reversal.
The concept is built on comparison. Rather than asking only what one chart is doing, SMT divergence asks whether a related chart is confirming the same story. When the answer is no, that imbalance can reveal hidden weakness, hidden strength, or a possible liquidity-driven move that is not fully supported across the broader market.
What does SMT stand for?
SMT is commonly understood as “Smart Money Technique” in trading education, especially in price action and liquidity-based trading circles. In practice, though, the important part is not the label itself but the method: comparing two related markets to find non-confirmation.
That is why the idea remains useful even if traders use slightly different terminology around it. The real edge does not come from the acronym. It comes from learning how to recognize when one market is making a move that another closely related market is failing to confirm.
How SMT divergence works?
SMT divergence works by comparing two markets that usually move in a similar direction, then looking for a point where that correlation temporarily breaks down. When one chart makes a higher high and the other fails to do the same, or when one makes a lower low and the other does not, traders read that as a signal that the current move may not be as strong or as balanced as it appears.
The reason this matters is that correlated markets often confirm each other during healthy trend continuation. When they stop doing that, the divergence can hint that liquidity is being taken in one market, that one move is becoming overextended, or that a reversal may be developing. It is not a signal on its own, but it is a strong contextual clue.
Bullish SMT divergence vs bearish SMT divergence
SMT divergence can point in either direction, depending on where the mismatch appears and how price reacts afterward. The structure is similar in both cases, but the implication changes.
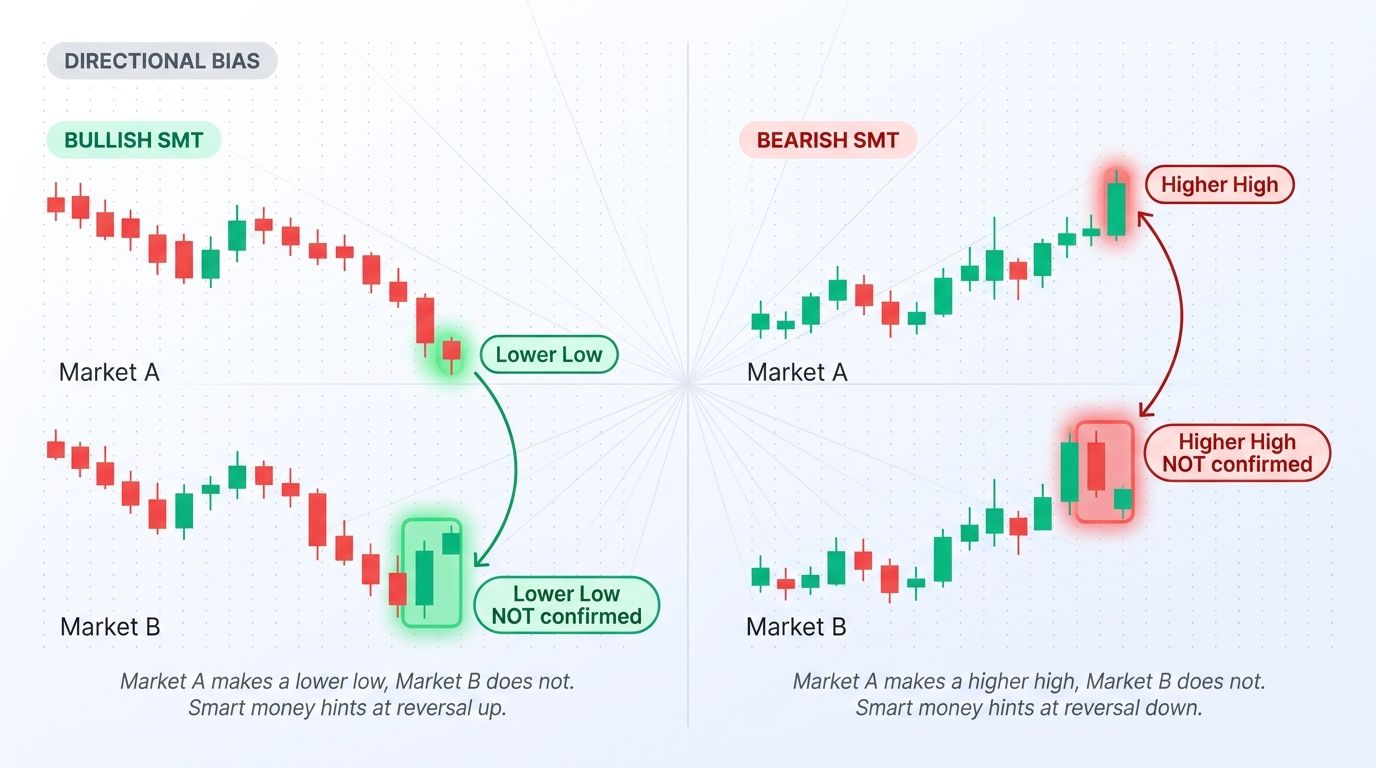
Bullish SMT divergence
Bullish SMT divergence appears when one market makes a lower low, but the related market fails to make a matching lower low. This can suggest that downside momentum is weakening and that sellers are not fully in control across both markets.
In practice, traders often look for this when price sweeps a low in one asset while a correlated asset holds above its corresponding low. That kind of non-confirmation can create a strong case for a rebound, especially if it happens near a major support area or after a liquidity sweep.
Bearish SMT divergence
Bearish SMT divergence appears when one market makes a higher high, but the related market fails to make a matching higher high. This can suggest that upside momentum is weakening and that buyers are no longer pushing both markets in sync.
This setup often gets attention when one market runs above an obvious high while the other falls short. If price then rejects that new high, the divergence can become an early warning that the move was more about taking liquidity than building a sustainable continuation.
Which markets are commonly used for SMT divergence?
SMT divergence works best when the two markets you compare are meaningfully related. If the relationship is weak or inconsistent, the comparison becomes noisy and the divergence loses value.
Common pairs traders compare include:
• BTC and ETH
• ES and NQ
• DXY and risk assets
• two highly correlated forex pairs
• related indices or sector instruments
The key is not to compare random charts. The stronger and more consistent the normal relationship between the two markets, the more useful a temporary divergence becomes.
How to identify SMT divergence on a chart?
To identify SMT divergence, you first need two charts that are normally correlated. Then you compare their highs or lows around the same timeframe and ask whether both charts are confirming the move.
A practical checklist looks like this:
• choose two related markets
• mark the recent swing highs and swing lows
• check whether one market made a new extreme
• check whether the other market failed to confirm
• wait for reaction and confirmation before acting
This process sounds simple, but the quality of the level matters. Swing Traders should focus on obvious highs and lows, not tiny internal moves that can create false comparisons and clutter the read.
Why SMT divergence matters?
SMT divergence matters because it adds context that a single chart cannot give you on its own. One chart may look like a clean breakout or breakdown, but once you compare it with a related market, you may realize the move is not being confirmed as strongly as it should be.
That extra context can help in two ways. First, it can keep you out of weak breakouts that look strong only in isolation. Second, it can help you spot reversal potential when one market is clearly taking liquidity while another refuses to follow through. In both cases, the divergence does not replace execution rules, but it can improve the quality of your decision-making.
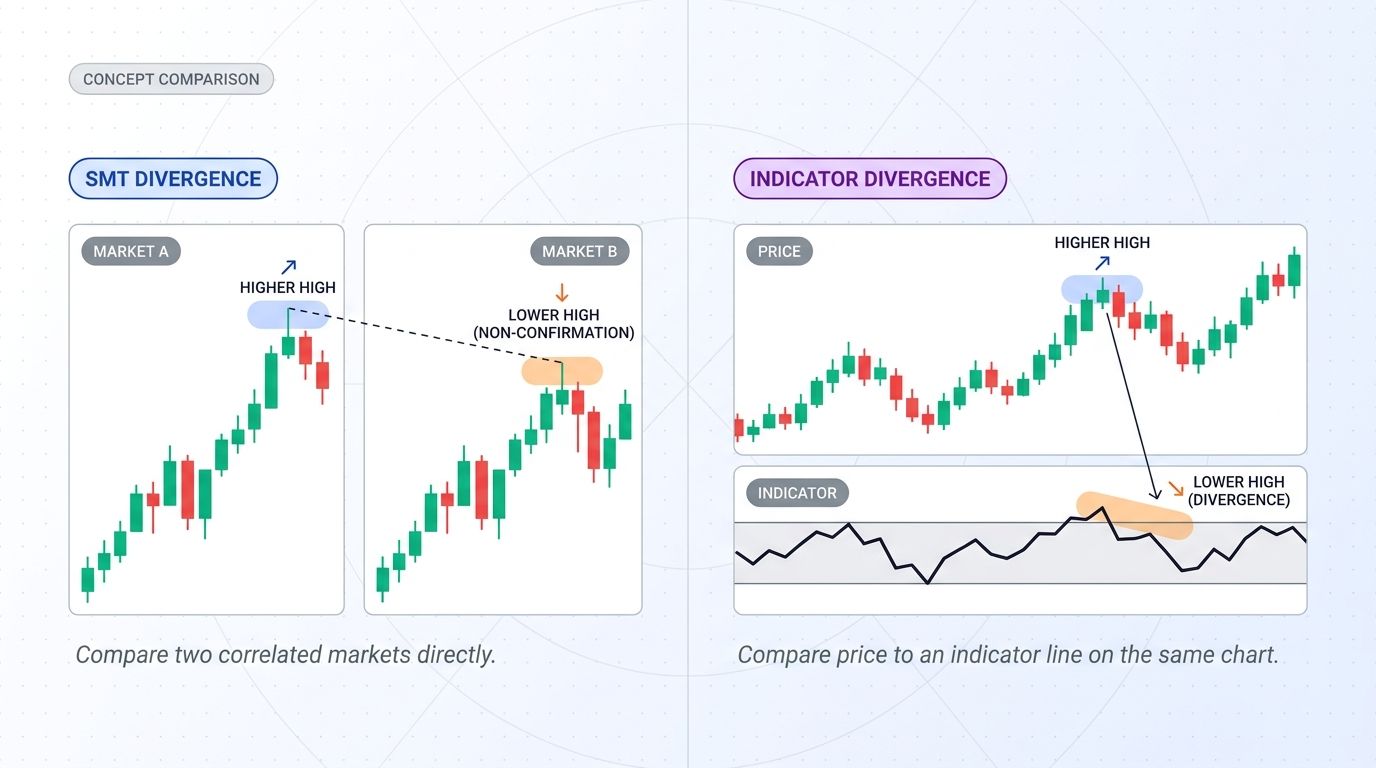
SMT divergence vs regular indicator divergence?
SMT divergence is different from indicator divergence because it compares price behavior between two markets, not price behavior against an indicator such as RSI or MACD. Indicator divergence asks whether momentum indicators are confirming price. SMT divergence asks whether a related market is confirming price.
That difference makes SMT divergence more context-based and more market-structure-driven. It is often used alongside price action, liquidity, and correlation analysis, whereas indicator divergence is usually focused on internal momentum readings within one chart. Both can be useful, but they answer different questions.
How to trade SMT divergence?
The safest way to use SMT divergence is to treat it as a contextual filter, not as a standalone entry trigger. The divergence tells you that something may be shifting, but the actual trade still needs structure, confirmation, and risk control.
A better approach is to use SMT divergence to narrow your focus, then wait for the market to prove the idea through price action. That process is slower than reacting immediately, but it is far more repeatable and helps separate good setups from clever-looking guesses.
Step 1: Find two correlated markets
Start by choosing two markets that usually move together or at least respond to similar macro conditions. This matters because SMT divergence only has value when there is a meaningful relationship to break.
The cleaner the normal correlation, the clearer the divergence becomes when it appears. If you use unrelated assets, the mismatch may not mean anything at all.
Step 2: Mark the relevant highs or lows
Once the markets are selected, mark the obvious recent swing highs or swing lows on both charts. These are the reference points you will compare.
The more obvious the level, the more useful the read tends to be. If you are comparing insignificant internal candles, you are more likely to manufacture divergence than discover something meaningful.
Step 3: Look for non-confirmation
Now compare the two charts directly. If one market takes a higher high or lower low and the other fails to do the same, you have the basic structure of SMT divergence.
That alone is not enough to trade. What matters next is whether the market reacts in a way that supports the idea, such as rejecting the new extreme, reclaiming structure, or failing to continue.
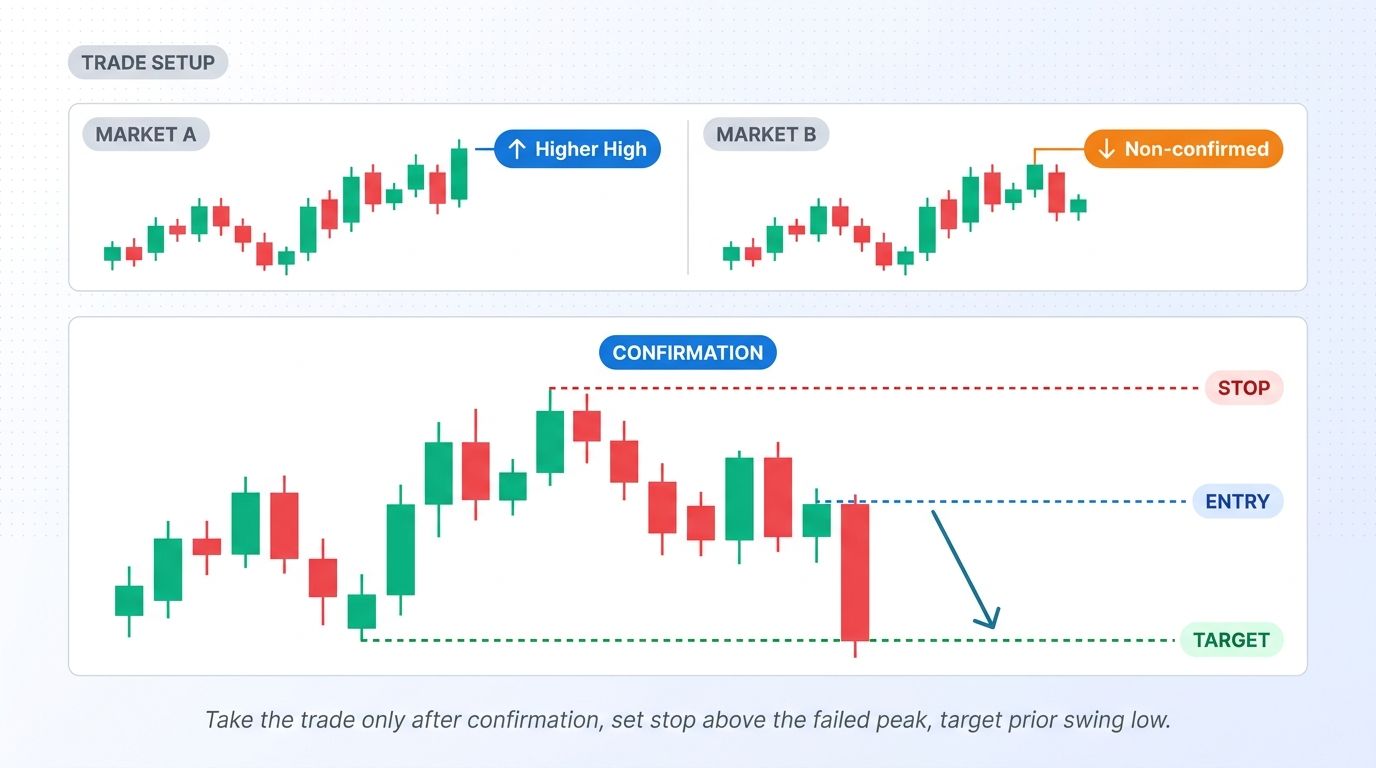
Step 4: Wait for confirmation
Confirmation can come in several forms: a strong rejection candle, a reclaim of a level, a break of short-term structure, or a retest failure after the divergence appears. The exact method can vary, but the principle stays the same.
Swing Traders should avoid entering just because the divergence exists. The better trade usually comes after the market proves that the non-confirmation is actually translating into a change in price behavior.
Step 5: Define stop and target logically
The stop should go where the trade idea is clearly invalidated, which often means beyond the swept high or low, beyond the rejection wick, or beyond the structural point that must hold for the setup to remain valid.
Targets can be based on:
• nearby support or resistance
• opposing liquidity pools
• prior session highs or lows
• the next major swing level
SMT divergence is most useful when it helps you frame a setup, not when it tricks you into forcing one. Clear invalidation and realistic targets keep the trade grounded in structure rather than in hope.
Common mistakes Swing Traders make with SMT divergence
The biggest mistake is treating SMT divergence as an automatic reversal signal. A divergence can warn of weakness or imbalance, but markets can still continue if broader momentum remains strong.
Other common mistakes include:
• comparing unrelated markets
• using tiny, unclear highs or lows
• entering before confirmation
• ignoring higher timeframe context
• forcing divergence where none exists
Most of these mistakes come from trying to use SMT divergence as a shortcut. In reality, it works best as a layer of context that improves your existing process, not as a replacement for structure, patience, and execution discipline.
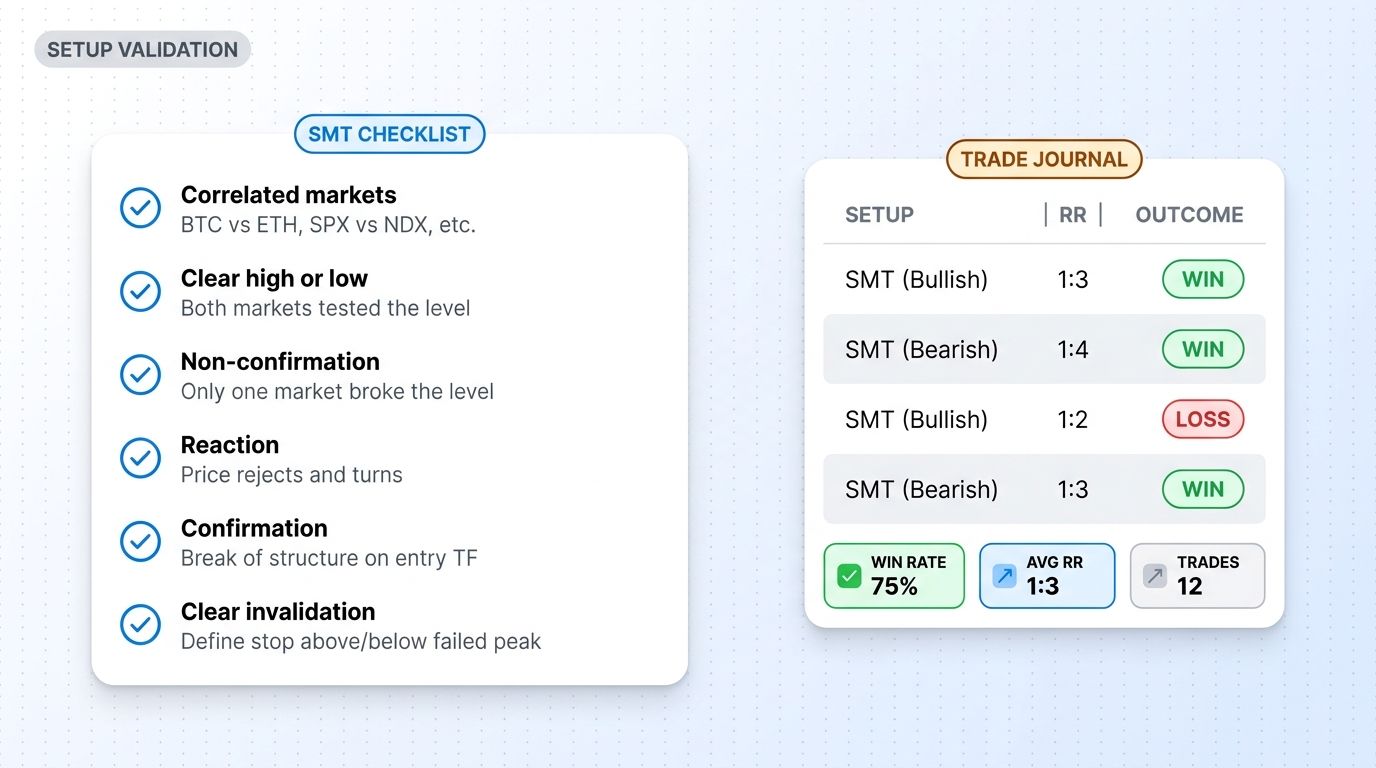
A simple SMT divergence checklist
A checklist helps keep SMT divergence objective, especially because chart comparison can become highly subjective if you stare at it too long. The goal is to make the setup easier to validate and easier to reject when the structure is weak.
Checklist:
• Are the two markets meaningfully correlated
• Is the high or low obvious on both charts
• Did one market take liquidity while the other failed to confirm
• Is there a clear reaction after the divergence
• Is confirmation present before entry
• Is invalidation clear and reasonable
If several answers are no, the setup is probably not ready or not worth taking. A clean divergence at a meaningful level is worth far more than a forced setup built on weak comparison.
Using SMT divergence in an Altrady workflow
A structured workflow makes SMT divergence much easier to use consistently because you can separate the analytical part from the execution part. The goal is to compare markets, mark key levels, set alerts, and then wait for confirmation instead of reacting emotionally in real time.
A practical process looks like this:
1. Build a watchlist of correlated markets you follow regularly.
2. Mark the obvious highs and lows on both charts.
3. Watch for one market to take an extreme while the other fails to confirm.
4. Set alerts around the level that matters for confirmation.
5. Record the setup and result in a crypto journal with notes and screenshots.
This kind of workflow reduces overtrading and improves review quality because it turns a subtle concept into a repeatable process. Instead of “feeling” the divergence, you can track when it appears, how price reacts, and whether your execution rules were actually followed.
Reviewing SMT divergence setups in a journal
A journal is what turns SMT divergence from an interesting chart concept into a process you can actually improve. Once you start recording which divergences worked, which ones failed, and what the price reaction looked like, patterns become easier to trust or reject based on evidence instead of memory.
What matters most is consistency. If you journal the same details every time, such as which two markets were compared, where the divergence formed, what confirmation was used, and whether the trade respected the original plan, your review becomes much more useful over time.
FAQ about SMT Divergence in Trading
What is SMT divergence in trading?
SMT divergence in trading is a mismatch between two related markets when one makes a new high or low and the other fails to confirm that move. Traders use that non-confirmation as a clue that momentum may be weakening or that a reversal may be developing.
The concept becomes more useful when it is applied to obvious highs and lows in correlated markets. On its own, it is a contextual clue, not a complete trade signal.
Is SMT divergence bullish or bearish?
It can be either, depending on the structure. Bullish SMT divergence usually appears when one market makes a lower low and another fails to confirm, while bearish SMT divergence appears when one market makes a higher high and another fails to confirm.
What matters most is the reaction after the divergence forms. The direction becomes actionable only when price confirms the idea through structure or rejection.
Is SMT divergence the same as RSI divergence?
No. RSI divergence compares price to an indicator, while SMT divergence compares price behavior between two related markets.
That makes SMT divergence more focused on correlation and market structure. RSI divergence and SMT divergence can complement each other, but they are not the same tool.
Risk disclaimer
Trading is risky. Losses can happen quickly in volatile markets, and SMT divergence is not a guarantee of reversal or profit. Swing Traders, use position sizing, predefined stops, and testing before allocating meaningful capital. Start a free trial on Altrady to compare markets, set alerts at key levels, and track SMT divergence setups in a more structured workflow.