The Wyckoff Method is a technical analysis approach developed by Richard D. Wyckoff in the early 1930s. Originally designed for stock markets, it has become one of the most respected frameworks for understanding market structure and price movements. The method focuses on the relationship between price, volume, and time to identify high-probability trading opportunities.
At its core, the Wyckoff Method is built on the idea that markets are driven by the actions of large institutional players, often referred to as "smart money" or "composite operators." These entities accumulate and distribute assets in predictable patterns that retail traders can learn to recognize. By studying these patterns, traders can align their positions with the dominant market force rather than trading against it.
In the cryptocurrency market, where volatility is high and whale activity can move prices significantly, the Wyckoff Method has gained renewed popularity. It provides a structured way to interpret the often chaotic price action seen on crypto charts.
The Three Wyckoff Laws
The Wyckoff Method is built on three fundamental laws that govern market behavior. Understanding these laws is essential for applying the method effectively in any market, including crypto.
The Law of Supply and Demand
This is the most basic law and states that prices rise when demand exceeds supply and fall when supply exceeds demand. While this seems obvious, the Wyckoff Method provides tools to measure the actual balance between buyers and sellers using price spreads and volume. When volume increases on up moves and decreases on down moves, demand is in control. The reverse indicates supply dominance.
The Law of Cause and Effect
This law states that every price movement (effect) must have a preceding cause. In Wyckoff terms, the "cause" is the accumulation or distribution range, and the "effect" is the subsequent trend. The longer and wider the trading range, the greater the potential price move that follows. Traders use Point and Figure charts to measure the cause and project potential price targets.
The Law of Effort vs. Result
This law compares volume (effort) with price movement (result). When effort and result are in harmony, the current trend is likely to continue. When they diverge, a trend change may be approaching. For example, if Bitcoin shows high volume but fails to make meaningful price progress, it suggests that the current move is losing momentum and a reversal could be near.
Wyckoff Market Cycle: The Four Phases
 The four phases of the Wyckoff Market Cycle
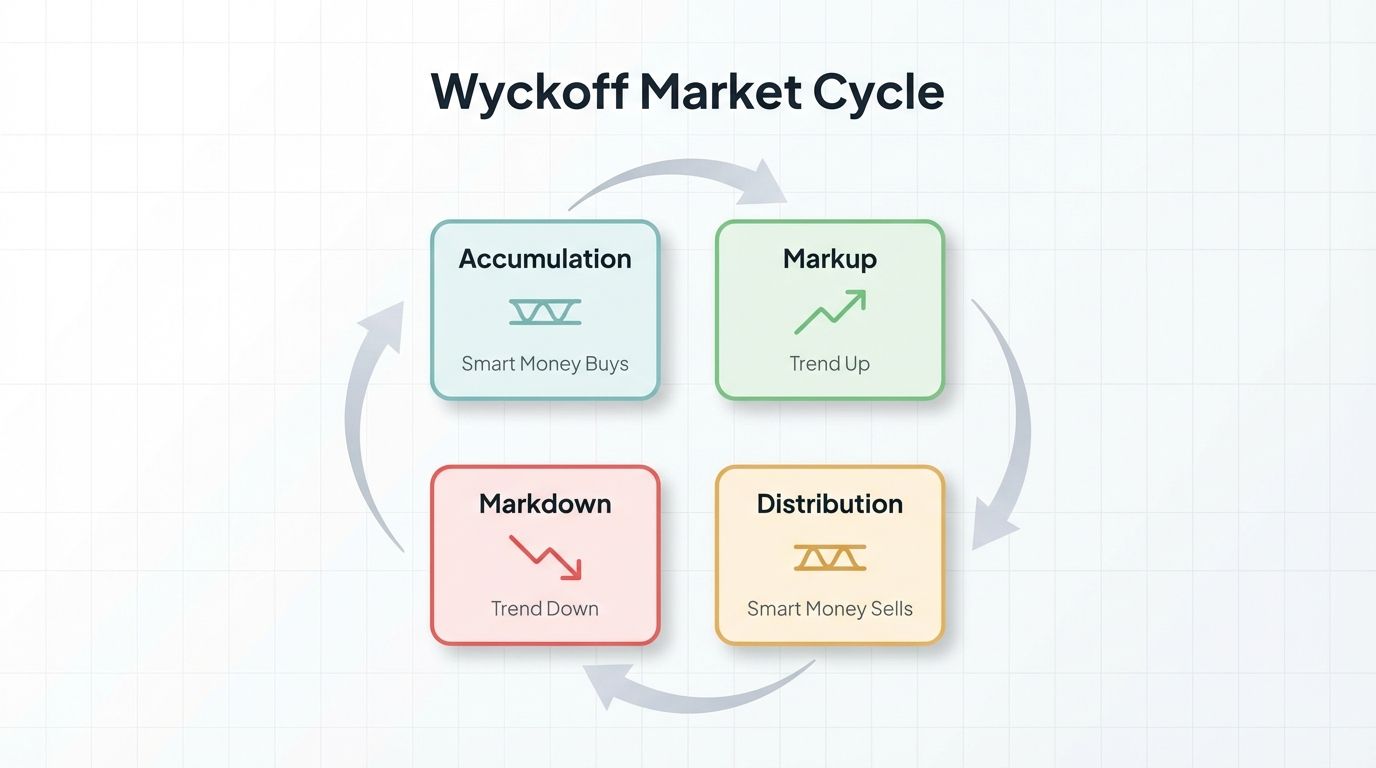
According to Wyckoff, markets move through four distinct phases that repeat in a continuous cycle. Recognizing which phase the market is currently in helps traders make better decisions about entries, exits, and position sizing.
Phase 1: Accumulation
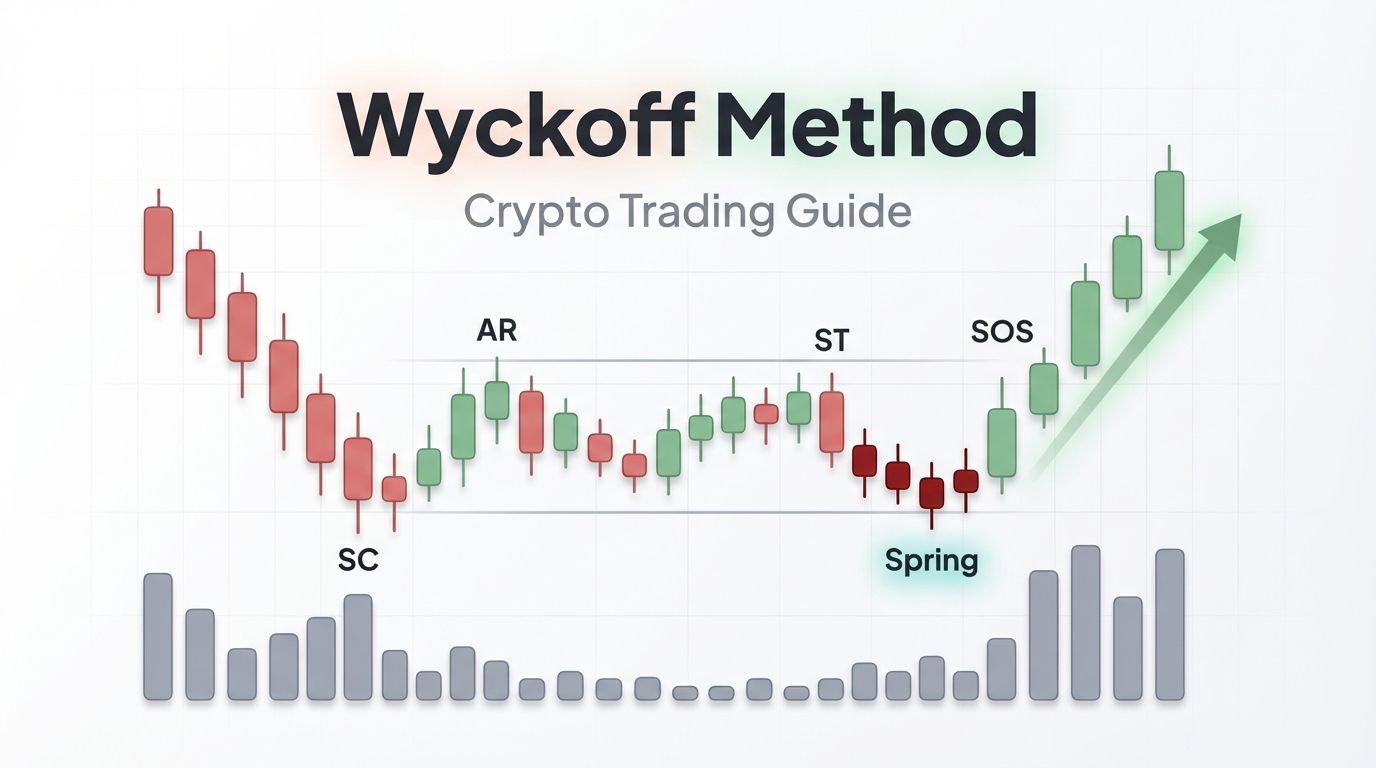
Accumulation occurs after a prolonged downtrend when large institutional investors begin quietly buying assets at discounted prices. The price action during this phase typically shows a sideways trading range with decreasing volatility. Key characteristics include:
- A preliminary support (PS) level where initial buying interest appears
- A selling climax (SC) that marks the lowest point of the range
- An automatic rally (AR) that establishes the upper boundary of the range
- A secondary test (ST) that retests the selling climax area on reduced volume
- Multiple tests of support with declining volume, showing that selling pressure is drying up
The accumulation phase can last weeks or even months in crypto markets. Patient traders who identify this phase early can position themselves before the markup begins.
Phase 2: Markup
Once accumulation is complete, the markup phase begins. This is the trending phase where prices rise steadily as demand continues to outpace supply. During markup, volume typically increases on rallies and decreases during pullbacks, confirming the uptrend's health.
Traders who missed the accumulation phase can still enter during markup by buying pullbacks to support levels. The key is to confirm that volume patterns remain bullish and that the pullbacks are orderly rather than climactic.
Phase 3: Distribution
Distribution is the mirror image of accumulation. After a sustained markup, large players begin selling their positions to retail traders who are buying near the top. The price action forms a trading range similar to accumulation but with different internal characteristics:
- A preliminary supply (PSY) level where the first signs of selling appear
- A buying climax (BC) that marks the highest point of the range
- An automatic reaction (AR) that establishes the lower boundary
- An upthrust (UT) or upthrust after distribution (UTAD) that briefly breaks above the range before reversing
Identifying distribution early allows traders to exit long positions and potentially prepare for short positions before the markdown phase begins.
Phase 4: Markdown
Markdown is the downtrend that follows distribution. Supply overwhelms demand and prices decline, often sharply. During this phase, rallies are met with heavy selling, and volume tends to increase on down moves. This phase continues until a new accumulation range forms at lower prices, completing the cycle.
Wyckoff Schematics Explained
 Wyckoff Accumulation Schematic: Phases A through E with key events
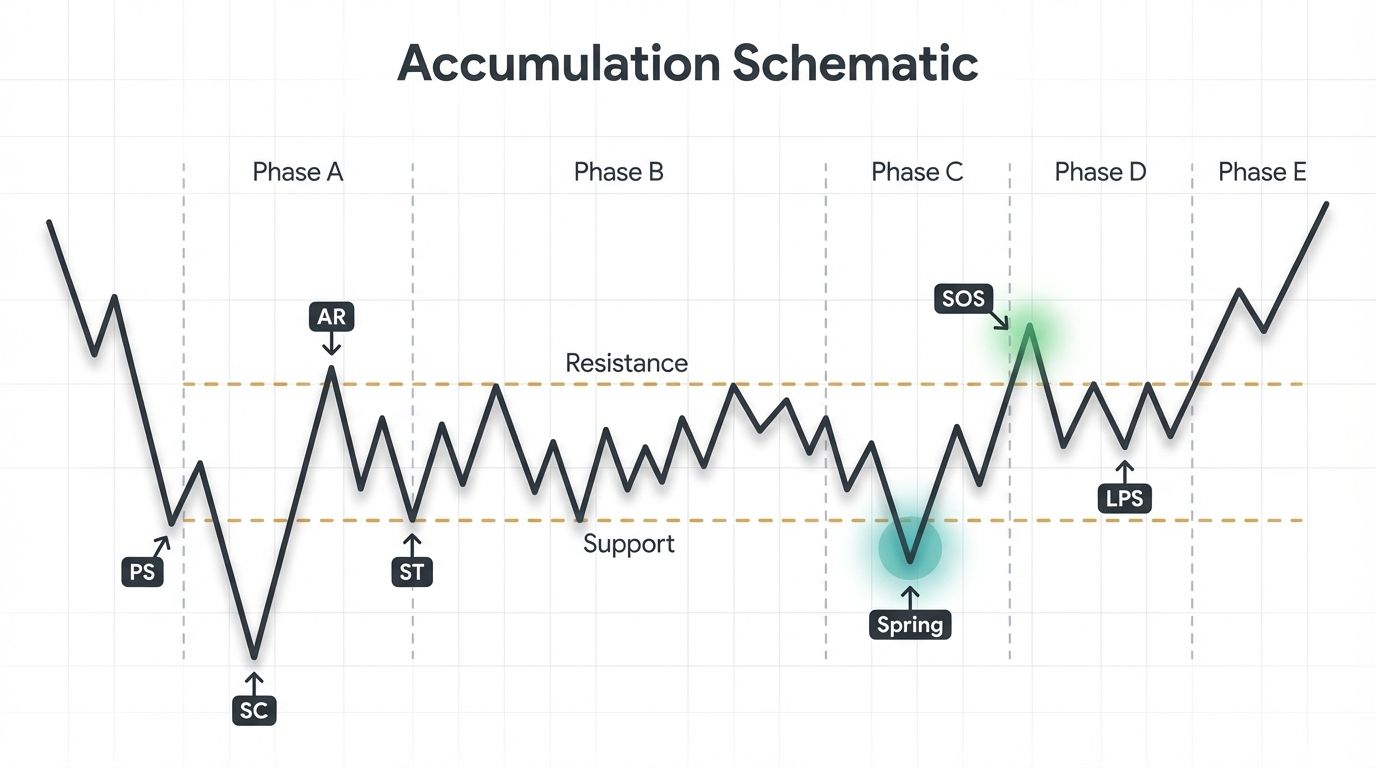
Wyckoff schematics are detailed visual maps of price action within accumulation and distribution ranges. They label specific events and phases that help traders track the progress of these ranges in real time.
Accumulation Schematic
The standard Wyckoff accumulation schematic includes several key events that occur in sequence:
Phase A marks the stopping of the previous downtrend. The selling climax (SC) creates a sharp drop on high volume, followed by an automatic rally (AR). The secondary test (ST) then confirms that selling pressure has diminished.
Phase B is the building of the cause. Price oscillates within the range established by the SC and AR. Institutional buyers are quietly accumulating positions, and the support and resistance levels within the range are tested multiple times.
Phase C contains the spring or shakeout. This is a brief dip below the trading range's support level designed to trigger stop losses and scare weak holders into selling. The spring is followed by a quick recovery back into the range. Not all accumulation ranges produce a spring, but when one occurs, it provides a high-confidence entry point.
Phase D shows the sign of strength (SOS). Price moves decisively above the range on increasing volume, confirming that demand has overcome supply. The last point of support (LPS) provides a pullback entry opportunity.
Phase E is the beginning of the markup trend. Price leaves the accumulation range and begins its sustained advance.
Distribution Schematic
The distribution schematic follows a similar structure but in reverse. Phase A stops the uptrend with a buying climax. Phase B builds the cause as institutions distribute. Phase C may include an upthrust above resistance (UTAD) to trap breakout buyers. Phase D shows signs of weakness (SOW), and Phase E begins the markdown.
How to Apply the Wyckoff Method in Crypto Trading
 5 Steps to Apply the Wyckoff Method in crypto trading
Applying the Wyckoff Method to cryptocurrency markets requires some adaptation from its traditional use in stock markets, but the core principles remain the same.
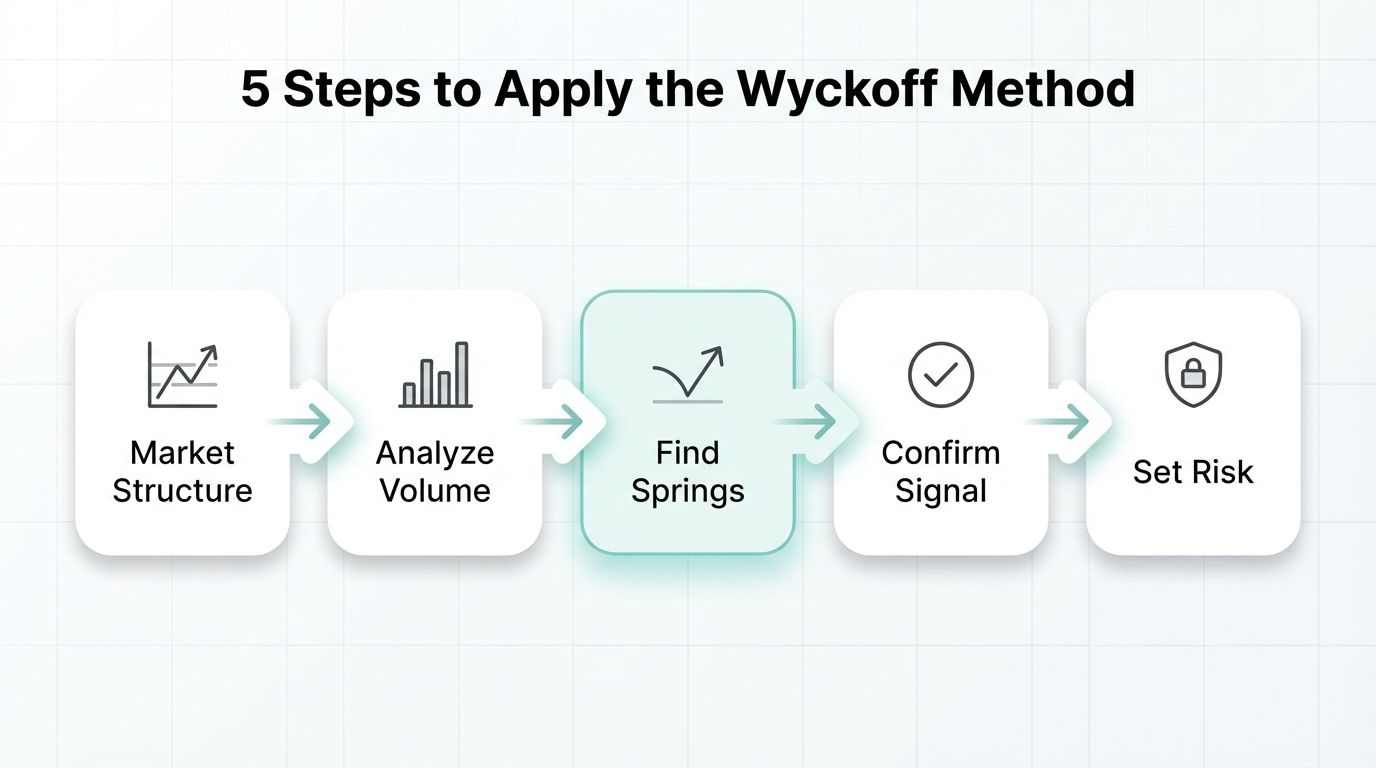
Step 1: Determine Market Structure
Before entering any trade, assess the current price action on your charts to determine which Wyckoff phase the market is in. Is the asset in a clear trend (markup or markdown), or is it consolidating in a range (accumulation or distribution)?
Step 2: Analyze Volume
Volume is central to the Wyckoff Method. Look for volume confirmation at key turning points. During accumulation, volume should decrease on tests of support. During distribution, volume should decrease on tests of resistance. Use your trading platform's volume tools to identify these patterns.
Step 3: Identify Springs and Upthrusts
Springs (in accumulation) and upthrusts (in distribution) are among the most powerful Wyckoff signals. A spring occurs when price briefly dips below a well-established support level and then quickly recovers. An upthrust breaks above resistance before failing. Both events create clear entry points with defined risk levels.
Step 4: Wait for Confirmation
After identifying a potential spring or sign of strength, wait for confirmation before entering. Look for a follow-through move in the expected direction with supporting volume. This helps avoid false breakouts that are common in crypto markets.
Step 5: Set Risk Parameters
Place stop losses below the spring low (for long trades) or above the upthrust high (for short trades). These levels represent the invalidation points for the Wyckoff setup. Use proper risk-reward ratios to ensure that potential profits justify the risk.
Wyckoff Method vs Other Technical Analysis Approaches
Understanding how the Wyckoff Method compares to other popular approaches helps traders decide when and how to use it most effectively.
Wyckoff vs Elliott Wave Theory
While both methods attempt to identify market cycles, they differ significantly in approach. Elliott Wave focuses on counting wave patterns and using Fibonacci ratios, while Wyckoff emphasizes volume analysis and the behavior of smart money. Many traders find Wyckoff more practical because it provides clearer, more actionable signals.
Wyckoff vs ICT/Smart Money Concepts
ICT (Inner Circle Trader) concepts like order blocks, fair value gaps, and liquidity sweeps share philosophical roots with the Wyckoff Method. Both approaches focus on institutional activity and liquidity. However, Wyckoff provides a more comprehensive framework for understanding the entire market cycle, while ICT concepts tend to focus on specific entry techniques.
Wyckoff vs Traditional Technical Indicators
Unlike traditional technical indicators such as RSI, MACD, or moving averages, the Wyckoff Method reads raw price and volume data directly. While indicators can complement Wyckoff analysis, relying solely on lagging indicators often means entering trades late. Wyckoff aims to identify turning points before they are confirmed by traditional indicators.
Common Mistakes When Using the Wyckoff Method
Even experienced traders can make errors when applying the Wyckoff Method. Here are the most common pitfalls to avoid:
- Forcing the schematic: Not every consolidation is a Wyckoff accumulation or distribution. Sometimes price simply chops sideways without following the textbook pattern. Be willing to step aside when the price action does not clearly match a Wyckoff structure.
- Ignoring volume: Price patterns alone are not enough. Volume confirmation is essential to validate Wyckoff events. A spring on low volume is far more reliable than one on high volume, which may indicate continued selling pressure.
- Trading too early: Entering before Phase D confirmation is a common mistake. The spring in Phase C can be tempting, but without a subsequent sign of strength, there is no guarantee that accumulation is complete.
- Neglecting the broader context: Always consider the higher timeframe trend and overall market sentiment. A Wyckoff accumulation pattern on a 1-hour chart is less significant if the daily chart is in a strong markdown phase.
- Overcomplicating the analysis: Keep your charts clean. The Wyckoff Method works best when you focus on price, volume, and key support and resistance levels rather than adding dozens of indicators.
Practical Wyckoff Trading Example in Crypto
Let us walk through a practical example of how a Wyckoff setup might develop on a Bitcoin chart:
- Identify the downtrend: Bitcoin has been declining for several weeks, creating lower highs and lower lows.
- Spot the selling climax: A sharp drop on significantly increased volume creates a capitulation low. This is the SC.
- Mark the range: The automatic rally (AR) bounces from the SC, establishing the upper boundary. You now have a defined trading range.
- Watch for the secondary test: Price returns to the SC area but on lower volume, confirming that sellers are exhausting.
- Wait for the spring: Price briefly breaks below the range on light volume, triggers stop losses, and then rapidly recovers. This is your highest probability entry point.
- Confirm with sign of strength: A strong rally on increased volume pushes price above the midpoint of the range, confirming that the spring was a shakeout and that accumulation is complete.
- Enter and manage: Enter long with a stop below the spring low. Target the top of the range initially, then look for the markup phase to develop.
This systematic approach removes much of the guesswork from trading and provides clear levels for entries, stops, and targets.
Tools for Wyckoff Analysis in Crypto
To apply the Wyckoff Method effectively, you need a trading platform that provides clean price charts with volume data. Professional crypto trading platforms like Altrady offer multi-exchange charting tools that make it easier to analyze market structure across different timeframes and trading pairs.
Key features to look for in a Wyckoff-friendly trading platform include customizable chart layouts, volume profile tools, drawing tools for marking up schematics, and alert systems that notify you when price reaches key levels. Having multiple charts open simultaneously helps you monitor different timeframes and assets for developing Wyckoff setups.
Start Applying the Wyckoff Method Today
The Wyckoff Method gives you a proven framework for reading market structure, identifying accumulation and distribution, and timing your entries with precision. To put these concepts into practice, you need a trading platform that supports multi-exchange charting, volume analysis, and real-time alerts. Altrady provides all of these tools and more. Start your free trial today and see how the Wyckoff Method can transform your crypto trading results.
Frequently Asked Questions
Is the Wyckoff Method effective for cryptocurrency trading?
Yes, the Wyckoff Method is highly effective for crypto trading because cryptocurrency markets are heavily influenced by large holders (whales) whose behavior creates the same accumulation and distribution patterns that Wyckoff identified in traditional markets. The high volatility in crypto actually makes these patterns more pronounced and easier to identify.
How long does a Wyckoff accumulation phase typically last in crypto?
In cryptocurrency markets, accumulation phases can vary significantly depending on the timeframe and asset. On daily charts, accumulation ranges for major cryptocurrencies like Bitcoin and Ethereum can last anywhere from two weeks to several months. On lower timeframes like the 4-hour or 1-hour chart, accumulation phases may develop over just a few days.
Can beginners learn to use the Wyckoff Method?
While the Wyckoff Method has a steeper learning curve than basic indicator-based strategies, beginners can absolutely learn to use it. Start by studying the four market phases and practicing identification on historical charts. Focus on understanding the relationship between price and volume before attempting to trade live. Paper trading platforms can help you practice without risking real capital.
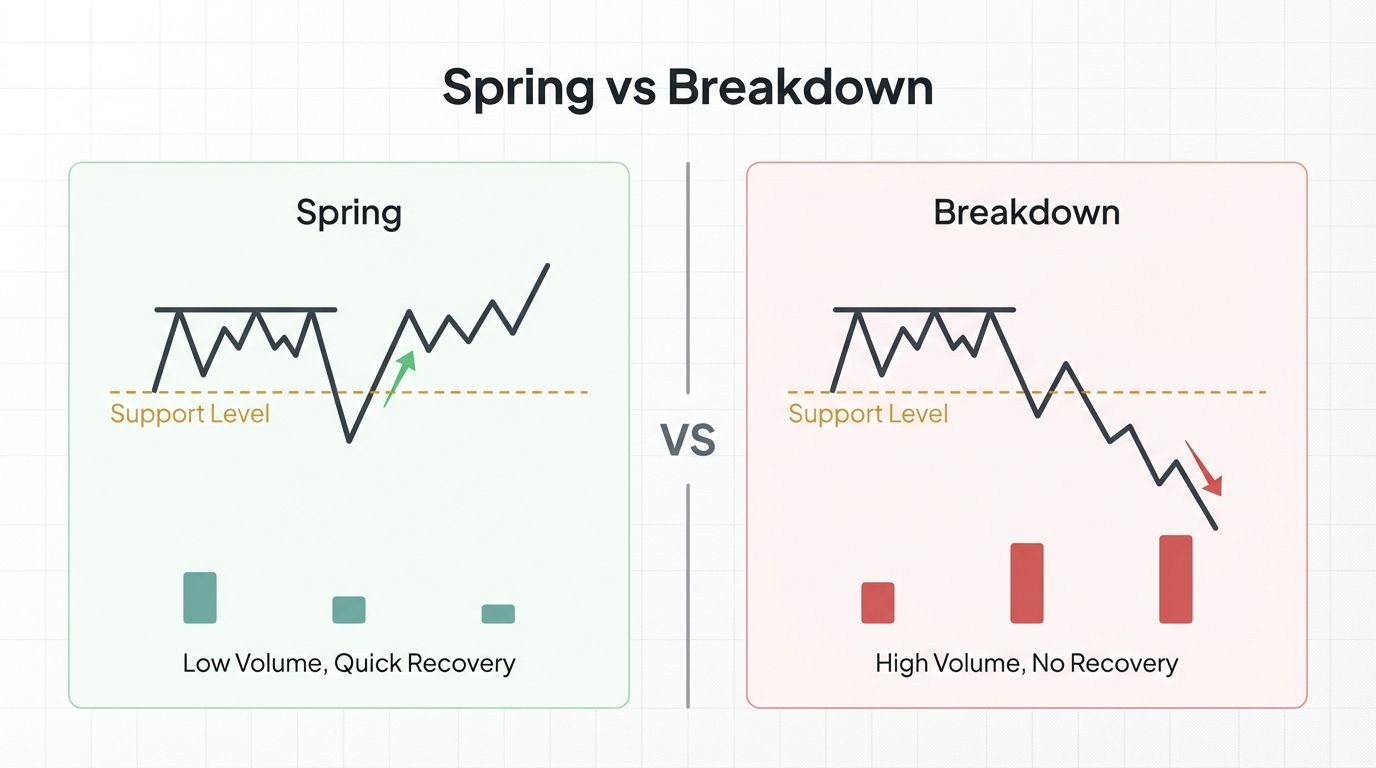
What is the difference between a Wyckoff spring and a breakdown?
A Wyckoff spring is a brief, temporary break below support that quickly reverses back into the trading range, typically on lower volume. A genuine breakdown, on the other hand, sees price close decisively below support with increasing volume and no quick recovery. The key distinction is volume behavior and the speed of the recovery. Springs are designed to trap sellers, while breakdowns indicate that supply has genuinely overwhelmed demand.
Should I combine the Wyckoff Method with other analysis tools?
Combining the Wyckoff Method with complementary tools can enhance your analysis. Volume profile, market depth data, and on-chain metrics for crypto can provide additional confirmation. However, avoid cluttering your charts with too many indicators. The Wyckoff Method is designed to read raw price and volume action, so keep additional tools to a minimum and use them for confirmation rather than primary signals.