
Cardano (ADA) has captured attention throughout 2024 with an impressive rally, breaking free from a prolonged corrective phase that had kept its price subdued. Beginning the year with a consolidation near $0.30, ADA surged to a high of $1.28, completing wave (5) of a broader Elliott Wave structure.
This technical development highlights the intricate interplay of price dynamics and market psychology within Cardano’s bullish trajectory.
Elliott Wave Analysis: Completing a Bullish Cycle
Cardano’s price action in 2024 aligns with the classic Elliott Wave theory, which posits that market movements unfold in repetitive wave patterns driven by collective investor behavior. After forming a solid base around $0.30—likely wave (4) within the larger cycle—the breakout into wave (5) signaled renewed bullish momentum.
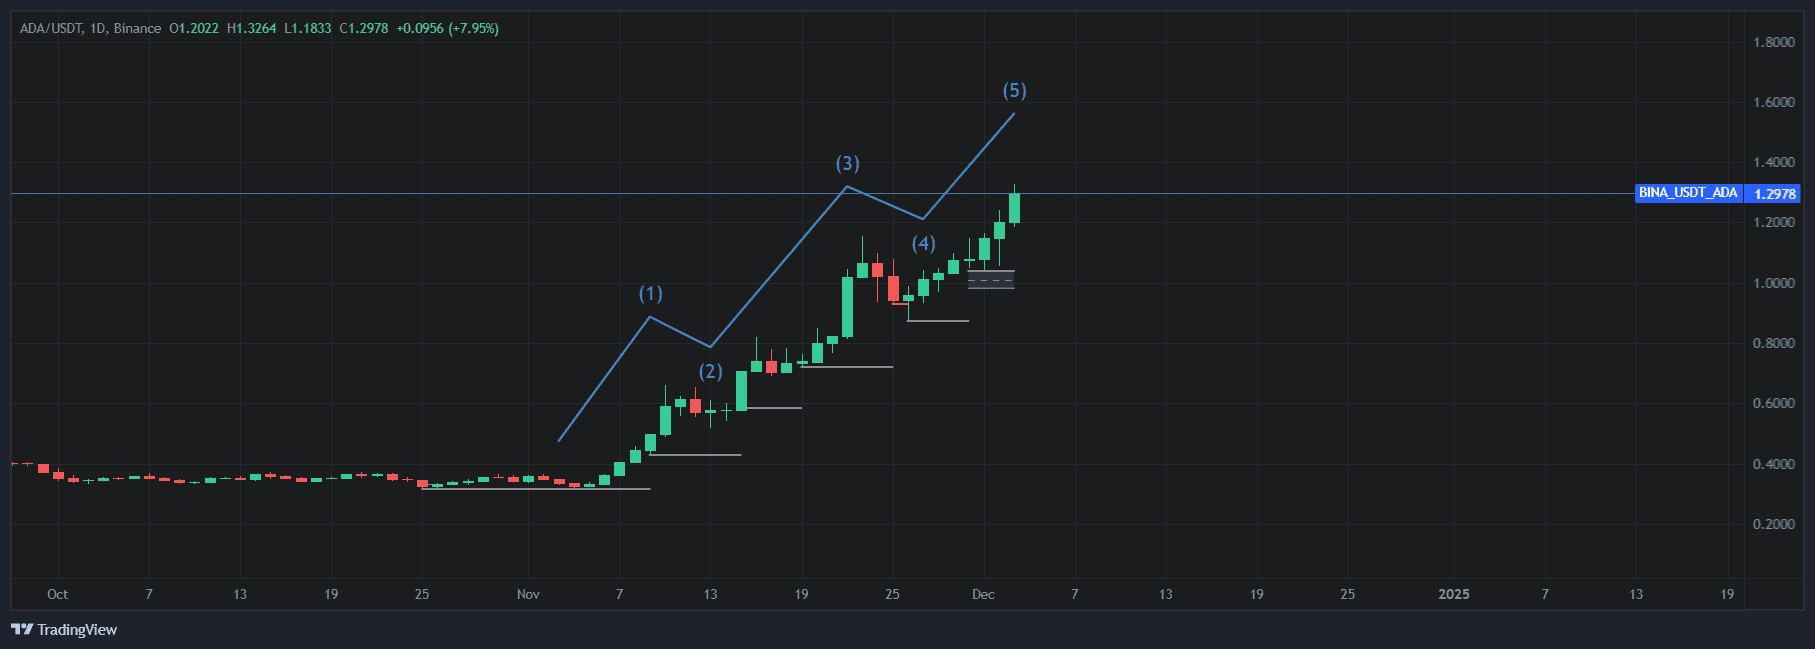
The wave (5) rally was characterized by:
- Breakout from a descending triangle: ADA decisively breached the descending triangle pattern, signaling a reversal of its long-term bearish trend. Such breakouts often indicate an influx of buying pressure as traders shift sentiment.
- Parabolic upswing: the price movement displayed a steep trajectory, indicative of impulsive market behavior typical of wave (5) formations. This phase often involves speculative fervor and culminates near critical resistance levels.
The rally concluded at $1.28, a key horizontal resistance zone, suggesting the completion of this impulsive wave cycle.
Technical Indicators: Assessing Momentum and Overextension
The strength of Cardano’s rally is reflected in technical metrics:
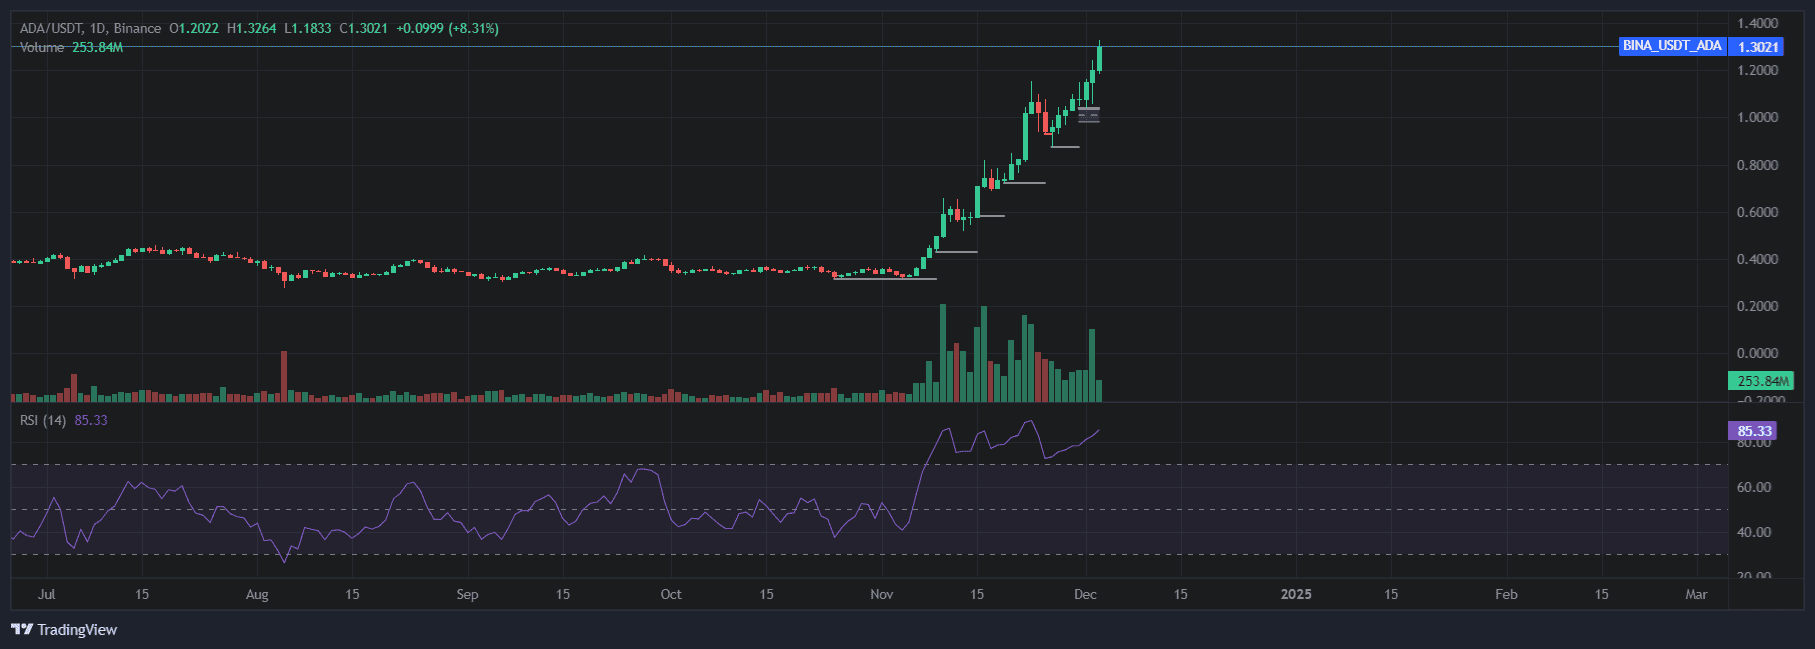
- Volume Analysis: increased trading volumes during the breakout confirmed the validity of the move, reinforcing confidence in its sustainability throughout the rally.
- Momentum Oscillators: indicators such as the Relative Strength Index (RSI) reached overbought levels, hinting at potential overextension. Historically, such conditions often precede corrective retracements or consolidation phases.
Future Outlook: Key Scenarios and Levels to Watch
While the bullish trend has been robust, market conditions suggest caution as Cardano approaches a critical juncture.
- Potential corrective wave: post-wave (5) rallies often lead to corrective ABC patterns, where prices retrace to digest prior gains. Traders may anticipate a pullback toward support zones, such as $0.95 or $0.75, depending on the depth of the correction.
- Continuation scenarios: a sustained break above $1.28 could invalidate corrective expectations, paving the way for further upside. In such cases, ADA’s next target might align with Fibonacci extensions at $1.50 or beyond.
Conclusion
Cardano’s 2024 rally exemplifies the dynamics of Elliott Wave theory, combining technical patterns with momentum indicators to forecast price movements. While the completion of wave (5) at $1.28 signals a potential pause, the overall bullish structure remains intact. Traders should monitor key support and resistance zones alongside broader market trends to navigate the next phase of Cardano’s price evolution effectively.