What Is Maximum Drawdown in Crypto Trading?
Maximum Drawdown (MDD) is one of the most important risk metrics every crypto trader should understand. It measures the largest peak-to-trough decline in the value of a portfolio or asset over a specific period before a new peak is reached. In simpler terms, it tells you the worst loss you would have suffered if you bought at the highest point and sold at the lowest.
The formula for Maximum Drawdown is straightforward:
MDD = (Trough Value - Peak Value) / Peak Value x 100%
Where:
- Peak Value is the highest portfolio value reached before the decline begins.
- Trough Value is the lowest portfolio value recorded after that peak, before any recovery.
For example, if your portfolio climbs to $100,000 and then falls to $60,000, the maximum drawdown is ($60,000 - $100,000) / $100,000 x 100% = -40%.
Maximum drawdown is not just about a single bad day. It captures the cumulative loss across an entire downward trend, which is why it is far more telling than a simple daily or weekly loss figure. A strategy might show modest average returns but hide a devastating 60% drawdown that would have wiped out most traders psychologically and financially.
Unlike volatility or standard deviation, MDD speaks in plain language. Traders can immediately understand that a -50% drawdown means the portfolio was cut in half at some point, without needing to interpret statistical abstractions.
How to Calculate Maximum Drawdown
Calculating MDD manually is straightforward once you track your portfolio's historical value over time. Here is a step-by-step example:
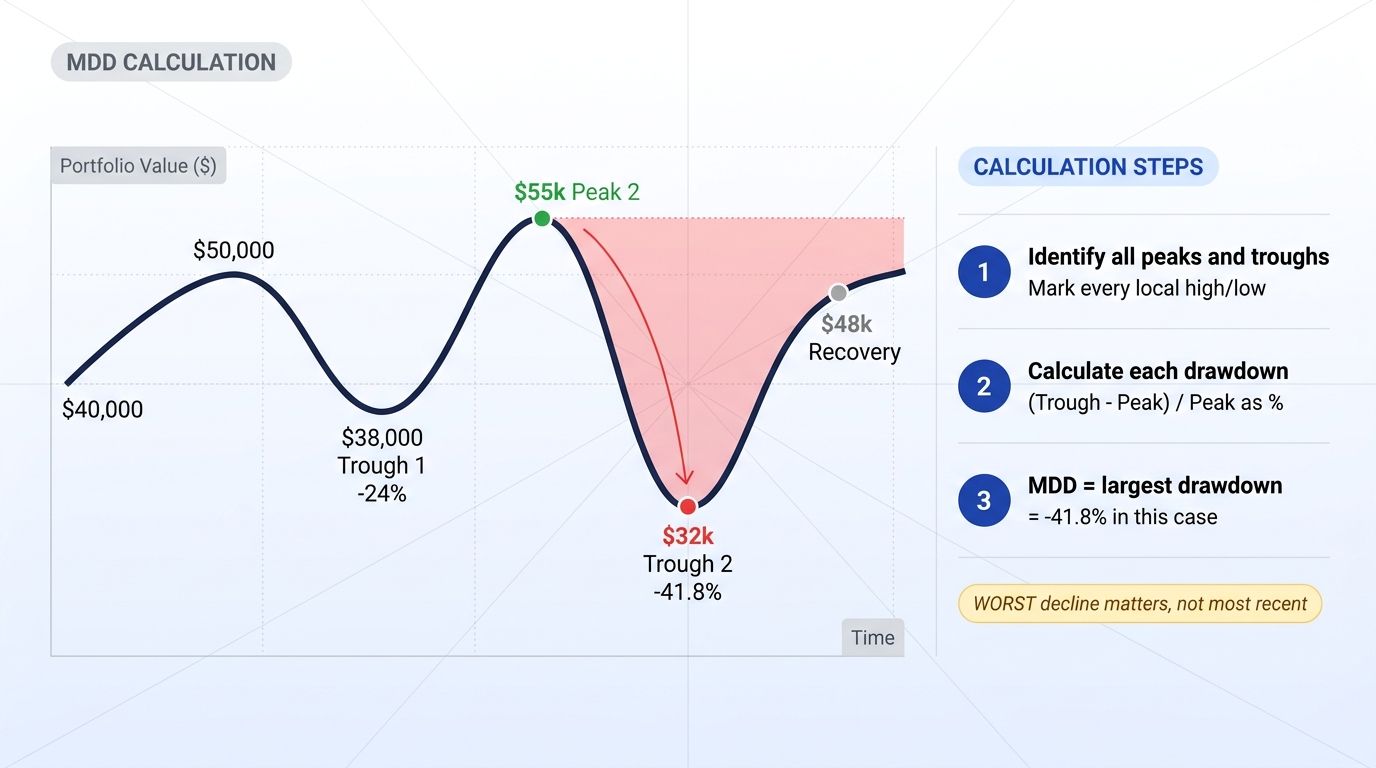
Step 1: Identify the Peak
Suppose your portfolio grows steadily over several months, reaching a high of $50,000 in November 2024. This is your peak value.
Step 2: Identify the Trough
Following that peak, market conditions deteriorate. Your portfolio value falls through several lower points until it hits a bottom of $32,000 in February 2025.
Step 3: Apply the Formula
MDD = ($32,000 - $50,000) / $50,000 x 100% MDD = -$18,000 / $50,000 x 100% MDD = -36%
This means your portfolio experienced a maximum drawdown of 36% from peak to trough.
Step 4: Consider the Full Timeline
If your portfolio later recovers to $55,000, the drawdown period is considered closed. However, if during that recovery it dips again to $29,000, you would need to recalculate with the new lower trough, which would produce a worse MDD figure.
Key Notes on Calculation
- Always measure drawdown from the most recent peak before each trough, not from an arbitrary starting point.
- In crypto markets where volatility is extreme, MDD can change dramatically within days.
- Tools like trading dashboards and portfolio trackers calculate MDD automatically, saving you from tracking every value manually.
Why Maximum Drawdown Matters
Understanding MDD is not just an academic exercise. It has direct, practical implications for how you trade and survive in crypto markets.
The Recovery Math Is Brutal
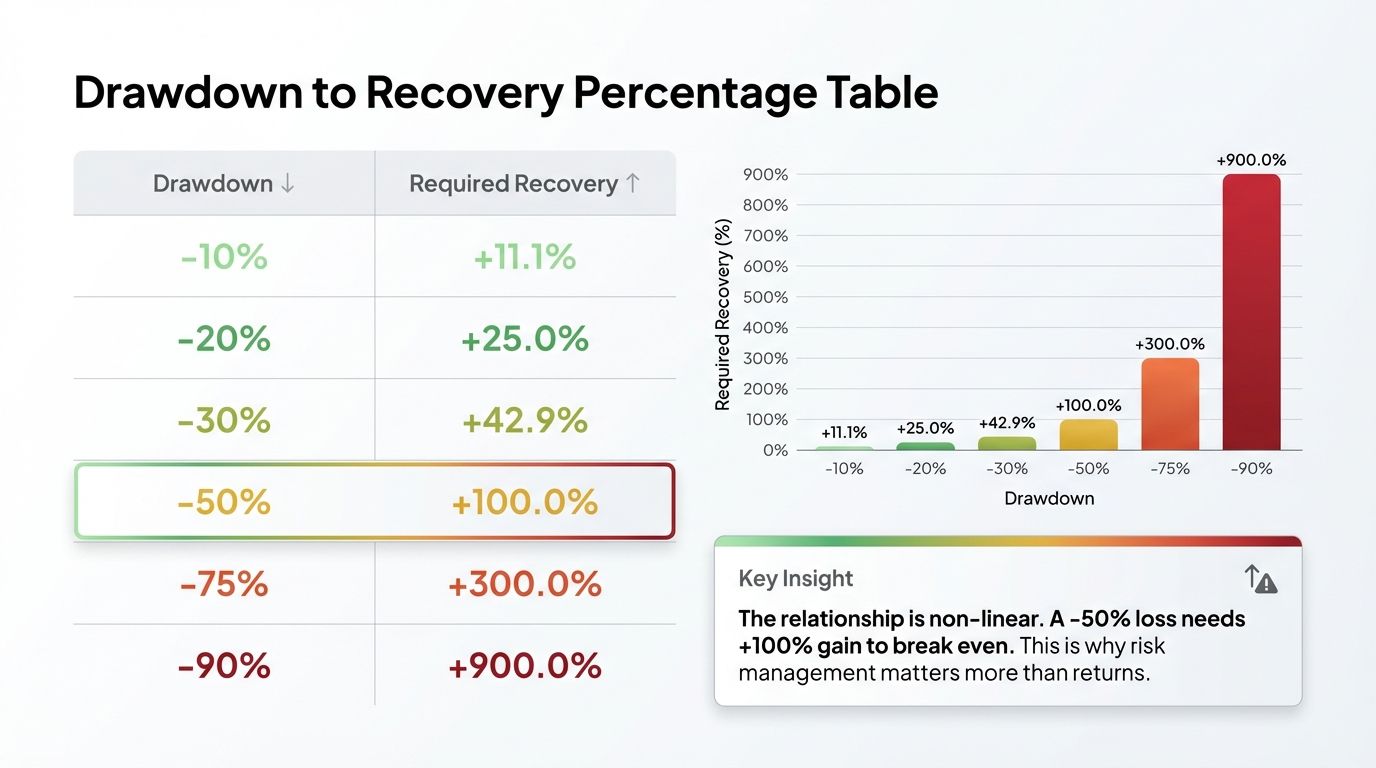
One of the most important things MDD reveals is how hard it is to recover from a large loss. The math is asymmetric and unforgiving:
| Drawdown | Recovery Needed to Break Even |
|---|---|
| -10% | +11.1% |
| -20% | +25% |
| -30% | +42.9% |
| -50% | +100% |
| -75% | +300% |
| -90% | +900% |
A 50% drawdown does not require a 50% gain to recover. It requires a full 100% gain just to get back to where you started. A 75% drawdown requires a 300% return. This is why protecting capital in downturns is far more important than chasing gains.
Many traders focus entirely on return percentages and ignore how much they lose along the way. A strategy that returns 30% per year but involves a 70% drawdown is effectively unusable for most traders, because most people would panic and exit during the drawdown, locking in the loss.
Psychological Impact
Beyond the math, a high maximum drawdown destroys trading discipline. When a portfolio loses 40%, 50%, or more, the psychological pressure to "do something" becomes overwhelming. Traders make impulsive decisions: cutting losses at the worst time, over-leveraging to recover quickly, or abandoning a valid strategy entirely.
Measuring and managing MDD in advance helps you set realistic expectations. If you know your strategy has historically produced a maximum drawdown of 25%, you can prepare mentally and financially for that scenario rather than being blindsided by it.
MDD as a Risk-Adjusted Performance Metric
Two strategies can have the same total return but vastly different risk profiles. A strategy that returned 80% over two years with a maximum drawdown of 15% is dramatically better than one that returned 80% with a 60% drawdown. MDD is a core input in risk-adjusted metrics like the Calmar Ratio (annual return divided by maximum drawdown), which helps you compare strategies on an apples-to-apples basis.
Historical Drawdowns in Crypto
Crypto markets are notorious for extreme drawdowns that dwarf anything seen in traditional financial markets. Understanding the historical scale of these drawdowns helps calibrate your risk expectations.
Bitcoin's Major Drawdowns
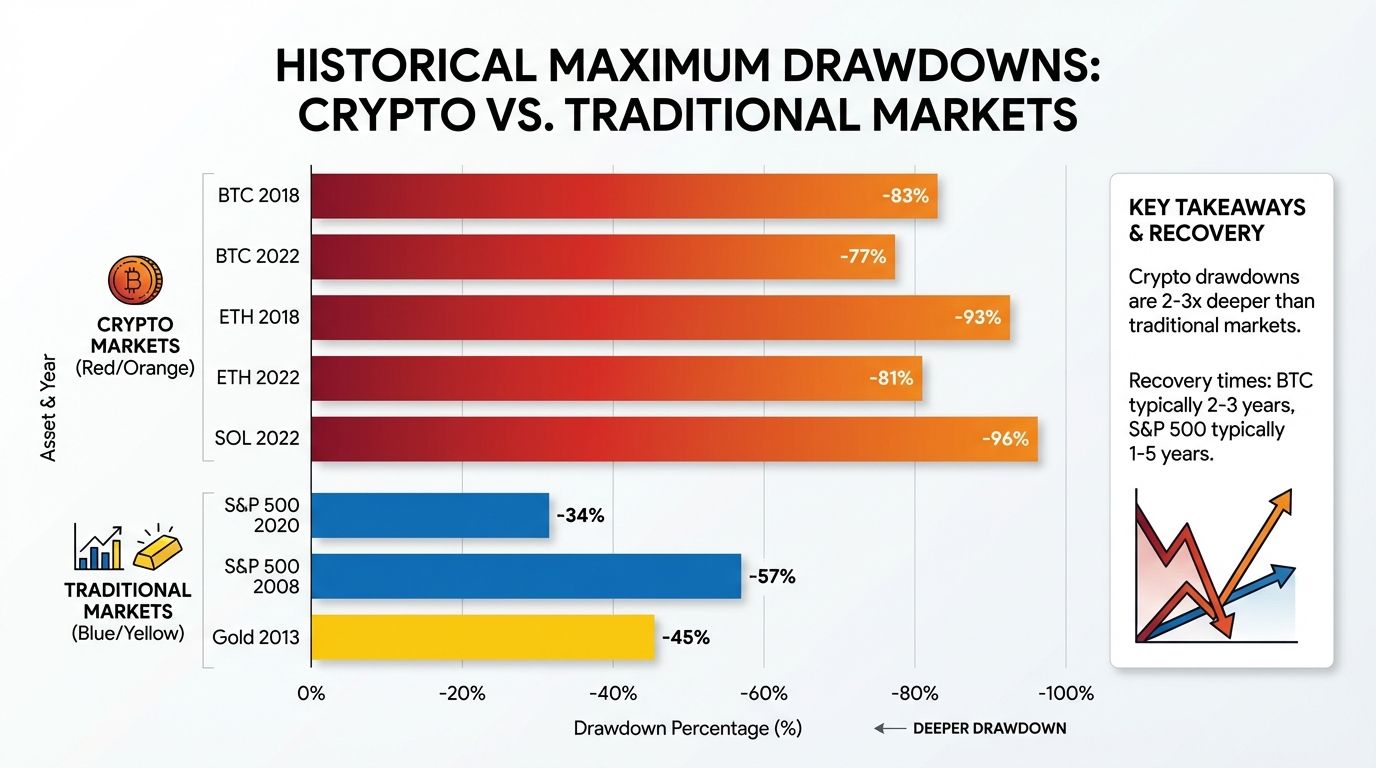
Bitcoin, despite being the most established cryptocurrency, has experienced several devastating drawdowns:
- 2018 Bear Market: Bitcoin fell from roughly $20,000 in December 2017 to approximately $3,200 in December 2018, a drawdown of approximately -83%.
- 2020 COVID Crash: Bitcoin dropped nearly 50% in a single day in March 2020.
- 2022 Bear Market: Bitcoin fell from its all-time high near $69,000 in November 2021 to below $16,000 in November 2022, a drawdown of approximately -77%.
Ethereum and Altcoins
Ethereum's drawdowns have been even more severe in percentage terms:
- In 2018, ETH fell from around $1,400 to below $90, a drawdown exceeding -93%.
- In the 2022 cycle, ETH dropped from roughly $4,800 to below $900, a drawdown of approximately -81%.
Smaller altcoins frequently experience drawdowns of 95% or more during bear markets, and many never recover at all.
Comparison to Traditional Markets
For context, the S&P 500's worst modern drawdown was approximately -34% during the COVID crash in 2020, and about -57% during the 2008 to 2009 financial crisis. Even the worst traditional market crashes are mild compared to routine crypto bear markets.
This does not mean crypto is untradeable. It means the position sizing, risk management, and drawdown tolerance required for crypto trading must be far more conservative than what equity investors are accustomed to.
How to Reduce Maximum Drawdown
Reducing your MDD is one of the most effective ways to improve your long-term trading performance. Here are the key strategies:
Position Sizing
Never risk more than a small percentage of your portfolio on any single trade. A common rule is to risk no more than 1% to 2% of total capital per position. This limits the damage any single bad trade can do to your overall portfolio.
Diversification
Spreading capital across multiple assets reduces the impact of any single asset collapsing. However, in crypto, be aware that most coins are highly correlated with Bitcoin. True diversification may require including assets from different market categories or asset classes entirely.
Stop Losses
Predefined stop losses automatically exit positions when the price falls below a certain threshold. This prevents small losses from turning into catastrophic ones. Hard stop losses on each position are among the most effective tools for drawdown control.
Reduce Leverage
Leverage amplifies both gains and losses. A 2x leveraged position turns a 50% market drawdown into a 100% loss. In highly volatile crypto markets, using high leverage dramatically increases the probability of a catastrophic drawdown. Keeping leverage minimal or avoiding it entirely during uncertain market conditions is a straightforward way to cap downside risk.
Dollar Cost Averaging (DCA)
Instead of deploying all capital at once, spreading entries over time through DCA reduces the risk of buying at the absolute peak. This lowers your average entry price and smooths out the impact of short-term volatility on your portfolio value.
Regular Portfolio Rebalancing
Periodically rebalancing your portfolio to target allocations prevents any single position from growing so large that a collapse in that asset causes a portfolio-level catastrophe.
Drawdown Recovery Time
Knowing how deep a drawdown is matters, but knowing how long recovery takes is equally important. In crypto markets, recovery timelines vary enormously.
Bitcoin's 2018 drawdown took until late 2020 to fully recover, approximately two years. Ethereum's 2018 peak was not recovered until 2021, roughly three years later. Many altcoins from the 2017 to 2018 cycle have never recovered their previous all-time highs.
The Compound Effect on Recovery
Recovery time is not linear. Because you need to generate larger percentage gains than the percentage lost (as shown in the recovery table above), every additional percent of drawdown adds disproportionately more recovery time.
Consider a trader who experiences a 50% drawdown and then generates a steady 10% annual return. At that rate, it would take over seven years just to break even. Meanwhile, a trader who kept their drawdown to 20% would break even in under three years at the same return rate.
This is why professional fund managers often say "the first rule is not to lose money." Preserving capital during downturns and avoiding large drawdowns is more valuable in the long run than hitting occasional large gains.
Planning for Drawdown Periods
If you are actively trading crypto, building a plan for drawdown periods before they happen is essential:
- Define in advance at what drawdown level you will stop trading and reassess your strategy.
- Keep enough reserves outside the market to cover living expenses so you are not forced to sell at the worst time.
- Use drawdown periods to review and refine your strategy rather than abandon it impulsively.
Using MDD to Evaluate Trading Strategies
Maximum drawdown is one of the most useful tools for comparing trading strategies. Two strategies can have identical total returns but fundamentally different risk characteristics based on their MDD.
A Practical Comparison
Strategy A:
- Annual return: 45%
- Maximum drawdown: 12%
- Calmar Ratio: 3.75
Strategy B:
- Annual return: 45%
- Maximum drawdown: 55%
- Calmar Ratio: 0.82
Both strategies return 45% annually. But Strategy A accomplishes this with a drawdown of only 12%, meaning traders could realistically stick with it through rough patches. Strategy B's 55% drawdown would cause most traders to abandon it in fear, capturing the losses but missing the eventual recovery.
Questions to Ask When Reviewing a Strategy
- What is the worst drawdown this strategy has ever produced historically?
- How long did the deepest drawdown last?
- Was the drawdown caused by conditions that could easily recur (e.g., a market-wide crash versus a one-off anomaly)?
- At the maximum drawdown point, would you have had the emotional and financial capacity to stay in the trade?
A strategy is only as good as your ability to execute it during its worst moments. MDD helps you stress-test your plan before deploying real capital.
Calmar Ratio and Sharpe Ratio Context
The Calmar Ratio (annual return / maximum drawdown) directly incorporates MDD. A Calmar Ratio above 1.0 is generally considered reasonable. Above 3.0 is strong. A strategy with a high Sharpe Ratio but a very high MDD should be treated with caution, because Sharpe Ratio alone does not capture tail-risk scenarios that frequently occur in crypto.
Monitor Drawdowns Across Exchanges with Altrady
Managing maximum drawdown manually across multiple exchanges is time-consuming and error-prone. Altrady provides a unified portfolio dashboard that tracks your positions, portfolio value, and performance metrics across all connected exchanges in real time.
With Altrady, you can:
- View your live portfolio value across Binance, Coinbase, Kraken, and dozens of other exchanges from a single dashboard.
- Set automated alerts and stop losses to protect against drawdowns before they compound.
- Track your overall portfolio performance history to calculate and visualize your actual MDD over time.
- Use built-in risk management tools to enforce position sizing rules that limit per-trade exposure.
- Quickly identify which positions are contributing most to your current drawdown and act accordingly.
Whether you are a active day trader or a long-term holder, having real-time visibility into your portfolio's drawdown status is the difference between managing risk proactively and discovering losses after the damage is done.
Start your free trial with Altrady today and bring your drawdown management into a single, professional-grade trading environment.
Frequently Asked Questions
What is the difference between maximum drawdown and volatility?
Volatility measures how much an asset's price fluctuates over time, both up and down. Maximum drawdown specifically measures the worst sustained loss from a peak to a trough. A highly volatile asset might still have a relatively modest MDD if it recovers quickly after each drop. MDD is more relevant for understanding downside risk and how much capital you could lose in the worst scenario.
Is a 20% maximum drawdown acceptable for a crypto portfolio?
For crypto specifically, a 20% maximum drawdown is considered quite conservative and well-managed. Given that Bitcoin itself has experienced drawdowns exceeding 80%, a diversified crypto portfolio that limits MDD to 20% to 30% through disciplined position sizing and stop losses is performing well from a risk management perspective. What counts as "acceptable" depends on your personal risk tolerance and investment horizon.
Can maximum drawdown predict future losses?
MDD is a historical measure, not a predictive one. However, a strategy's historical MDD provides a baseline expectation for future risk. A strategy that has produced a 40% MDD in the past is likely to produce comparable drawdowns under similar market conditions. It is best used as a minimum floor for your risk planning rather than a precise prediction.
How does leverage affect maximum drawdown?
Leverage multiplies the impact of price movements directly on your portfolio's MDD. With 2x leverage, a 30% market decline produces a 60% portfolio drawdown. With 5x leverage, a 20% move against your position can trigger a complete wipeout. In crypto markets where 30% to 50% moves can happen within days, high leverage makes catastrophic drawdowns not just possible but likely over any meaningful trading period.
How often should I review my strategy's maximum drawdown?
You should review your strategy's MDD at least monthly, and immediately after any period of significant market stress. If your live drawdown is approaching the historical maximum drawdown of your strategy, that is a signal to reduce position sizes or pause trading until conditions stabilize. Setting an alert at 80% of your historical MDD gives you an early warning before things become critical.