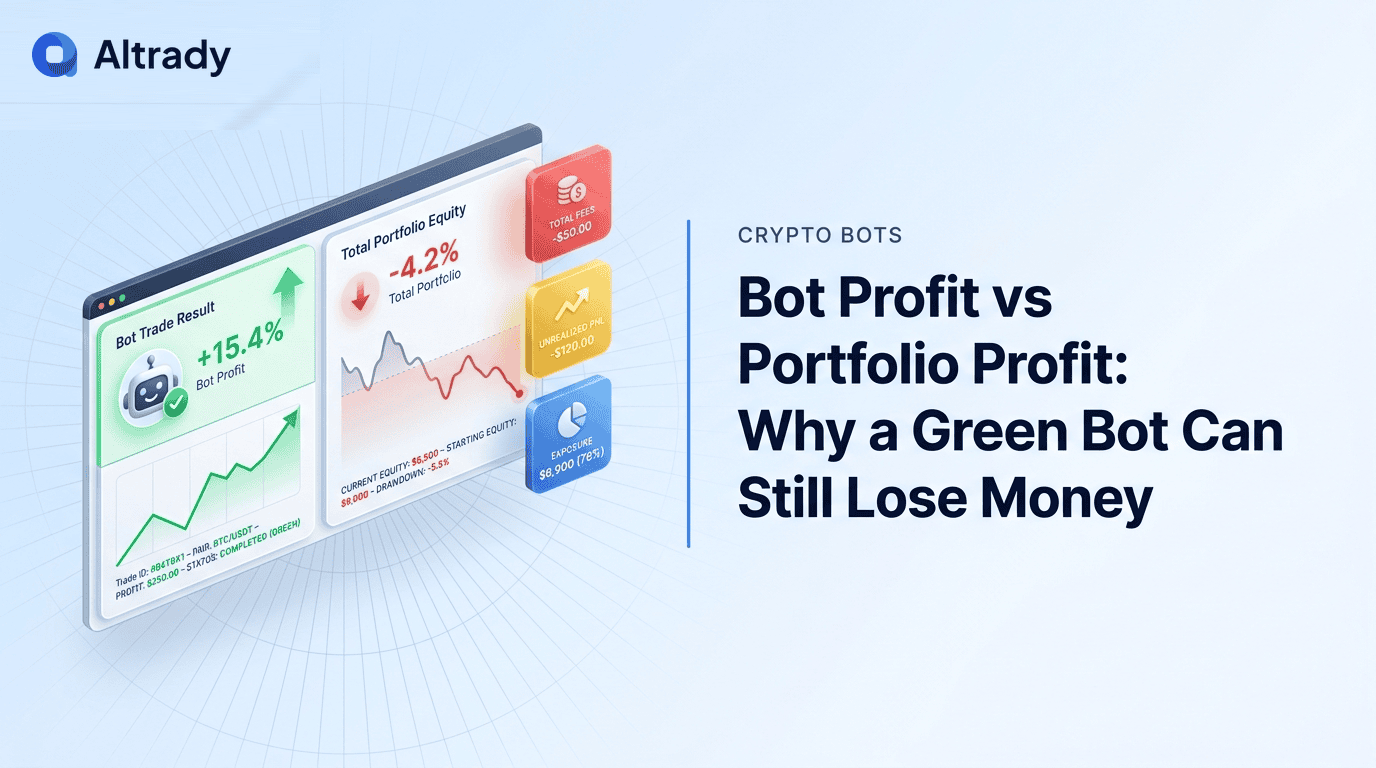

A crypto bot can show green results while the total portfolio is still losing value. That sounds contradictory until you separate closed trade profit, unrealized position loss, fees, and the value of the asset the bot is holding.
This distinction matters for every automated strategy. A Grid bot can collect small realized gains inside a range while inventory loses value during a trend break. A DCA bot can improve average entry while the open position remains below cost. The bot report and portfolio report are answering different questions.
Why Bot Profit and Portfolio Profit Are Different
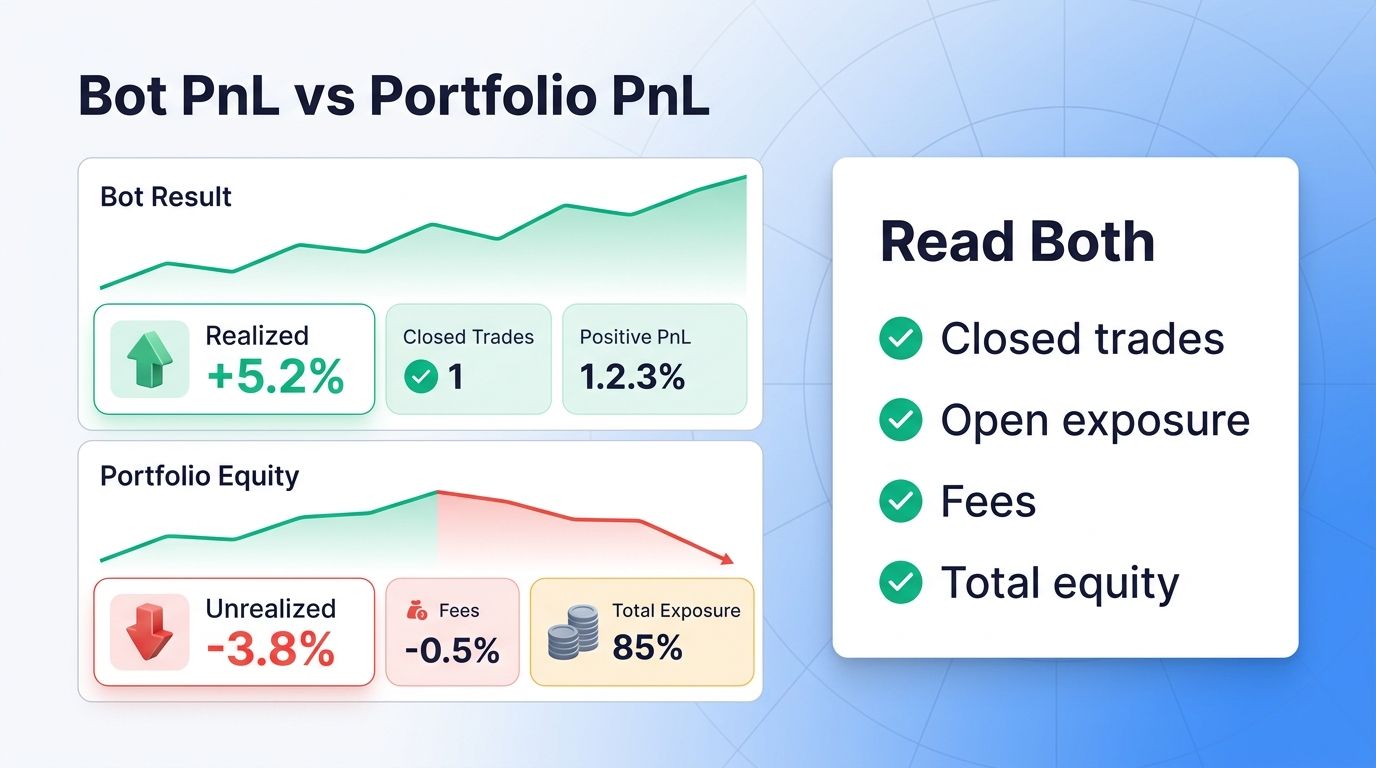
Bot profit usually focuses on the activity inside the strategy. It may count completed grid cycles, closed signal trades, or realized DCA exits. Portfolio profit looks at the full account value after open positions, fees, and market movement.
A trader can therefore have a bot that works mechanically but still holds inventory that is marked lower by the market. This is not always a bug. It is a reporting difference that becomes dangerous when traders only look at the green number.
- Bot profit can focus on closed actions.
- Portfolio profit includes open exposure.
- Unrealized loss can hide behind realized gains.
- Fees and funding can change the final account result.
The Grid Bot Example
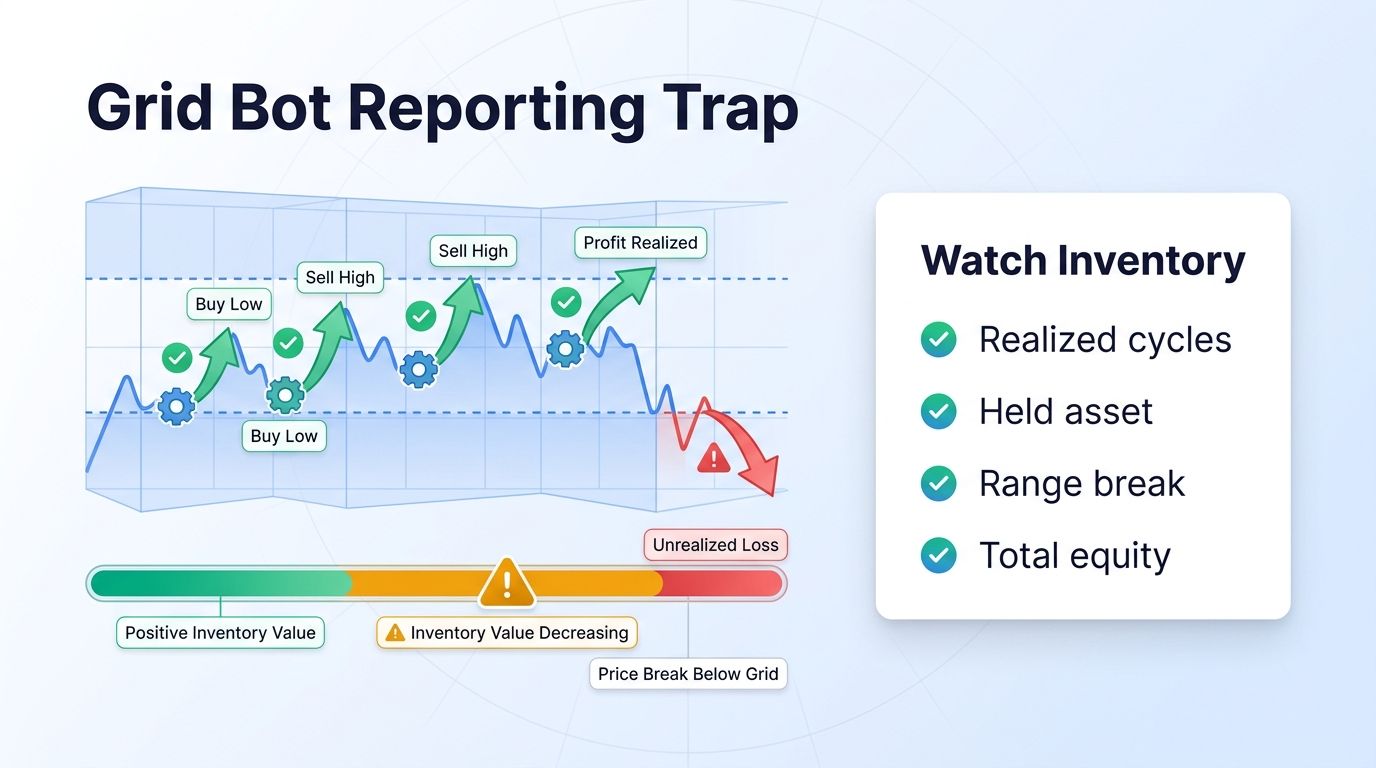
A Grid bot can generate realized gains when price moves up and down inside the chosen range. If price then breaks below the range, the bot may hold more of the base asset than expected. The closed grid cycles can be positive while the remaining position is underwater.
That is why range design and exit planning matter. A grid needs a plan for what happens when price leaves the range. Without that plan, the trader may confuse successful grid cycles with a successful account outcome.
- Grid cycles can close profitably inside the range.
- Inventory can lose value when price trends away.
- Range breaks need a pause, exit, or adjustment rule.
- Total equity is the final scorecard.
The DCA Bot Example
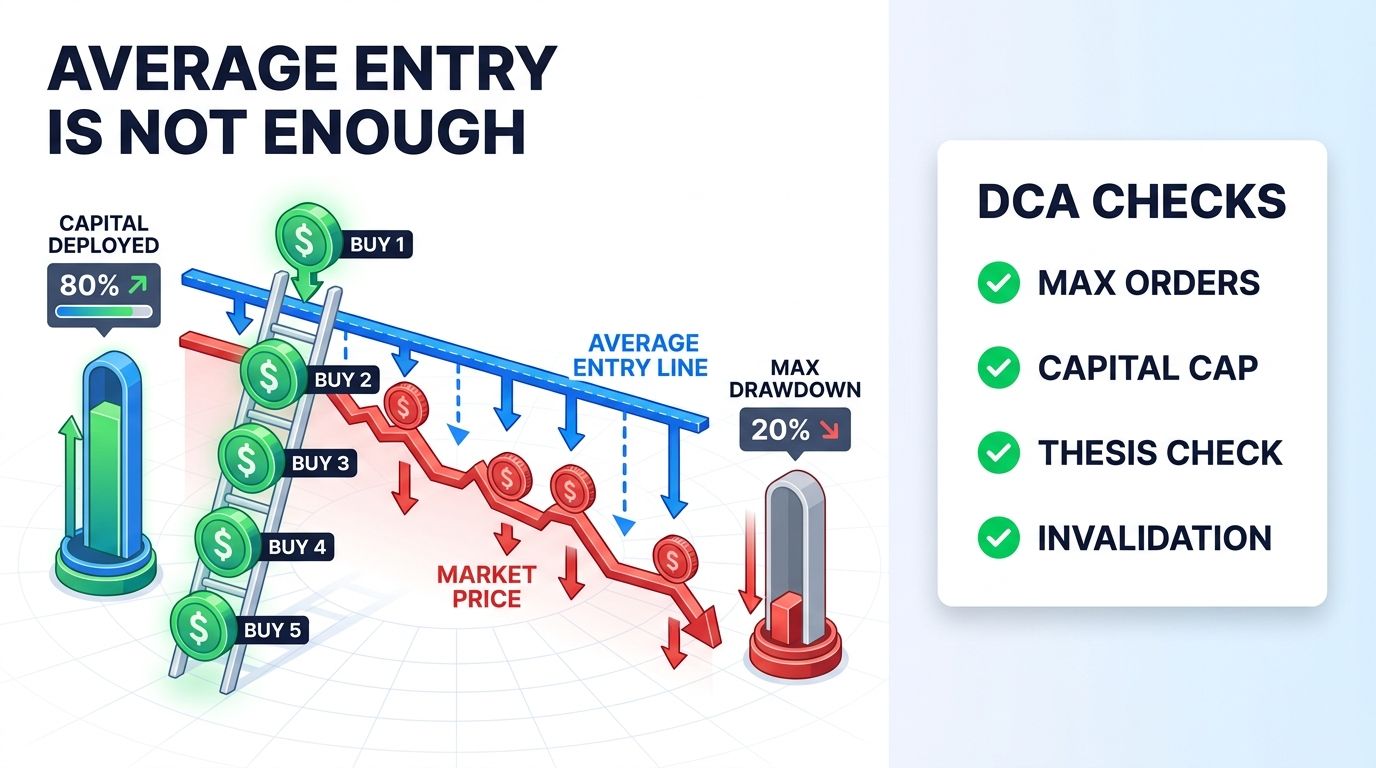
A DCA bot can reduce average entry by adding at planned levels. That can be useful when the trader has capital, conviction, and a defined risk limit. But a lower average entry does not guarantee profit if the market keeps falling.
The key is to treat average entry as one metric, not the entire story. A DCA setup needs maximum order count, maximum capital, invalidation, and a plan for when the asset thesis changes.
- Lower average entry can still be below market value.
- More orders mean more capital at risk.
- DCA needs a maximum exposure rule.
- Average entry is not the same as risk control.
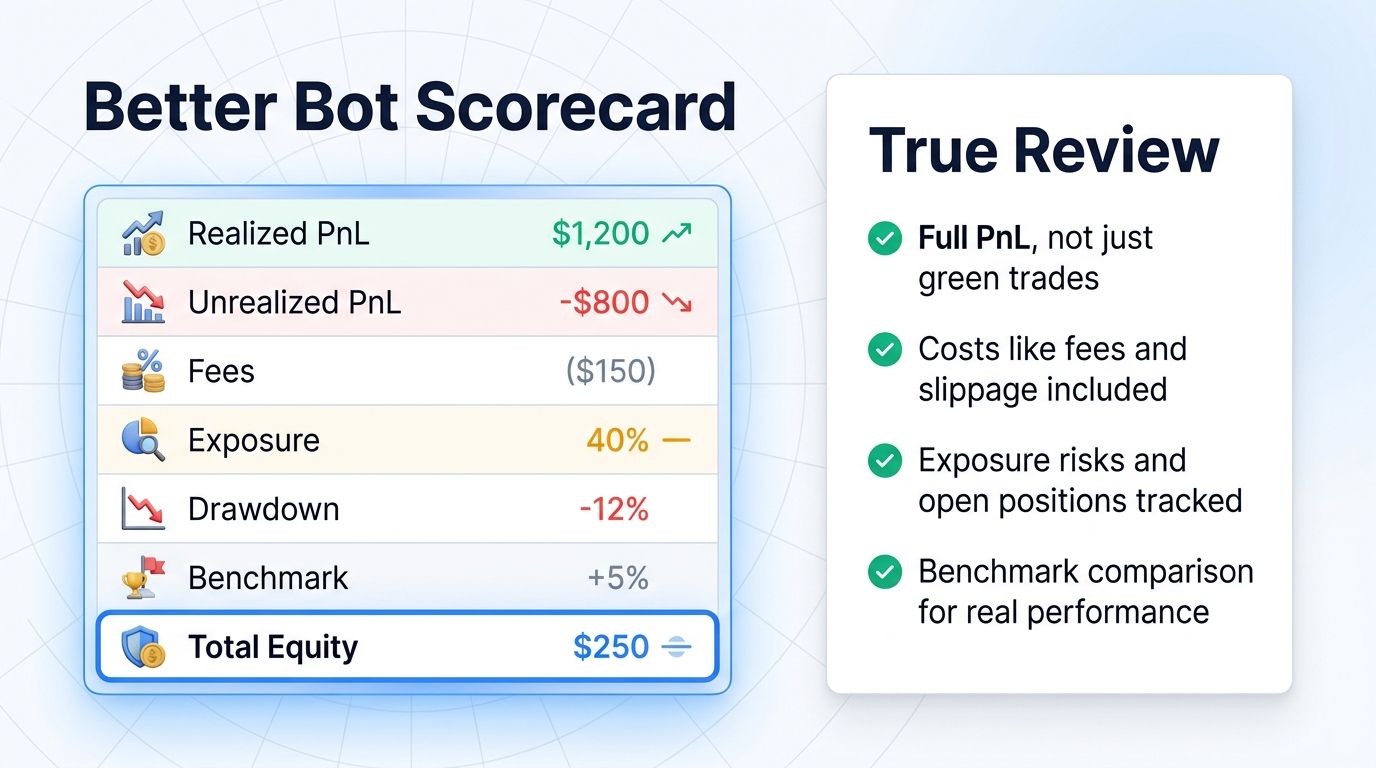
How to Build a Better Bot Scorecard
A better bot scorecard includes realized profit, unrealized profit or loss, fees, funding, open exposure, maximum drawdown, and total portfolio equity. It also compares the bot result with a simple benchmark, such as holding the asset or staying in stablecoins.
This turns bot review into actual performance analysis. Instead of asking whether the bot produced green trade lines, the trader asks whether the strategy improved the account outcome after all costs and risk.
- Track realized and unrealized PnL together.
- Include fees, slippage, and funding where relevant.
- Compare the result with a simple benchmark.
- Review maximum drawdown and capital efficiency.
A Simple Review Routine
At the end of each review period, write down three numbers: bot realized profit, open position value, and total account equity. Then compare them with the starting balance and with what would have happened if the trader had not launched the bot.
The review should also include a plain-language note. Did the bot do what it was designed to do? Did the market state stay compatible with the setup? Did the trader override rules or add exposure because the bot report looked green?
- Review realized profit and open exposure together.
- Compare with starting equity.
- Compare with a no-bot benchmark.
- Write down what changed in the market state.
How to Review the Result After One Week
A one-week review should not ask only whether the bot made money. It should ask whether the setup behaved as expected. Start with the market state that existed at launch, then compare it with the market state at review time. If the market moved from range to trend, or from calm to volatile, the original setup may no longer be valid.
Next, review the actual exposure. Count open positions, capital used, unrealized profit or loss, realized profit, and fees. A bot that looks productive on completed actions may still be using more capital than planned. A bot that looks quiet may be doing exactly what it was designed to do if the market never triggered the setup.
Finally, write down the decision before changing settings. The decision can be continue, reduce size, pause, close, or rebuild. Changing several settings at once makes the next review harder because the trader will not know which change helped. The goal is not constant adjustment. The goal is measured improvement.
- Compare launch thesis with current market state.
- Review open exposure, not only closed actions.
- Write the next decision before editing settings.
- Change one major variable at a time.
How This Fits an Altrady Workflow
Inside a practical Altrady workflow, automation starts after the plan is written. Smart Trading can help define the manual structure of the idea, including entry, stop, and take-profit planning. The Risk Reward Calculator can then help check whether the idea makes sense before any automated execution begins.
After that, the trader can choose the automation type. A Grid bot fits a defined range. A DCA bot fits a planned accumulation path. A Signal bot fits a trigger-based setup where the signal source has already been reviewed. The order matters because the tool should serve the plan, not replace the plan.
This workflow also helps prevent over-automation. If two bots depend on the same asset direction, the account may have more concentration than it appears. If several bots depend on the same market regime, the trader may need a smaller size per bot. The dashboard should make exposure clearer, not create a false feeling of diversification.
- Plan first with Smart Trading logic.
- Check risk before choosing automation.
- Match bot type to market state.
- Watch total exposure across all active bots.
Bottom Line
A green bot report is useful, but it is not the whole truth. The portfolio result includes open exposure, costs, market direction, and risk taken to produce the result.
The practical fix is simple. Review bots by total equity, not only closed trade profit. If a bot improves execution but increases drawdown beyond the plan, the setup still needs work.
- Bot profit and account profit are different.
- Open exposure can overwhelm realized gains.
- Total equity is the cleaner review metric.
- Benchmarks keep performance honest.
FAQ
Can a crypto bot be profitable while my portfolio is down?
Yes. The bot can show realized gains while open positions, fees, or market movement reduce total account equity.
Why does grid bot profit sometimes look misleading?
Grid cycles can close profitably while the bot holds inventory that loses value when price leaves the range.
How should I measure bot performance?
Track realized PnL, unrealized PnL, fees, exposure, drawdown, and total portfolio equity together.
What is the best benchmark for a bot?
Use a simple comparison such as holding the asset, holding stablecoins, or trading the same setup manually.