
Crypto traders like to think Bitcoin and Ethereum trade on crypto-native news, but June 2026 was a reminder that digital assets can still move with the broader risk cycle. When the AI stock trade weakened, crypto sentiment weakened with it.
Barron's reported on June 10 that Bitcoin, Ethereum, Solana, and XRP were lower as an AI selloff hit risk assets. That is why Google Trends US interest around crypto selloffs, Ethereum weakness, and AI-linked market pressure matters. Traders are trying to understand why two different markets suddenly feel connected.
Why Crypto Trades With Tech Risk
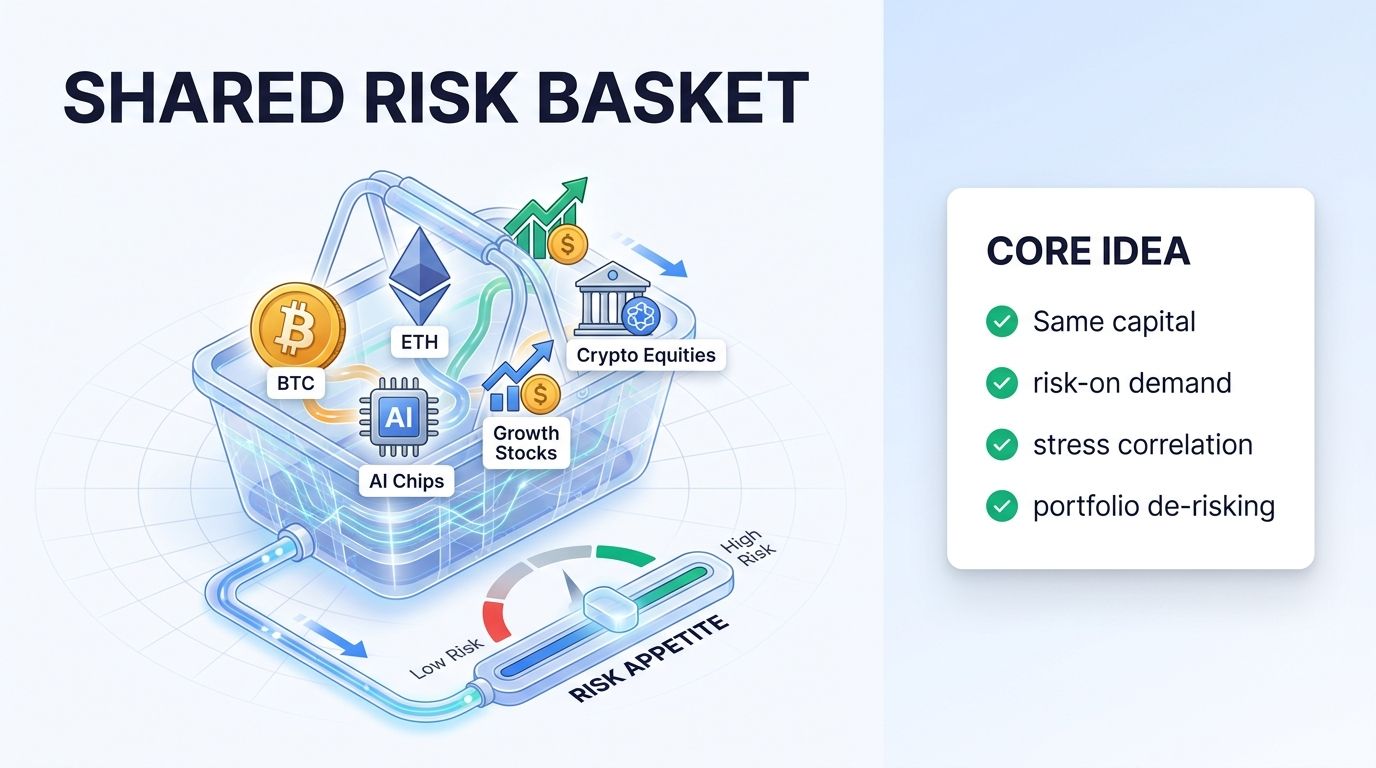
Crypto and growth stocks often share the same marginal buyer: investors looking for upside in high-volatility assets. When liquidity is abundant and confidence is high, those investors may hold AI stocks, Bitcoin, Ethereum, crypto equities, and smaller tokens at the same time.
When confidence falls, they reduce risk across the whole basket. That is why crypto can drop even when there is no blockchain-specific problem. The selloff is about portfolio risk, not only crypto fundamentals.
- Crypto and AI stocks can share risk-seeking capital.
- Portfolio de-risking can hit many assets together.
- Correlation often rises during stress.
- Crypto-native news is not always the driver.
Correlation Is Not Permanent
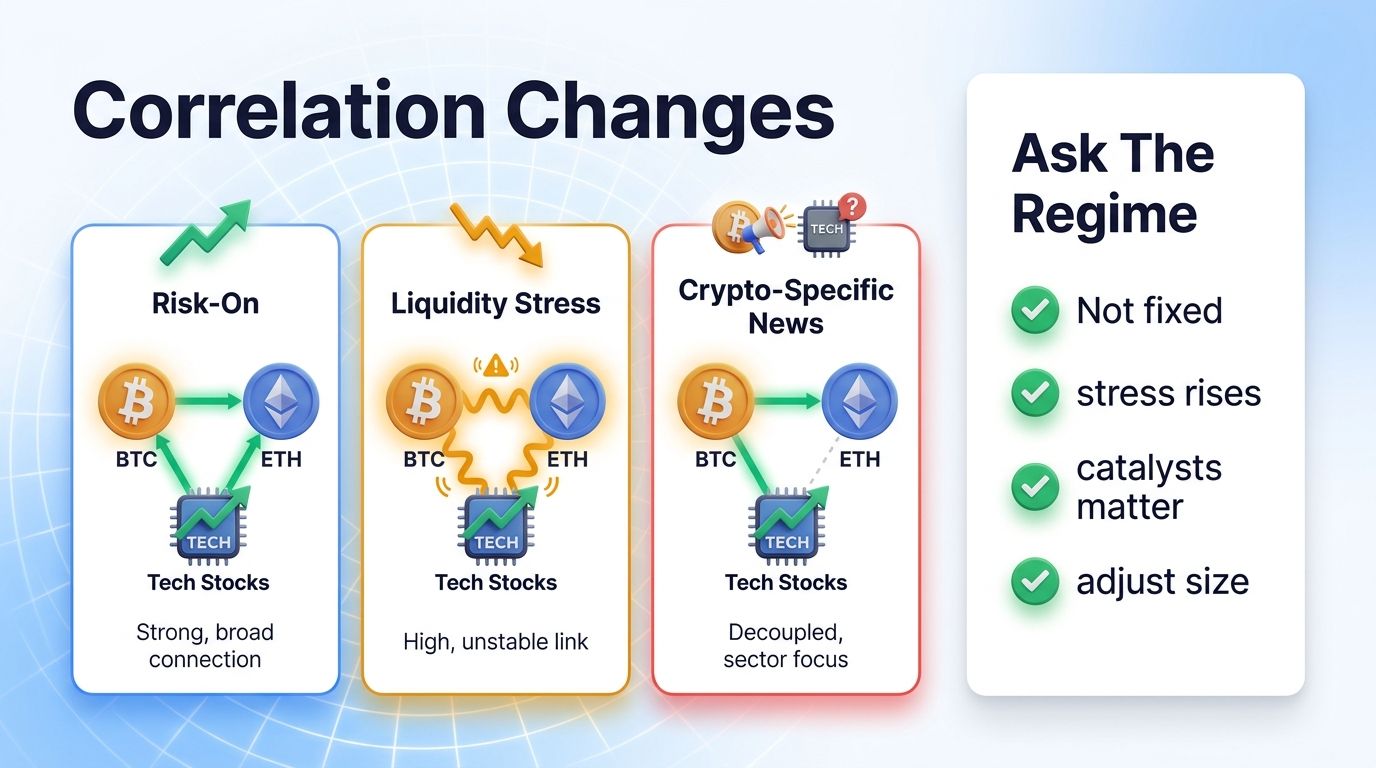
Correlation changes with regime. Bitcoin can trade like digital gold during some macro scares, like a high-beta tech asset during liquidity stress, and like its own market during crypto-specific events. Ethereum can track Bitcoin one week and then diverge because of staking, gas fees, or layer-2 narratives.
That means traders should avoid static assumptions. Saying Bitcoin always follows tech is as incomplete as saying Bitcoin is always uncorrelated. The useful question is what regime the market is in right now.
- Correlation rises and falls across regimes.
- Macro stress can dominate crypto-specific news.
- ETH can diverge from BTC when its own catalysts matter.
- Regime awareness improves risk sizing.

How to Track the AI-Crypto Link
Start with the obvious markers: Nasdaq futures, large AI stock indexes, semiconductor leaders, crypto equities, Bitcoin, Ethereum, and total crypto market capitalization. If all of them move together, the driver is likely broad risk appetite.
Then check whether crypto-specific indicators confirm the move. ETF flows, funding rates, liquidation maps, stablecoin liquidity, and exchange volume can show whether the tech selloff is becoming a crypto liquidity event or simply a short-term sentiment shock.
- Compare crypto with Nasdaq and AI leaders.
- Watch crypto equities for transmission.
- Check ETF flows and funding rates.
- Use liquidation maps to measure forced selling.
Trading Rules for Correlated Selloffs
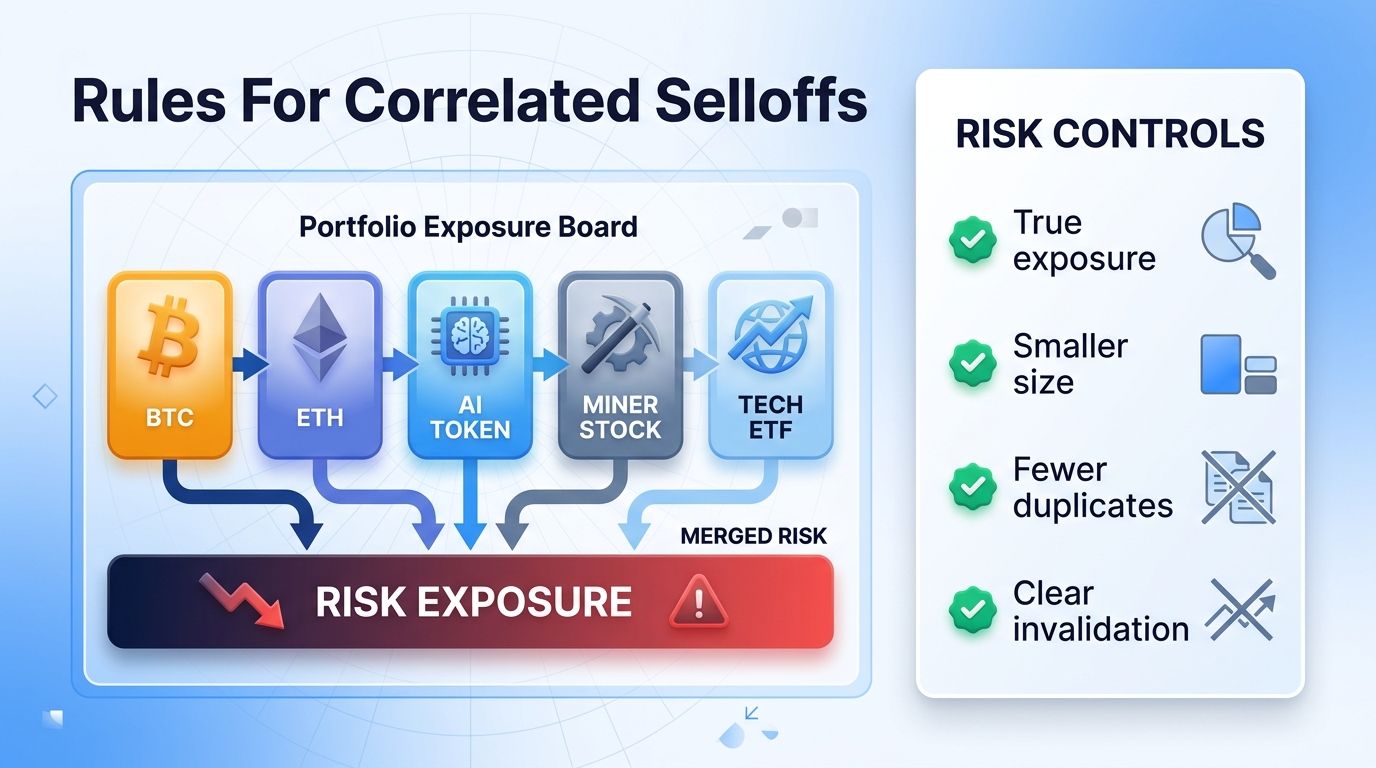
The first rule is to reduce false diversification. Holding Bitcoin, Ethereum, AI tokens, crypto miners, and high-growth tech stocks may look diversified by label, but the portfolio can behave like one risk trade during stress.
The second rule is to size for correlation. If all risk assets are moving together, the effective exposure is larger than the position list suggests. The Risk Reward Calculator can help translate that into smaller position sizes and clearer invalidation.
- Do not assume labels equal diversification.
- Reduce size when correlations rise.
- Avoid adding similar risk across many assets.
- Let invalidation and volatility guide exposure.
How to Know When the Link Is Breaking
The AI-crypto link weakens when one side stops confirming the other. If AI stocks keep falling but Bitcoin holds higher lows, crypto may be finding its own buyers. If Bitcoin keeps falling while tech stabilizes, the problem may be crypto-specific leverage, ETF outflows, or weak liquidity.
Divergence is important because it can mark a shift from broad de-risking to asset-specific selection. Traders should watch whether BTC holds structure during tech weakness, whether ETH/BTC improves, and whether crypto equities stop falling faster than spot assets.
The cleanest signal is not a single green candle. It is a multi-day change in behavior across spot, derivatives, ETF flows, and crypto equities.
- Watch for BTC higher lows during tech weakness.
- Check whether ETH/BTC confirms or lags.
- Compare crypto equities with spot assets.
- Look for multi-day behavior change.
Bottom Line
The June 2026 AI selloff reminded traders that crypto can still be part of the global risk basket. Bitcoin and Ethereum may have long-term adoption stories, but short-term flows can react to the same liquidity and sentiment forces that move tech stocks.
That does not make crypto less useful to trade. It makes risk management more important. A trader who understands correlation can avoid overexposure, pick cleaner setups, and wait for markets to separate before assuming diversification is working.
Use the AI-crypto link as a regime signal. When correlations rise, trade smaller and demand better confirmation. When they break, look for leadership and rotation.
- Crypto can behave like tech risk during stress.
- Correlation is regime-dependent.
- Portfolio exposure can be larger than it appears.
- Divergence can create better setups.
A Simple Correlation Review Process
A trader does not need an institutional risk system to review correlation. Start with a weekly chart of Bitcoin, Ethereum, Nasdaq futures, a semiconductor index, and a basket of crypto equities. Mark the days where all of them moved in the same direction with similar intensity.
Then add a second layer for crypto-specific stress. Funding spikes, liquidation clusters, ETF outflows, and weak stablecoin liquidity can turn a tech-led move into a crypto-led move. If those indicators stay calm, the selloff may be mostly sentiment spillover.
The third layer is position review. Count how many positions depend on the same risk appetite. BTC, ETH, AI tokens, miners, and tech stocks may all look different, but they can behave like one exposure when volatility jumps.
This review makes sizing more honest. If correlation is high, reduce duplicate exposure. If correlation breaks, look for assets showing independent strength.
The process also helps after a losing week. Instead of blaming one chart, the trader can see whether several positions were really the same macro trade. That lesson is more useful than treating every loss as a separate mistake.
When the same driver appears across positions, the next plan should reduce overlap before looking for new entries. This is how correlation review turns into practical capital protection. The goal is not to avoid volatility completely. The goal is to avoid carrying the same volatility several times without noticing. That discipline matters most when markets move fast. It keeps the plan honest under pressure and protects decision quality during fast market transitions.
- Review crypto and tech charts together.
- Add leverage and liquidity indicators.
- Count duplicate risk exposures.
- Increase selectivity when correlation rises.
FAQ
Why can crypto fall when AI stocks fall?
Both markets can share risk-seeking capital, so portfolio de-risking can hit AI stocks, Bitcoin, Ethereum, and crypto equities together.
Is Bitcoin always correlated with tech stocks?
No. Correlation changes by regime. It often rises during liquidity stress and can fall when crypto-specific catalysts dominate.
How should traders manage correlated selloffs?
Reduce size, avoid duplicated risk, check volatility, and define invalidation before adding exposure.
What signals show crypto is separating from tech?
Watch BTC higher lows during tech weakness, improving ETH/BTC, calmer funding, lower liquidations, and crypto equities stabilizing.