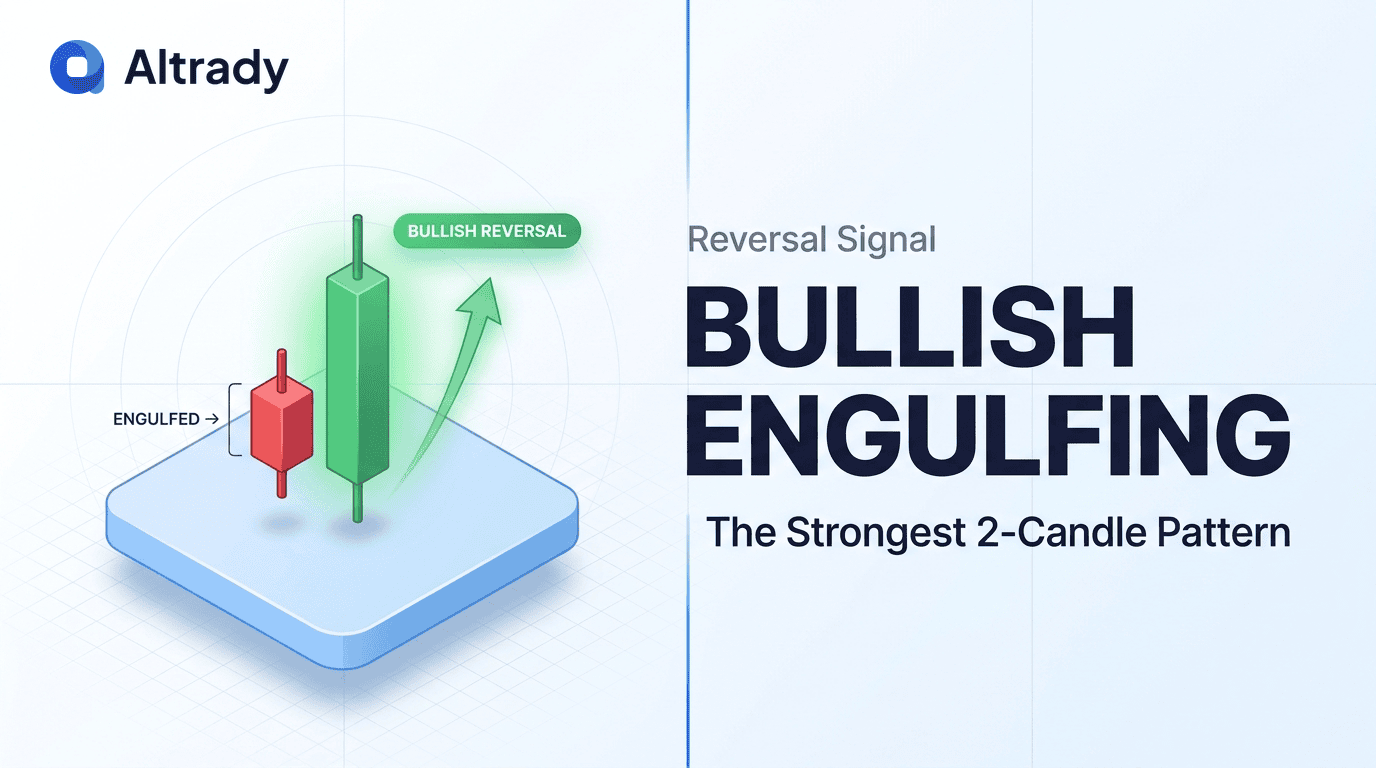
What Is a Bullish Engulfing Pattern?
The bullish engulfing pattern is a two-candle reversal formation that signals a potential shift in market control from sellers to buyers. It appears after a downtrend and consists of a small bearish (red) candle followed by a larger bullish (green) candle whose real body completely covers, or "engulfs", the body of the prior candle. The engulfing candle opens below or at the previous close and closes above the previous open, producing a decisive switch in sentiment on the chart.
Among dozens of candlestick formations, the bullish engulfing pattern is widely considered one of the strongest reversal signals because it captures a complete momentum flip in a single session. Sellers were pressing price lower into the formation, yet buyers stepped in with enough size to overwhelm supply and close well above where the previous session began. That visible takeover is what gives the pattern its weight.
Traders use the bullish engulfing candle as an early trigger to prepare for a reversal trade, to exit shorts, or to add exposure at a key support level. Used with trend context, volume, and confluence, it is one of the most reliable multi-candle setups in technical analysis.
How to Identify a Bullish Engulfing Pattern
Accurate identification is where most traders fail. The rules are specific, and partial engulfings do not count. Before you treat any candle combination as a valid bullish engulfing, run it through the checklist below.
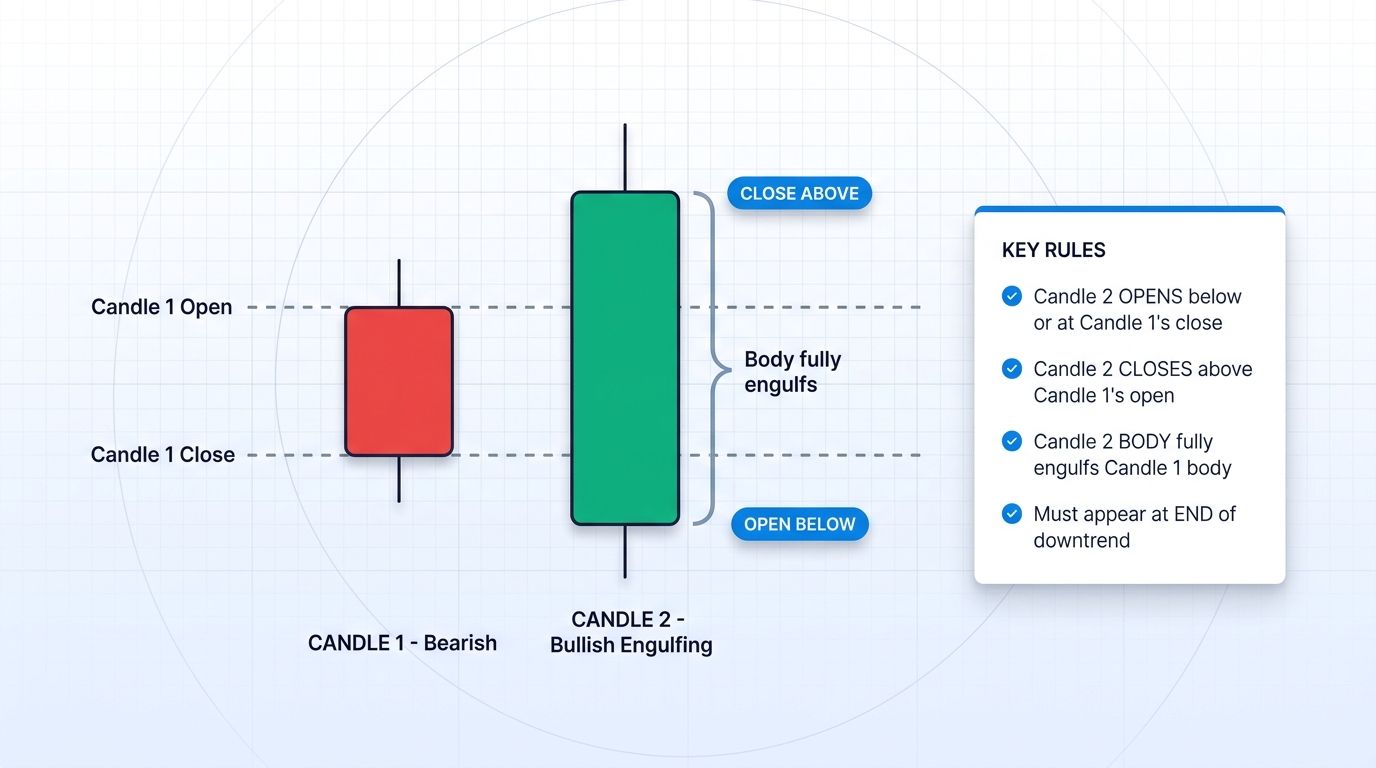
The two-candle structure
- Candle 1: a bearish (red) candle inside an existing downtrend. It can be a normal-sized candle or a small-body candle, but it must close lower than it opened.
- Candle 2: a bullish (green) candle that opens below or at Candle 1's close AND closes above Candle 1's open.
- Candle 2's real body must FULLY engulf Candle 1's real body. Wicks are allowed to extend in either direction, but the body is what matters.
- Candle 2 should ideally have minimal upper and lower wicks. A strong, directional body with little rejection shows conviction from buyers throughout the session.
- The pattern appears at the end of a downtrend or at a defined support zone. Random engulfings inside a sideways range do not carry the same weight.
A common mistake is confusing "engulfing the close to close" with "engulfing the body". The engulfing candlestick must cover the entire real body of the prior candle, not just reach above its close. If Candle 2 only pierces partway into Candle 1's body, you are looking at a piercing pattern or an inside bar, not a bullish engulfing reversal.
Key rules
- The LARGER the engulfing candle relative to recent price action, the stronger the signal. An engulfing candle that also engulfs three or four prior candles is more significant than one that barely covers a single small body.
- Higher volume on Candle 2 adds confirmation. Volume is the fuel behind a sentiment shift, and a low-volume engulfing often lacks follow-through.
- A gap down at Candle 2's open strengthens the pattern. Gaps are common in traditional stocks but rarer in 24/7 crypto. When they do appear on crypto charts (often after weekend illiquidity or during news events), treat them as a bonus confirmation.
- The deeper the prior downtrend, the more meaningful a bullish engulfing becomes. Reversals carry more weight when there is something to reverse.
Why the Bullish Engulfing Pattern Works: The Psychology
Every candle tells a story about who controlled the session, and the bullish engulfing pattern captures the moment that story changes. Going into Candle 2, sellers were in charge. Price opened lower than the previous close, confirming supply still had the upper hand. Short sellers were pressing and late longs were capitulating.
Then something shifted. Buyers stepped in with enough size to absorb the selling, reverse direction, and close the session above where sellers had dominated one candle earlier. The session did not just stabilize; it completely erased the prior bearish attempt. That is a measurable transfer of control.
This is not indecision (which would look like a doji). It is not hesitation (which would show long wicks on both sides). It is a decisive answer to the downtrend: buyers are back, and they brought volume. When this engulfing candlestick forms at a key support level or after an extended selloff, the path of least resistance has likely changed.
Bullish Engulfing vs Other Bullish Patterns
Several candlestick patterns look similar to the bullish engulfing candle but behave differently. Understanding the distinctions helps you avoid taking weaker signals and weighting them as strong ones.
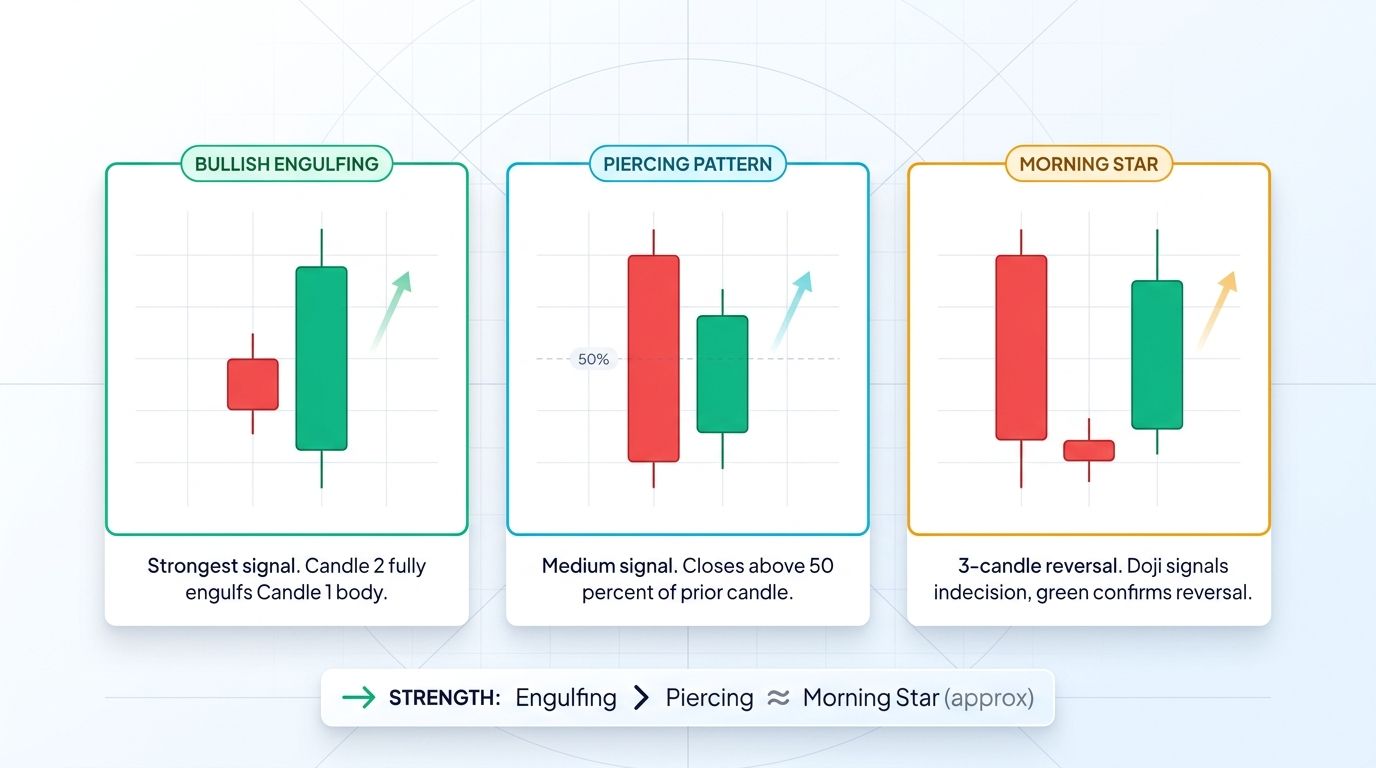
Bullish Engulfing vs Piercing Pattern
A piercing pattern also involves two candles at the end of a downtrend, but Candle 2 only closes above the midpoint of Candle 1's body, not above the entire body. The partial recovery is weaker than full engulfing because sellers still held some ground. A bullish engulfing reversal at the same support level is the stronger signal.
Bullish Engulfing vs Hammer
The hammer is a single-candle reversal with a small real body near the top of the range and a long lower wick. It shows sellers pushed lower but buyers rejected the move before the close. Because it is one candle, it does not show the same sustained takeover as an engulfing pattern. A bullish engulfing candle is generally stronger.
Bullish Engulfing vs Morning Star
The morning star is a three-candle reversal: a long bearish candle, a small-bodied doji, and a long bullish candle that recovers most of the first candle's range. It is powerful but slower to trigger. A bullish engulfing forms in two candles, letting traders act one session earlier.
How to Trade a Bullish Engulfing Pattern
A bullish engulfing trading strategy is only as strong as the rules that surround entry. Pattern recognition without a framework leads to losses, and most traders who "fail at engulfings" are actually failing at risk management and context.
Rule 1: Trend context is non-negotiable
A bullish engulfing pattern is only valid at the end of a downtrend or at a key support level. Engulfings inside a range, or worse, inside a strong uptrend, are noise. If you cannot clearly identify a prior downtrend on the same timeframe, skip the setup.
Rule 2: Size matters
The larger the engulfing candle relative to the average true range of recent candles, the stronger the signal. A small bullish engulfing inside a low-volatility consolidation often fails. If the engulfing candle is 1.5x to 2x the size of the prior 10 candles, the probability improves significantly.
Rule 3: Volume confirmation
Above-average volume on the engulfing candle makes the signal far more reliable. Low-volume engulfings are suspect and frequently fade within one or two sessions. Your volume indicator should clearly show that Candle 2 traded more contracts or coins than the recent average.
Rule 4: Use confluence
Single-signal trading is low-probability trading. A bullish engulfing pattern plus a major support level plus oversold RSI plus bullish divergence plus higher timeframe alignment is a high-probability setup. The more non-correlated signals that line up, the better.
Entry, Stop, Target Framework
- Aggressive entry: on the close of the engulfing candle. This gets you in early but risks a deeper pullback.
- Conservative entry: on a retest of the engulfing candle's midpoint or the prior resistance level that has now flipped to support. This gives a better price but sometimes leaves you behind if price runs without looking back.
- Stop loss: just below the low of the engulfing candle (the rejection wick). This is the invalidation point. If price closes below the engulfing low, the reversal has failed and you should be out.
- Target 1: the next swing high or resistance zone. Book partial profits here.
- Target 2: the prior breakdown level or higher timeframe resistance. Trail the remainder with a structure-based stop.
- Risk-to-reward minimum: 1:2. If the setup does not offer at least two units of reward per unit of risk, pass on it.
Example: Bullish Engulfing at BTC Support
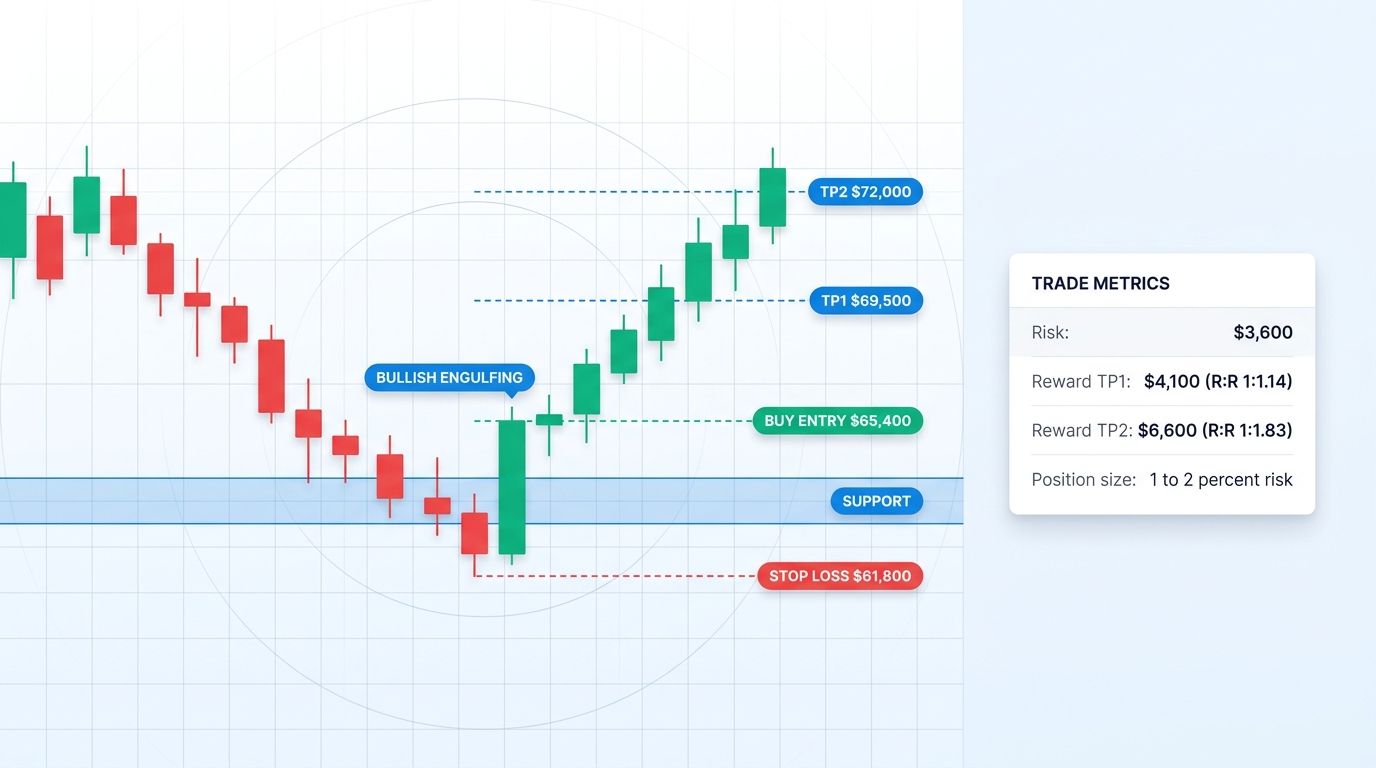
Assume BTC has been in a five-day downtrend, falling from $68,000 to $62,500 on the daily chart. Price approaches weekly horizontal support at $62,000. The daily candle that prints at that level opens at $62,800, trades down to $61,900, and closes at $65,400 on volume 40 percent above the 20-day average.
That daily candle fully engulfs the prior bearish session's body (open $64,200, close $62,800). You have a valid bullish engulfing pattern at a major support level with above-average volume and oversold daily RSI. Confluence is strong.
Entry: at the close of the engulfing candle, $65,400. Stop loss: just below the engulfing low at $61,800 (risk of $3,600 per BTC). Target 1: $69,500, the prior swing high. Target 2: $72,000, higher timeframe resistance (reward of $6,600). Position size: 1 to 2 percent of total capital at risk. On a $50,000 account risking 1 percent, that is $500 of risk, or roughly 0.14 BTC.
This is a hypothetical illustration, not a trade recommendation. The point is the process: pattern, context, volume, confluence, defined invalidation, defined targets.
Common Mistakes When Trading Bullish Engulfing
- Treating every engulfing pattern as a reversal signal without checking trend context. Most losing trades come from engulfings in the wrong place.
- Ignoring the prior trend. An engulfing inside a sideways range is almost always noise.
- Skipping volume confirmation. Without volume, the move rarely follows through.
- Setting stops too tight. Placing a stop inside the engulfing body instead of below the full low almost guarantees you get shaken out on normal retest behavior.
- Entering without confluence. Single-signal trading is low-probability. Always stack at least two or three non-correlated reasons before taking the trade.
- Taking engulfing signals on 1 to 5 minute charts. They appear constantly at those timeframes and fail often because of intra-session noise.
- Overtrading after one winner. One successful bullish engulfing trade does not mean the next five will work. Respect your process and your position sizing.
Bullish Engulfing in Crypto: What You Should Know
Crypto markets produce many bullish engulfing candles because of their high volatility and 24/7 trading. That means opportunity, but also more false signals. The reliability of an engulfing pattern crypto traders encounter depends on timeframe, pair, and market conditions.
- 4H and daily engulfings on BTC and ETH: high reliability when they form at clear support.
- Engulfings on low-cap altcoins: suspect. Many are produced by coordinated pumps that reverse as fast as they appear.
- Weekend engulfings: frequently fade by Monday. Weekend crypto volume is thin and moves often reverse once US liquidity returns.
- Engulfings with high volume during overlapping US and European trading hours: most reliable.
Always use higher-timeframe context. A daily bullish engulfing that lines up with weekly horizontal support is far more actionable than one in the middle of a range. Higher timeframes decide direction; lower timeframes decide timing.
How Altrady Helps You Trade Bullish Engulfing Patterns
Altrady is a multi-exchange crypto trading terminal built for active traders who need to scan, execute, and manage risk across dozens of pairs without tab-switching. Several features directly support a bullish engulfing trading strategy.
- Multi-chart view: monitor multiple pairs on one screen and spot engulfing formations as they complete across BTC, ETH, and altcoin pairs.
- Custom price alerts: set alerts at weekly and daily support so you are notified the moment price approaches an area where engulfing patterns would matter.
- SmartTrade orders: set entry, stop loss, and take-profit levels in a single order ticket. Lock in your 1:2 risk-reward structure before the candle closes.
- Backtest tool: validate your bullish engulfing plus confluence rules on years of historical data across multiple exchanges.
- Paper trading mode: practice identifying engulfing candles and managing exits without real money on the line.
- Risk Reward Calculator: compute exact position size based on your 1-2 percent risk rule, stop distance, and account equity.
Start a free Altrady trial and run through a few engulfing setups in paper trading mode first. Move to live trading only once your process is consistent.
Frequently Asked Questions
Is the bullish engulfing pattern reliable?
The bullish engulfing is one of the most reliable reversal patterns when used with proper context. At clear support levels after a defined downtrend with volume confirmation, win rates can reach 65 to 75 percent in backtested data across major crypto pairs. Without context, it is noise.
What is the difference between bullish engulfing and piercing line?
A bullish engulfing candle fully covers the previous candle's body from open to close. A piercing line only penetrates above the midpoint of the prior candle's body but does not fully engulf it. The bullish engulfing pattern is stronger because it shows a complete sentiment reversal within a single session.
Do I need volume to trade a bullish engulfing?
Volume confirmation is strongly recommended. An engulfing candlestick with above-average volume shows real commitment from buyers and makes follow-through far more likely. Low-volume engulfings often fail or fake out. If your chart does not show clear volume expansion on Candle 2, consider passing or waiting for a retest.
Can I trade bullish engulfing on the 15-minute chart?
You can, but signal quality drops significantly on lower timeframes. Intra-session noise produces many engulfing candles that fail within hours. Best results come from 4H, daily, and weekly engulfings at key structural levels. If you do trade 15-minute engulfings, use them as entry triggers within a higher timeframe bullish bias.
How do I set a stop loss for a bullish engulfing trade?
Place your stop loss just below the low of the engulfing candle, or below the combined low of both candles if the first candle extended lower. This is your invalidation point: if price closes below it, the reversal has failed. Never tighten the stop inside the engulfing body; normal retest behavior will shake you out before the trade works.
Conclusion
The bullish engulfing pattern is one of the strongest two-candle reversal signals in candlestick analysis, capturing a complete shift in market control from sellers to buyers within a single session. But the pattern only works when paired with proper trend context, volume confirmation, and confluence from support levels and higher timeframe alignment. Ignore the rules, and it becomes random noise. Respect them, and it becomes one of the highest-probability setups in any trader's toolkit.
Start a free Altrady trial, practice in paper trading mode, and move to real capital only once your process produces consistent results. Pattern recognition is a skill, and the bullish engulfing candle rewards traders who treat it as one.