Google Trends is not a trading system, but it is a useful window into crypto attention. When searches for crypto, Bitcoin, Ethereum, or a specific token rise quickly, the market is telling you that more people are trying to understand the same move at the same time.
In 2026, search interest became a story again because crypto attention cooled even while institutional products, stablecoins, and tokenized assets kept expanding. That disconnect is important for traders. The crowd can be quiet while infrastructure keeps growing, and the crowd can get loud after price has already moved.
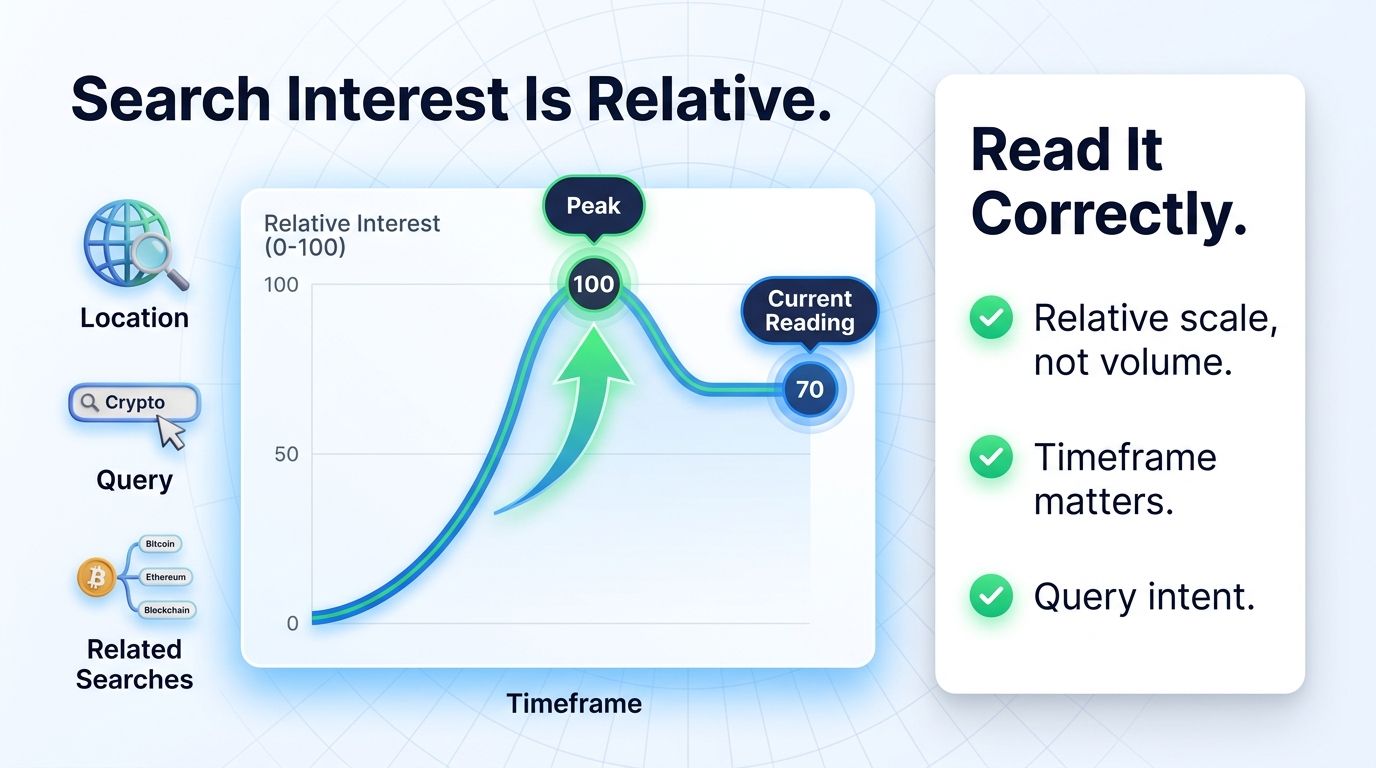
What Google Trends Actually Measures
Google Trends measures relative search interest, not absolute search volume. A reading of 100 represents peak interest for the selected term, location, and time range. Lower readings show interest relative to that peak, not the number of people searching.
That distinction matters. A crypto search reading near 30 does not mean 30 percent of all people are searching for crypto. It means interest is much lower than the peak in that comparison window. Traders should use it as a sentiment gauge, not a volume report.
- The scale is relative, not absolute.
- Location and timeframe change the result.
- Search spikes can lag the first price move.
- Related queries reveal what people are trying to understand.
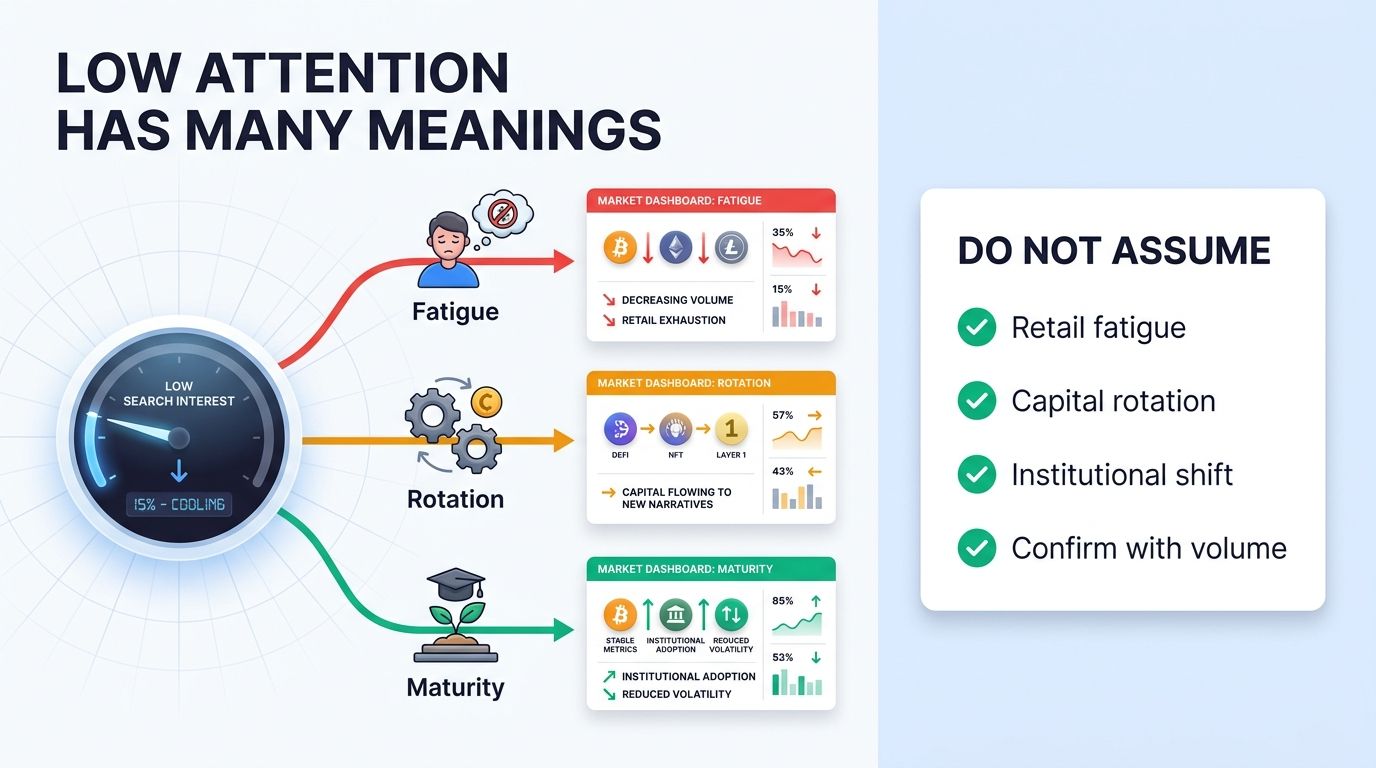
Why Low Search Interest Can Matter
Crypto.news reported in June 2026 that global Google search interest for cryptocurrency had fallen to the 26 to 30 range, far below the August 2025 peak. Bitcoin.com News earlier noted that U.S. search interest had also dropped sharply from mid-2025 highs before a short rebound.
Low attention can mean several things. It can show retail exhaustion after a drawdown. It can show that attention moved to AI stocks or other markets. It can also show market maturity, where institutions trade through ETFs and desks while casual search demand stays muted.
- Low searches can show retail fatigue.
- Quiet attention can coexist with institutional activity.
- Search weakness does not automatically mean a bottom.
- The interpretation depends on price and volume.
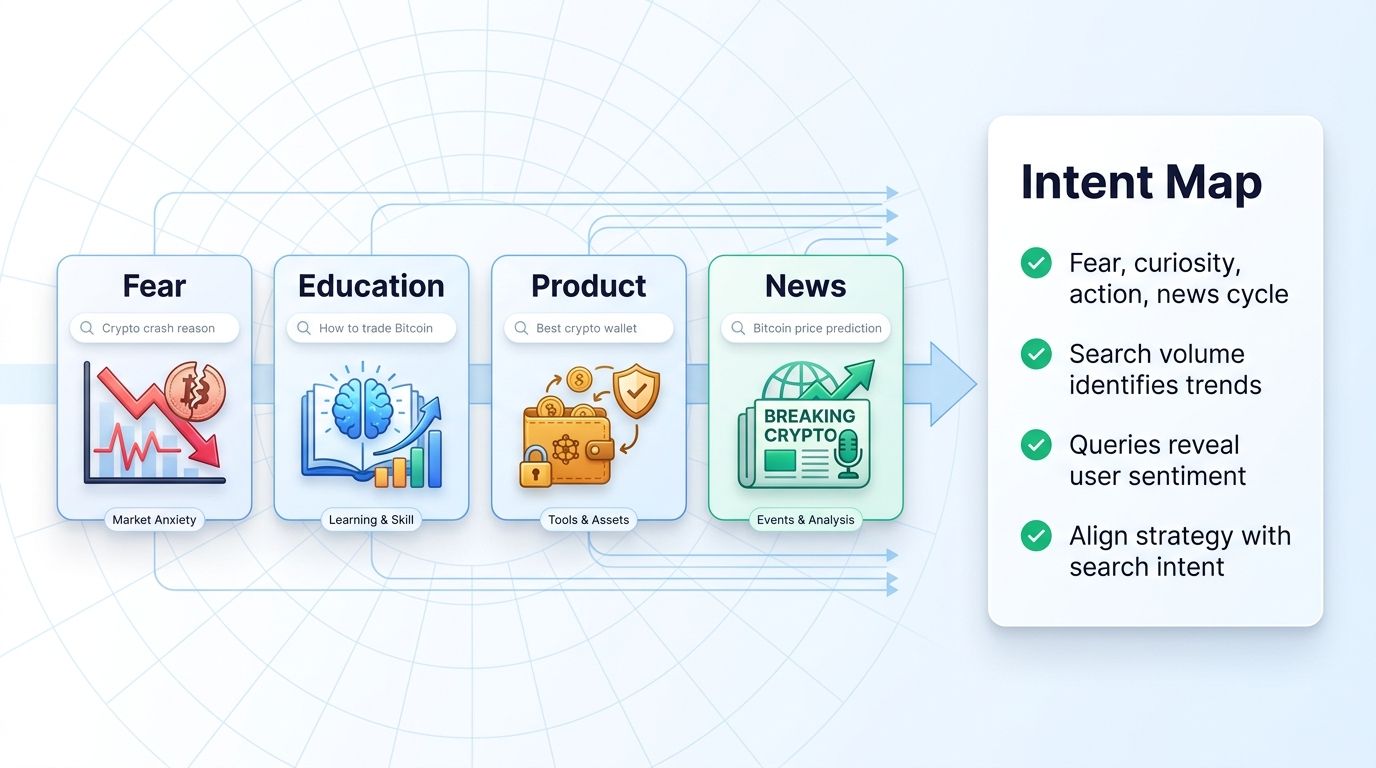
How to Use Related Queries
Related queries are often more useful than the main chart. If searches cluster around why is Ethereum crashing, Bitcoin ETF outflows, or crypto taxes, the intent is different from searches around how to buy Bitcoin or best crypto trading software. The query tells you what problem the market is trying to solve.
For content planning, related queries help identify topics worth explaining. For trading, they help show whether attention is driven by fear, curiosity, confusion, or momentum. Fear queries often rise after price moves. Educational queries can rise when new users enter. Product queries can rise when people are ready to act.
- Fear queries often follow selloffs.
- Educational queries can signal new audience interest.
- Product queries can show action intent.
- Repeated query clusters matter more than one spike.
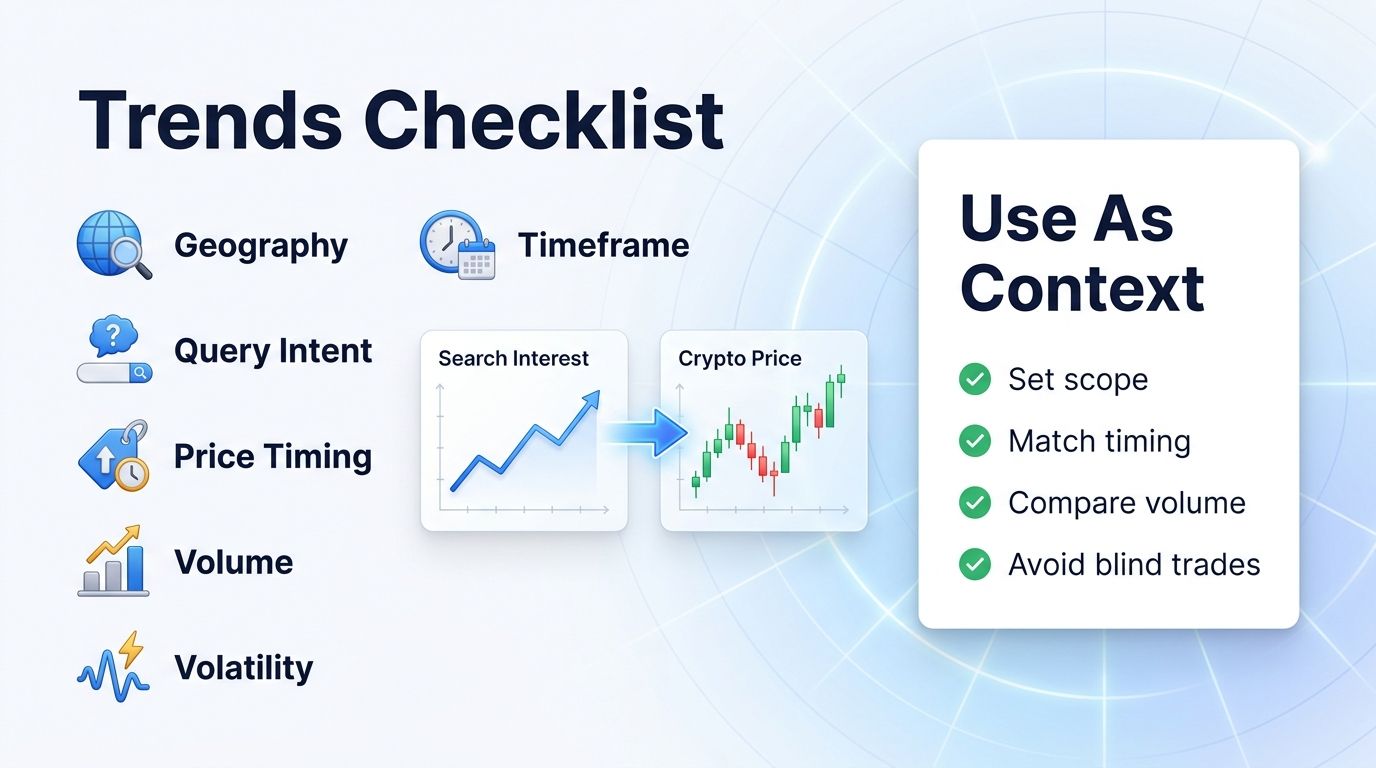
A Trader's Google Trends Checklist
A useful checklist starts with the query, geography, timeframe, and price context. For example, a one-month U.S. search spike has a different meaning than a global five-year trend. A spike that appears after a 20 percent move is different from a slow rise that appears before a breakout.
Then compare search interest with liquidity and volatility. If searches rise while volume expands and price breaks structure, attention may be supporting the trend. If searches rise after a liquidation event, the move may already be crowded.
- Set the right geography and timeframe.
- Match search spikes to price timing.
- Compare with volume and volatility.
- Use Trends for context, not entries.
Where Search Data Fits in a Trading Routine
Search data belongs near the top of the routine, before execution. It helps answer whether the market is paying attention and what people are trying to understand. It does not tell you the right entry, exit, stop, or size.
A trader can review Google Trends once or twice a week, record the main crypto terms, and save the strongest related queries. Then the trader can compare those notes with price action, ETF flows, exchange volume, funding rates, and news catalysts.
Over time, the notes become useful because they show how attention changes across cycles. Search peaks often feel exciting, but they can arrive late. Search lows can feel boring, but they sometimes appear near periods when patient traders prepare.
- Use search data before execution.
- Track the same terms over time.
- Compare attention with market structure.
- Avoid treating search spikes as signals.
Bottom Line
Google Trends is one of the simplest ways to observe crypto attention, but it is easy to overread. The data is relative, sampled, and sensitive to timeframe. It is a sentiment layer, not a trading trigger.
For Altrady users, the practical workflow is to use Trends to shape watchlists and research questions, then use Smart Trading, Signal bot, Grid bot, and the Risk Reward Calculator only when the actual market setup is clear.
The strongest signal is not search data by itself. It is the combination of attention, liquidity, volatility, price structure, and disciplined execution.
- Search interest helps explain attention.
- Related queries reveal market intent.
- Price and liquidity must confirm the story.
- Execution still needs risk controls.
A Weekly Search-Interest Routine
A simple routine is enough. Pick five core terms, such as crypto, Bitcoin, Ethereum, Solana, and stablecoin. Check them in the same country and timeframe each week. Then save the top related queries and rising queries that are relevant to trading, education, or market risk.
The goal is consistency. If the trader changes the timeframe every session, the signal becomes messy. A one-month U.S. view can help show what retail attention is doing now, while a twelve-month view can show whether the current move is small or meaningful compared with the larger cycle.
After that, connect the search note to the trading note. If searches are rising because price is crashing, the watchlist should focus on risk controls. If searches are rising around a new product or market structure topic, the watchlist may focus on education and opportunity mapping instead.
This turns Google Trends into a repeatable input. It does not decide the trade, but it tells the trader what the market is asking.
The routine can also protect content planning. If related queries repeat across several checks, they may deserve an evergreen guide. If they appear once during a dramatic headline, they may be better suited for a short market note.
That distinction keeps the calendar useful instead of reactive, especially during noisy market weeks.
- Use the same five to ten terms weekly.
- Keep geography and timeframe consistent.
- Tag each query by intent.
- Match search intent with market structure.
FAQ
Is Google Trends a crypto trading signal?
No. It is a sentiment and attention tool that should be combined with price, volume, liquidity, and risk analysis.
What does a Google Trends score of 100 mean?
It means peak relative interest for the selected query, location, and timeframe.
Why can low crypto search interest matter?
It can show weak retail attention, market fatigue, rotation into other assets, or a more institution-driven cycle.
How should traders use related queries?
Use related queries to understand market intent, such as fear, education, news demand, or product research.