
Most retail traders chase price after the fact. The Donchian Channel strategy flips that script - it tells you exactly when a trend has begun and gives you a mechanical entry, stop, and exit. Built by Richard Donchian in the 1950s and battle-tested by the Turtle Traders, the system still works in crypto today because volatility plus 24/7 markets create the persistent trends Donchian was designed to catch.
What Is the Donchian Channel?
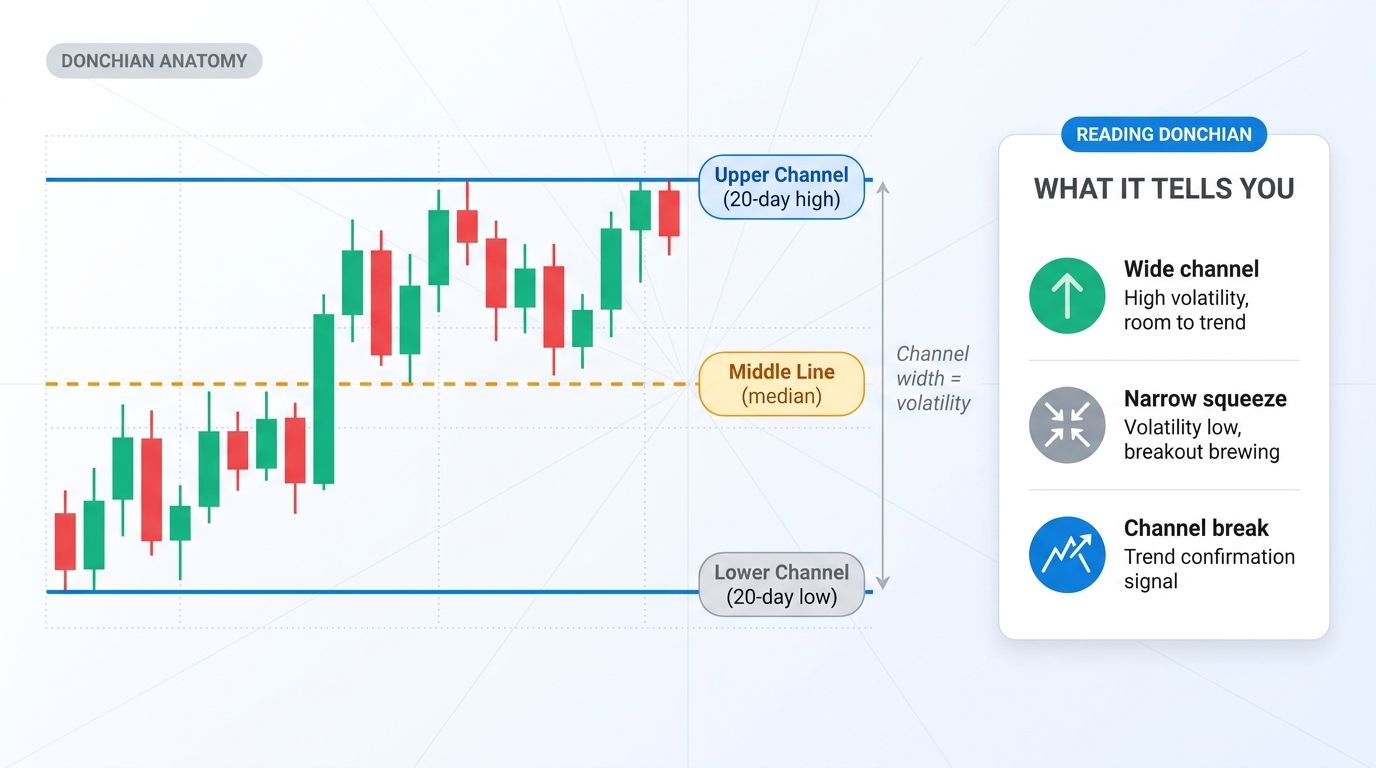
A Donchian Channel is a price band built from the highest high and lowest low over a fixed lookback period. Pick a period (20 days is the classic), and the indicator draws three lines on your chart: the upper channel at the highest high of those 20 days, the lower channel at the lowest low, and an optional middle line at the median between them.
Unlike Bollinger Bands or Keltner Channels, Donchian uses literal price extremes, not statistical calculations. There is no smoothing, no standard deviation, no exponential weighting. The upper line is simply the highest high. The lower line is simply the lowest low. This makes Donchian uniquely honest about what price has actually done over the lookback period.
Richard Donchian developed the indicator in the 1950s while working as a commodities broker. His "4-week rule" - buy when price closes above the 4-week high, sell when it closes below the 4-week low - was the seed that grew into the Turtle Trading System and modern systematic trend-following.
How to Calculate Donchian Channels
The math is simple enough to compute by hand if you really want to:
- Upper Channel: Highest high over the last N periods.
- Lower Channel: Lowest low over the last N periods.
- Middle Line: (Upper + Lower) / 2.
The classic period is 20 (the "20-day high"), but the system works on any timeframe. For crypto, 20 candles on a 4-hour chart gives roughly 3.3 days of price history. On a daily chart, 20 candles equals about a month. The longer the period, the rarer and more meaningful the breakouts.
Most charting platforms (TradingView, Altrady, MetaTrader) include Donchian as a built-in indicator. You configure the period, and the indicator paints the channel lines automatically.
Reading Donchian Channels: Volatility, Squeezes, and Breakouts
The shape of the channel itself tells you something before any breakout fires:
- Wide channel = high volatility. Price has moved a lot in both directions over the lookback period. Trends inside a wide channel can extend further before reversing.
- Narrow channel (squeeze) = low volatility. Price has consolidated. Squeezes often precede explosive breakouts because the range gets compressed before energy releases.
- Channel break = a definitive shift. Price closing outside the channel means the asset has made a new N-period extreme. That extreme is the trend signal.
Watching the channel width over time also reveals regime shifts. A market that has been range-bound (narrow channel for weeks) and suddenly widens is signaling a new trend phase. Crypto traders who pay attention to channel width often catch the start of bull or bear cycles before momentum traders do.
The Donchian Breakout Strategy
The simplest, most-tested Donchian strategy follows three rules:
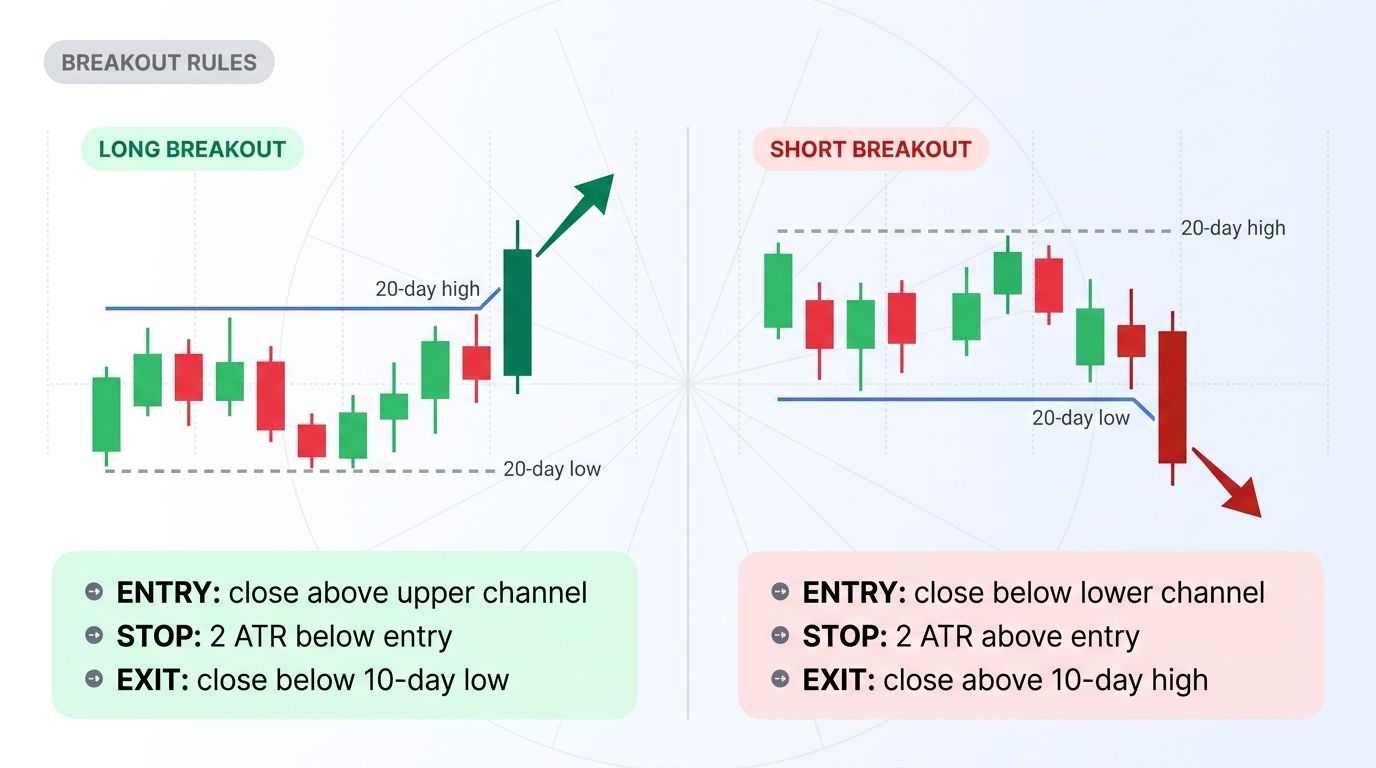
Long entry rules
- Wait for a candle to close above the upper Donchian channel (use closing price, not intraday wicks).
- Enter at the open of the next candle.
- Place stop loss 2 ATR below entry (or below the most recent swing low, whichever is closer).
- Exit when price closes below the 10-day low (a tighter Donchian channel for exits).
Short entry rules
- Wait for a candle to close below the lower Donchian channel.
- Enter at the open of the next candle.
- Stop loss 2 ATR above entry.
- Exit when price closes above the 10-day high.
The key word is close. Intraday spikes that pierce the channel but close back inside do not count. The system is designed to filter out fakeouts by demanding a full-candle commitment beyond the channel boundary.
Stop Loss and Position Sizing with Donchian
A breakout entry without a defined stop is gambling. The Donchian system pairs naturally with ATR-based position sizing - the same logic the Turtles used.
The formula:
Position Size (units) = (Account Value x Risk %) / (2 ATR)
If your account is $10,000, you risk 1% per trade, and the 14-day ATR is $300, your unit size is ($10,000 x 0.01) / ($300 x 2) = 0.166. Round down to a tradable size on your exchange.
This volatility-adjusted approach means a high-volatility asset (think SOL or AVAX during a hot run) gets a smaller position than a low-volatility asset (BTC during consolidation), even though risk per trade stays constant at 1%. The math protects you from getting cooked when the next breakout candle goes against you.
Donchian vs Bollinger Bands vs Keltner Channels
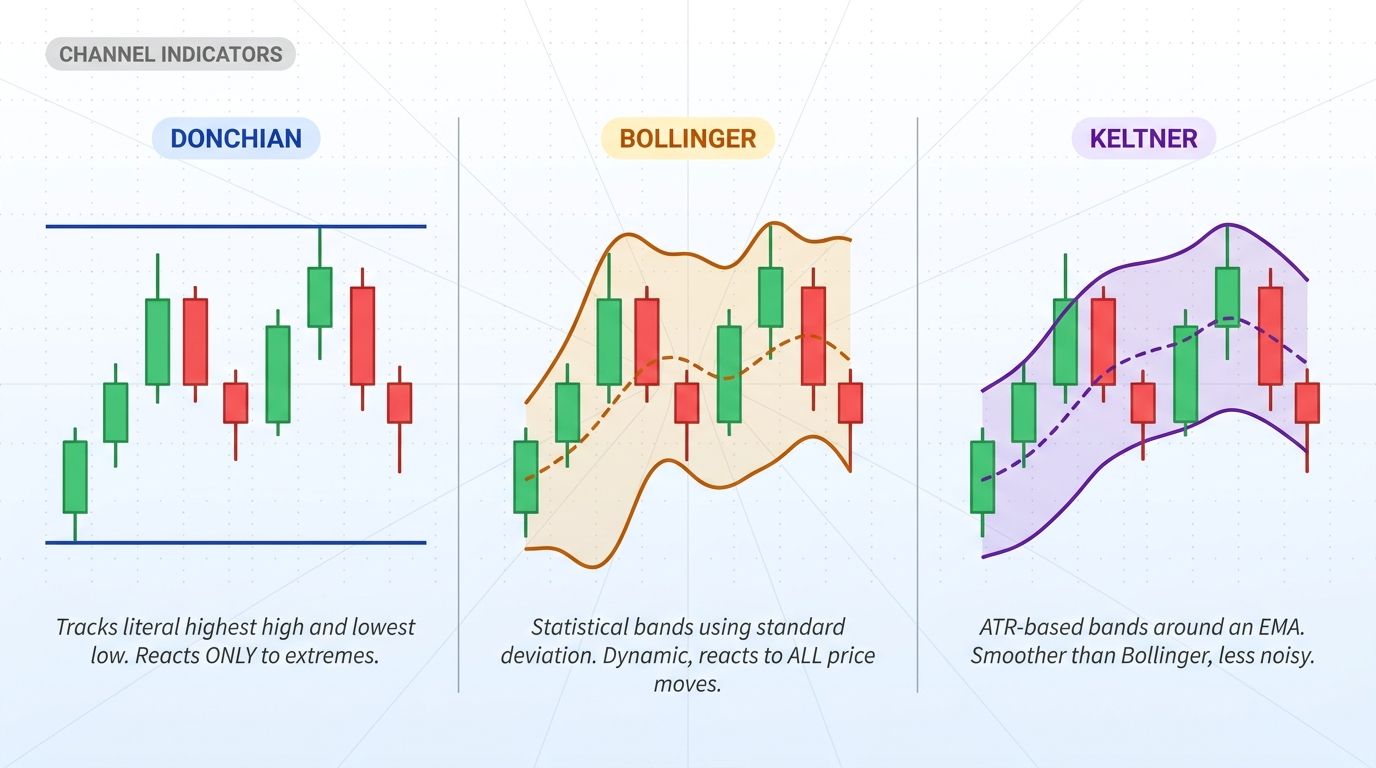
Three popular channel indicators look similar but behave differently:
- Donchian tracks the literal high and low of the last N periods. The lines stay flat until a new extreme prints, then they jump. Reactive only to extremes.
- Bollinger Bands use 2 standard deviations from a moving average. The bands expand and contract continuously with volatility. Reactive to all price changes.
- Keltner Channels use ATR multiples around an EMA. Smoother than Bollinger because EMA + ATR are both averages. Reactive but less noisy.
For breakout trading, Donchian is the clearest signal. A new 20-day high either prints or it does not. There is no ambiguity about whether the band has "expanded" or "tightened." For trend confirmation, Keltner can complement - if price is trending above the Keltner middle line AND breaks the Donchian upper, the trend is strong.
Most pro systematic traders run all three and treat the agreement between them as the highest-conviction signal.
Why Donchian Works in Crypto Markets
Crypto is unusually well-suited to Donchian-based strategies for three structural reasons:
- Trends are persistent. Major crypto moves often last weeks or months. Donchian captures the start of these moves on the breakout candle and rides them with mechanical exit rules.
- Volatility is high. Wide channels in crypto mean each 20-day breakout has more room to extend before reversing. Trends in BTC/ETH/SOL routinely run 30-50% before the exit signal triggers.
- 24/7 markets remove gap risk. Donchian breakouts in traditional markets sometimes happen on Sunday-night gaps that you cannot trade. Crypto trades continuously - you get the signal and you get the entry.
Backtests on BTC daily candles since 2017 show the 20/55 Donchian system (Turtle-style) producing positive returns through both 2017 bull, 2018 bear, 2020-21 bull, 2022 bear, and 2023+ recovery. Win rate is typically 30-40% with average winners 3-5x average losers.
Common Mistakes Trading Donchian Channels
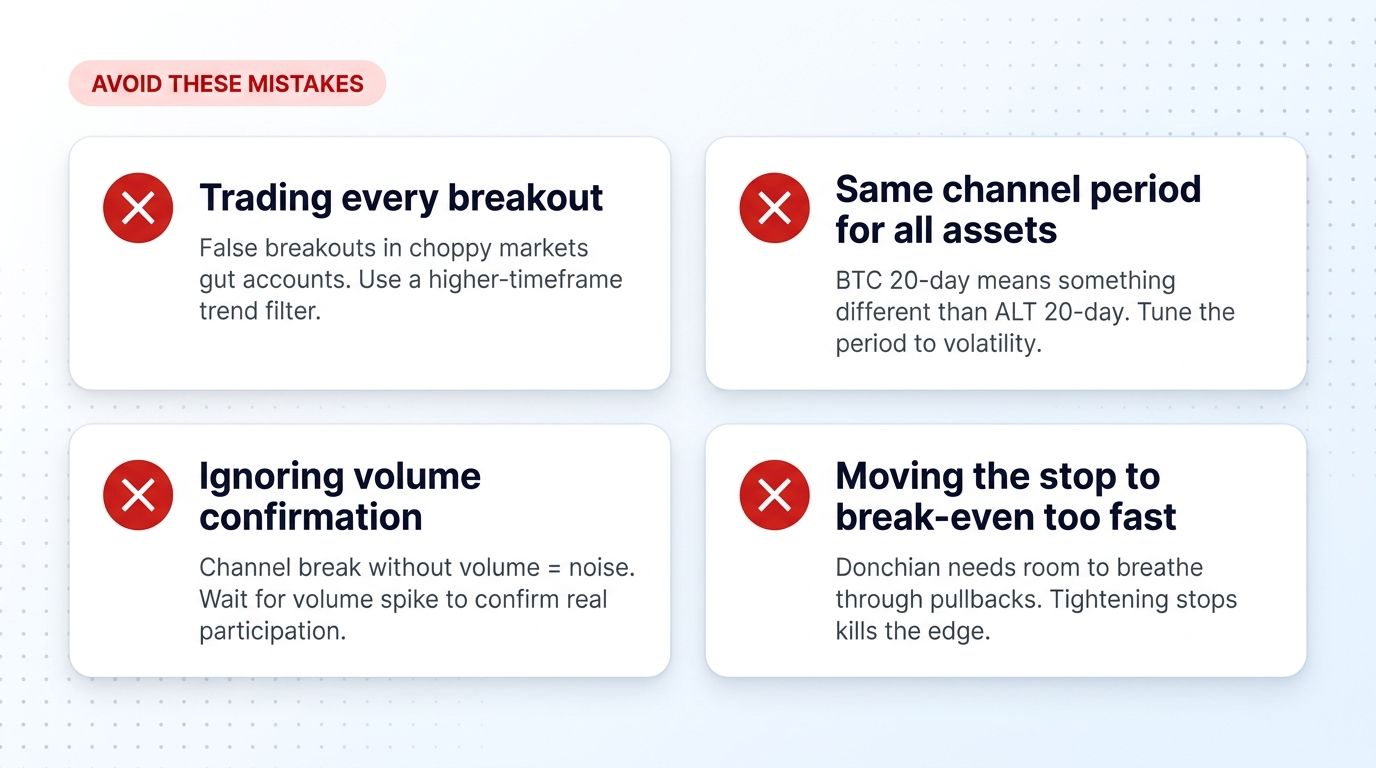
The system is mechanical, but most traders find ways to break it:
- Trading every breakout in choppy markets. Donchian assumes a trending environment. Sideways markets generate false breakouts that whipsaw accounts. Add a higher-timeframe trend filter (200 EMA on the daily, for example) and only take breakouts in the direction of the larger trend.
- Same period for every asset. 20 days on BTC is not the same as 20 days on a low-cap altcoin. Tune the lookback to the asset's typical volatility cycle. More volatile assets often need longer periods to filter noise.
- Ignoring volume. A breakout on weak volume is suspicious. Real participation shows up as a volume spike on the breakout candle. Without volume confirmation, the breakout often fails.
- Moving stops to break-even too early. Donchian needs room to breathe through normal pullbacks. Tightening stops to "lock in profit" prematurely turns winners into break-even trades and destroys the edge.
- Skipping the exit signal. Donchian winners come from holding through 20-30% pullbacks while waiting for the 10-day low to break. Traders who eyeball the chart and exit "because the trend looks tired" miss the back half of every big move.
Using Donchian in an Altrady Workflow
Altrady gives you the tools to run a Donchian system cleanly across multiple exchanges from one terminal.
- Multi-exchange charts with built-in Donchian Channel indicator. Monitor BTC, ETH, SOL, and major altcoins simultaneously across Binance, Coinbase, Kraken, and others without juggling tabs.
- Smart Trading order types let you bracket each entry with a 2 ATR stop and a Donchian-exit trigger in a single ticket. The system runs even when you are not at the screen.
- Quick Scanner filters across hundreds of pairs to surface assets currently breaking 20-day or 55-day highs or lows, so you never miss a setup.
- ATR Risk Reward Calculator automates the unit math. Plug in account size, risk %, and current ATR, and the calculator returns the exact unit size to trade.
- Paper trading environment lets you run the full Donchian system on live data without risking capital. Build conviction in the rules before deploying real money.
Start with a free trial, run Donchian entries on BTC and ETH for a quarter, and let the rules do the work.
Conclusion
The Donchian Channel strategy is one of the simplest, most-tested trend-following systems in trading history. It survived 70 years across commodities, currencies, and equities because the underlying logic - buy when price proves it can make a new high, sell when it proves it cannot - is timeless. Crypto markets, with their persistent trends and high volatility, are an ideal environment for the system today.
The hard part is not understanding the rules. It is following them through 4-6 month drawdown periods when nothing breaks out cleanly. Traders who build the discipline to take every signal during the dry spells get paid disproportionately when the next big move arrives.
Frequently Asked Questions
What period should I use for Donchian Channel in crypto?
The classic 20-period is a good starting point on daily charts. For 4-hour charts, 20 periods captures about 3 days. Many crypto traders use 20 for tactical entries (fast signals) and 55 for higher-conviction trend confirmation, mirroring the original Turtle System.
Does the Donchian Channel strategy work in sideways markets?
No. Donchian is a trend-following system - it generates losses in range-bound markets because false breakouts whipsaw entries. Pair it with a higher-timeframe trend filter (200 EMA, for example) and only take breakouts when the larger trend agrees.
What is the difference between Donchian and Bollinger Bands?
Donchian uses literal highest high and lowest low over a fixed period - lines stay flat between extremes. Bollinger Bands use 2 standard deviations from a moving average - the bands expand and contract continuously with volatility. Donchian gives clearer breakout signals; Bollinger gives smoother volatility readings.
Can I use Donchian Channels for shorting in crypto?
Yes. The same logic applies in reverse: a candle closing below the lower Donchian channel triggers a short entry, with a stop placed 2 ATR above and an exit on a 10-day high break. Crypto perpetual futures and margin pairs make short Donchian setups easy to execute.
How long should I hold a Donchian breakout trade?
The system holds until the exit signal triggers - either a 10-day low (for long trades) or a 10-day high (for shorts). Holding times vary from a few days to several months depending on how the trend extends. The average winning Donchian trade in crypto is 4-8 weeks.
What ATR period should I pair with Donchian for stops?
14-period ATR is the standard. Some traders use 20-period ATR to align with the channel period. The exact ATR period matters less than consistency - pick one and use it for both stop placement and position sizing.
Is Donchian Channel free to use on charting platforms?
Yes. Donchian Channel is a built-in indicator on TradingView, Altrady, MetaTrader, and most charting platforms. There is no licensing fee or proprietary code - it is a public indicator from 1950s technical analysis.
If you want to put Donchian Channel rules to work, Altrady gives you the multi-exchange charting, smart trading order types, ATR-based position sizing, and paper trading environment to implement the system end to end. Sign up for a free trial and run the rules on a real exchange feed without risking capital.