Crypto traders get often stuck in a FOMO rut, especially when it comes to highly volatile markets. But there’s a technical indicator that seems ideal when trading cryptocurrencies and deciding when to enter or exit a trade.
This indicator is the average true range (ATR) that specifically measures market volatility.
Below, you’ll learn all you need to know about this indicator, how it works, and the best practices to use the ATR in your crypto trading approach.

What is The Average True Range (ATR) Indicator
Introduced by the same J. Welles Wilder Jr., who also created the relative strength index (RSI) and the parabolic SAR indicators, the average true range shows cryptocurrency traders if the market goes through high or low volatility.
While it offers valuable insights in terms of risk management strategies, the ATR has its limitations. For one, it can give mixed signals since it doesn’t show if an asset’s price will change its direction. Second, it’s a subjective indicator because it doesn’t use a reference point to determine market volatility. That’s why you should always compare the ATR against its earlier values to get a clearer view of a trend’s strength or weakness.
How Does the ATR Work?
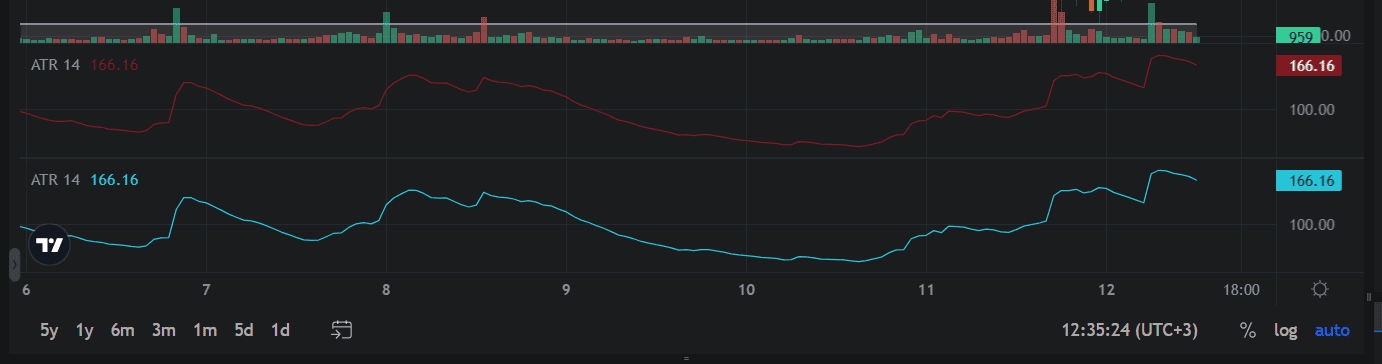
ATR quantifies the degree of price fluctuations within a given time frame.
The ATR is calculated using a straightforward formula:
ATR = [(Previous ATR) x (n - 1) + True Range] / n
Where:
- Previous ATR: The ATR value of the previous period.
- True Range: The greatest of the following three values:
- The current high minus the current low.
- The absolute value of the current high minus the previous close.
- The absolute value of the current low minus the previous close.
- n: The number of periods used in the calculation ( usually, 14 is used as the number of periods in the calculation)
Interpreting Average True Range Values
Understanding the clues behind the ATR’s numbers is fairly simple:
-
Low ATR Values
When the ATR values are low, it suggests that the market is experiencing a period of low volatility. This can be seen as a calm or consolidating market. Traders might consider strategies that involve range-bound trading, as breakout strategies may not lead to favorable results. -
High ATR Values
High ATR values indicate a period of increased market volatility. In this case, traders should exercise caution as price swings are more significant. It's a good moment to consider strategies that can capitalize on volatile price movements, such as trend-following or momentum trading.
Practical Applications of the Average True Range in Crypto Trading
The practical ways to incorporate ATR into your crypto trading strategy include:
-
Set stop-loss orders
Multiply the ATR value by a factor (e.g., 2 or 3) and you can determine an appropriate distance for your stop-loss from your entry point. This adaptive approach accounts for the current market volatility, reducing the risk of premature stop hits. -
Determine position size
The ATR indicator can also help you determine the ideal position size for your trades. In high-volatility markets, traders may reduce their position sizes to manage risk effectively. Conversely, in low-volatility markets, you may take larger positions to capitalize on potential breakouts -
Identify trend strength
In addition to measuring volatility, the ATR indicator can indicate the strength of a prevailing trend. A rising ATR may suggest increasing momentum, while a falling ATR could indicate a weakening trend. This insight allows you to adapt your trading strategy accordingly.
Combining The Average True Range (ATR) with Other Technical Indicators
ATR is most powerful when used in conjunction with other technical indicators, like:
-
Moving Averages
The ATR can help you determine the optimal length for your moving averages, as it provides insights into market volatility. In times of high volatility, longer moving averages may be more appropriate, while shorter moving averages are suitable for calmer markets. -
Relative Strength Index (RSI)
The Relative Strength Index (RSI) indicator shows the speed and change of price movements. When combined with the ATR, it can help you identify potential trend reversals and overbought or oversold conditions more accurately.
For instance, if the ATR value is high (indicating strong market volatility), and the RSI is above 70 (suggesting overbought conditions), this means that the market is becoming more volatile and more bullish. It’s a sign that the market is in a strong uptrend and you can consider a buying opportunity. -
Bollinger Bands
Bollinger Bands consist of a middle band (typically a simple moving average) and two outer bands that represent the ATR's value. These bands become wider or contract more based on market volatility.
By incorporating the ATR into Bollinger Bands, you gain a deeper understanding of price movements within a specific range, if a crypto asset is overbought or oversold. Additionally, a wide band will signal high volatility, while a narrow band suggests low volatility.

Conclusion
If you understand how the ATR works and integrate it into your trading strategy, you can make more informed decisions, manage risk effectively, and potentially increase your ROI.
You can backtest your trading strategy with the help of Altrady. Get access to an unlimited and free paper trading plan, so you can practice crypto trading.
Delve into the analysis of ATR signals along with other technical indicators and trade assets across multiple cryptocurrency exchanges.