
The Elder Ray Index is designed to show whether buyers or sellers have stronger pressure around a trend. It does this with two components often called bull power and bear power.
For crypto traders, that can be useful because strong candles do not always tell the whole story. A market can rise while buying pressure weakens, or pull back while the broader trend remains healthy. Elder Ray helps organize that tension.
What Elder Ray Measures
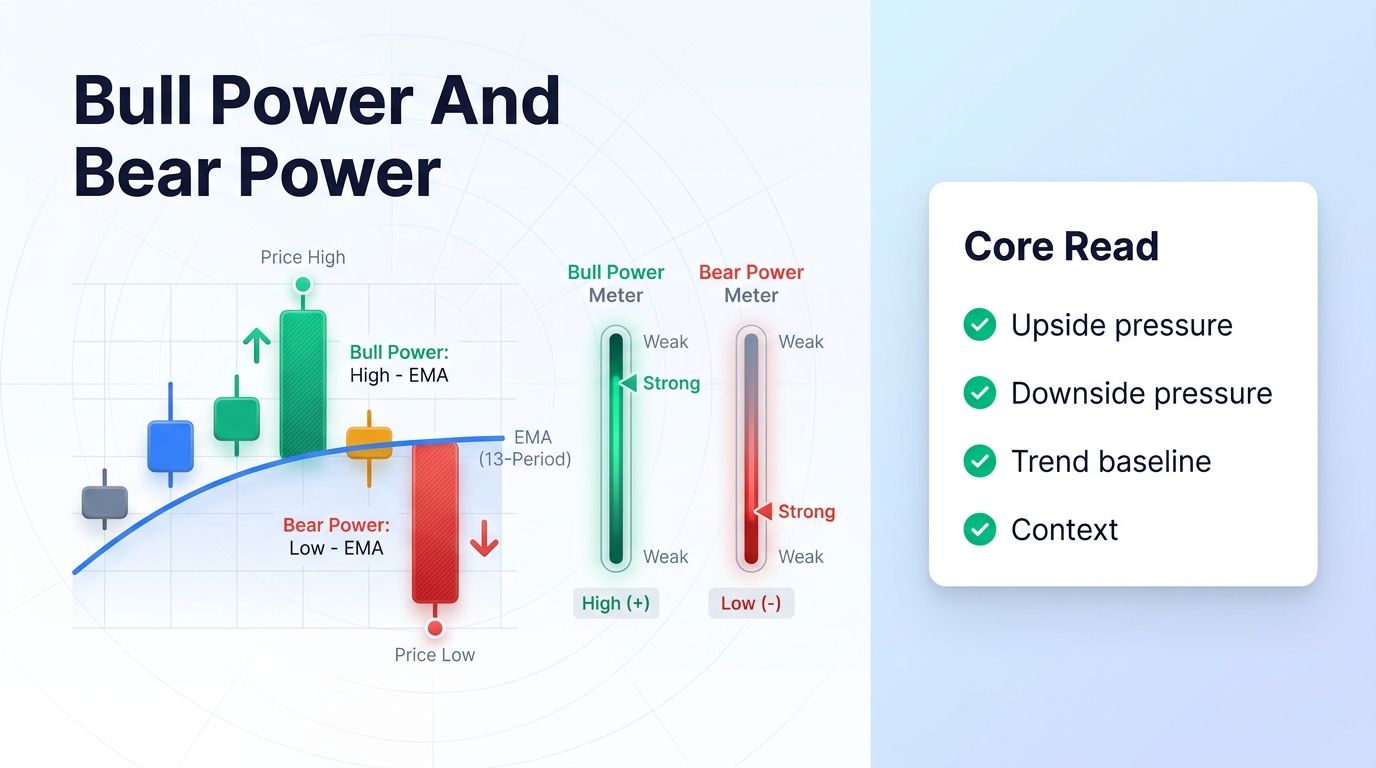
Elder Ray compares price extremes with an exponential moving average. Bull power looks at how far the high is above the average. Bear power looks at how far the low is below the average. Together, they show pressure around the trend baseline.
If bull power is positive and rising, buyers may be gaining strength. If bear power is deeply negative and worsening, sellers may be pressing harder. The reading matters most when paired with the trend direction.
- Bull power reflects upside pressure.
- Bear power reflects downside pressure.
- The moving average acts as the trend baseline.
- Pressure readings need trend context.
How to Read Bull Power
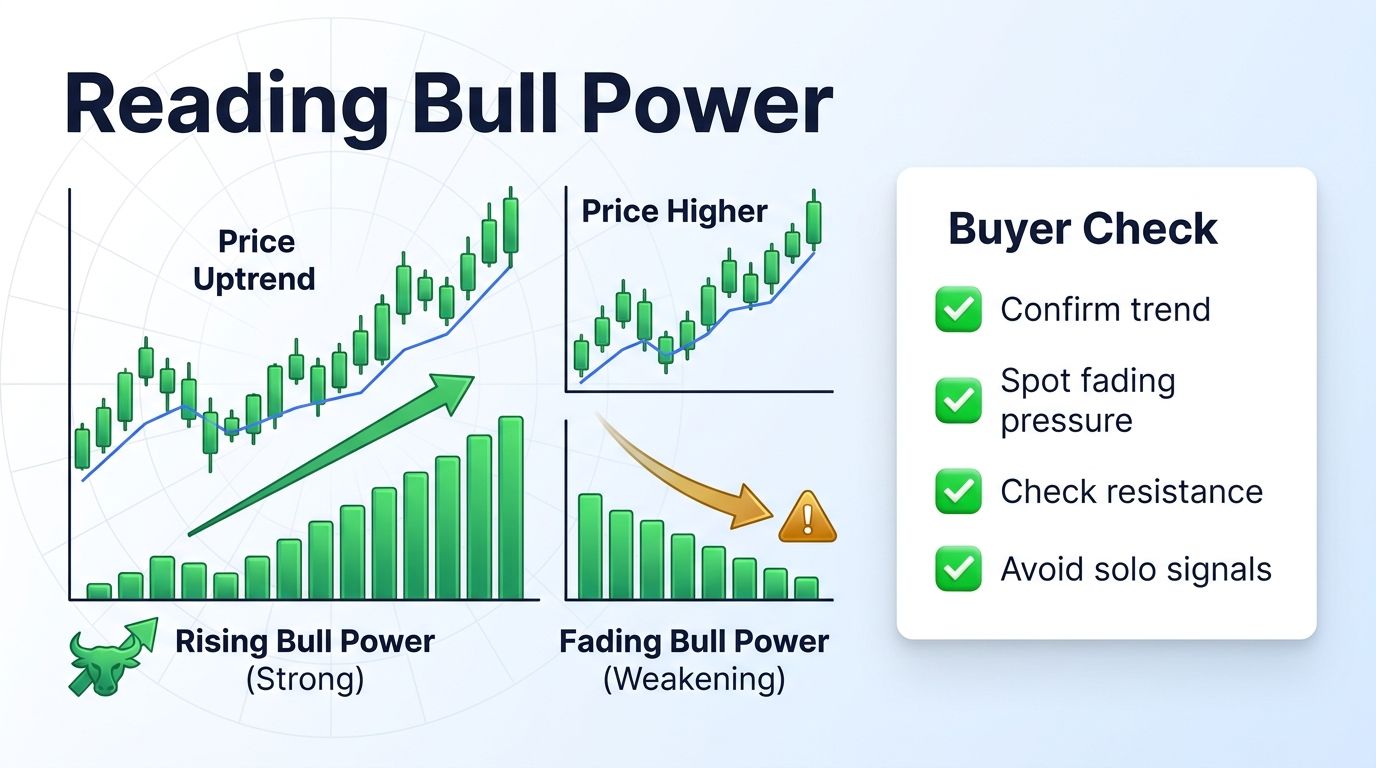
Bull power is strongest when buyers push highs well above the moving average. During an uptrend, rising bull power can confirm that buyers still control momentum. Falling bull power during a price rally can warn that momentum is weakening.
That warning does not automatically mean short the market. It means the trader should look more closely at volume, resistance, and structure. Divergence is a review signal before it is an entry signal.
- Rising bull power can confirm an uptrend.
- Falling bull power can warn of weak buying pressure.
- Divergence needs confirmation.
- Resistance and volume still matter.
How to Read Bear Power
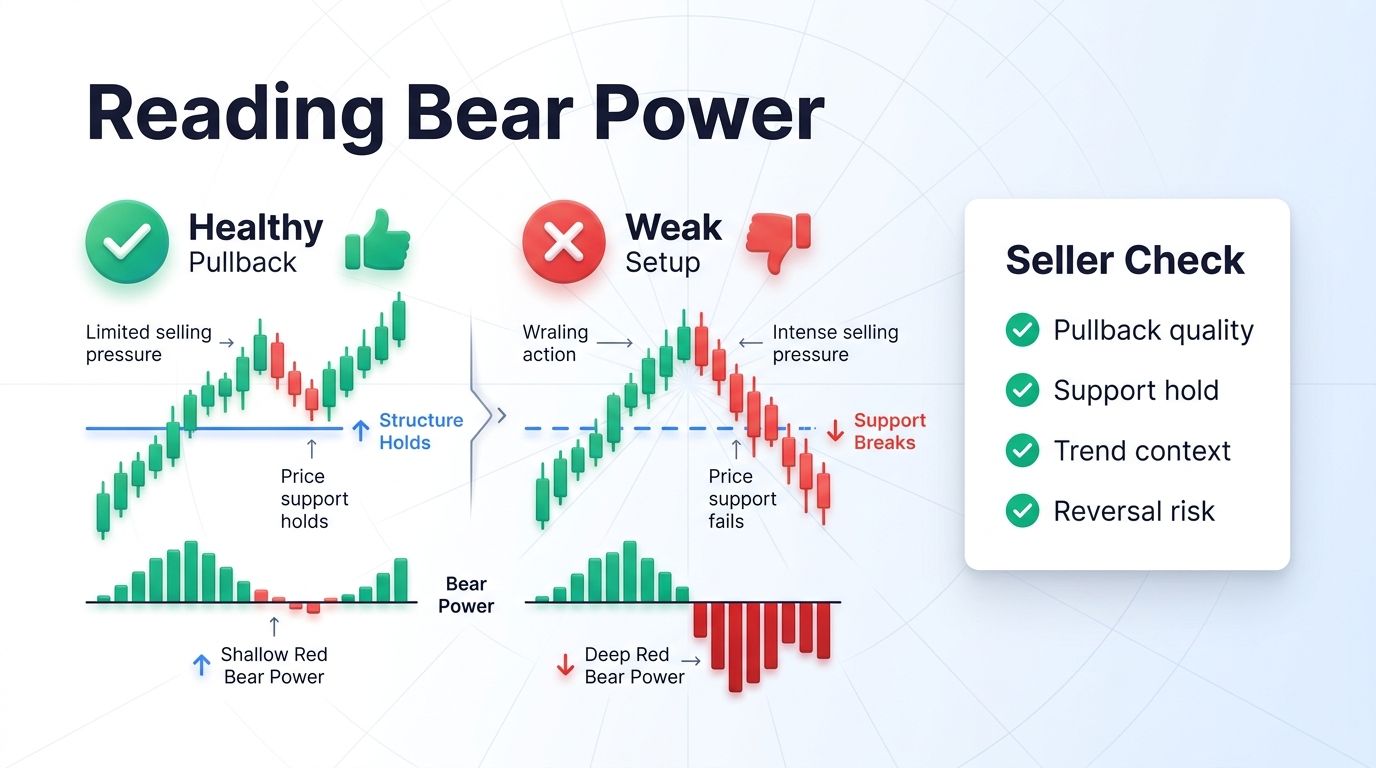
Bear power shows how strongly sellers can push price below the moving average. In a downtrend, falling bear power can confirm seller control. In an uptrend, a shallow bear power reading during pullbacks can show that sellers are not doing much damage.
This is where Elder Ray can help trend traders stay patient. A pullback is not automatically a reversal. If bear power stays controlled and price holds structure, the trend may still be intact.
- Deepening bear power can confirm seller control.
- Shallow bear power can show healthy pullbacks.
- Trend context decides the interpretation.
- Use structure to separate pullback from reversal.
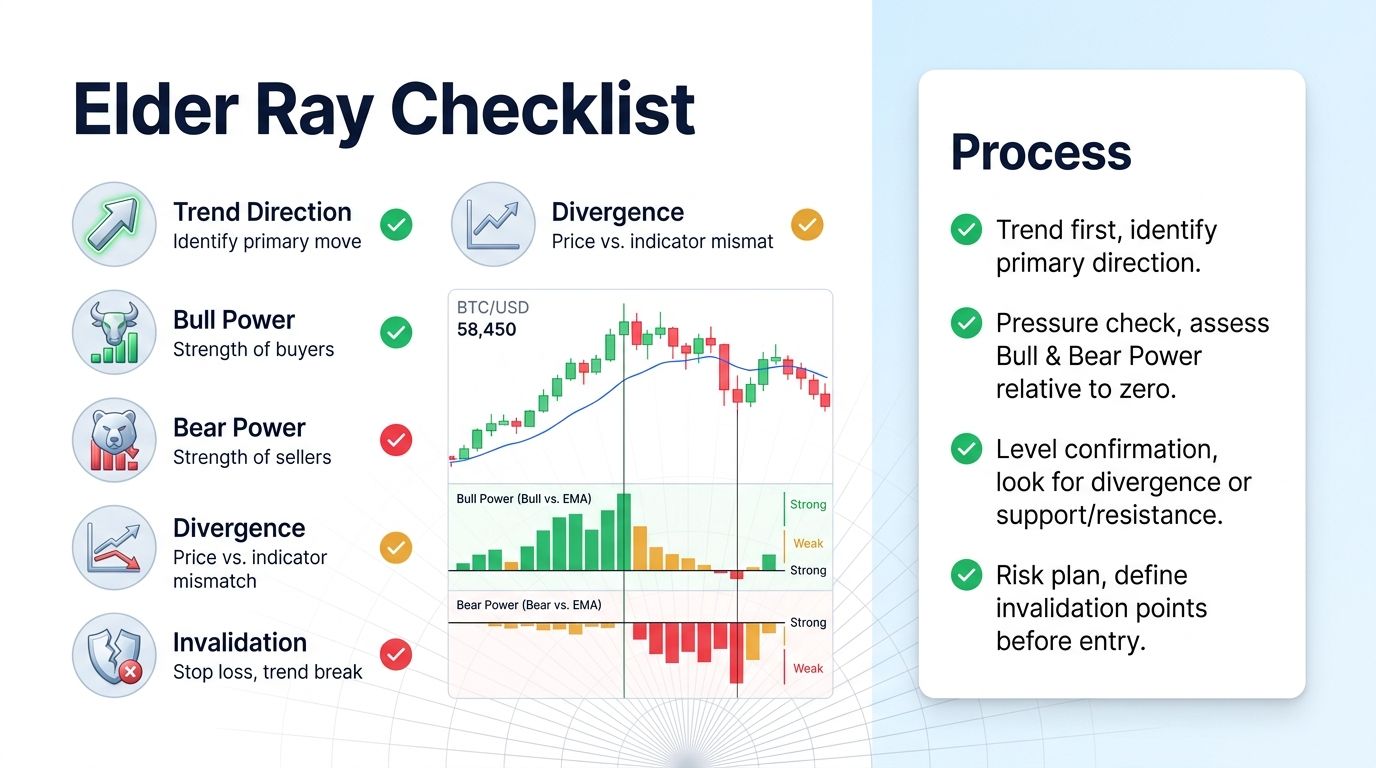
A Practical Elder Ray Checklist
A practical checklist starts with trend direction. If the trend is up, bull power should support the move and bear power should stay controlled during pullbacks. If the trend is down, bear power should dominate and bullish pressure should fail near resistance.
The final step is risk planning. Elder Ray can help frame pressure, but it does not define position size. Use the chart level, invalidation, and risk-reward before entering.
- Identify trend direction first.
- Check whether bull or bear power confirms it.
- Look for pressure divergence near key levels.
- Define invalidation before entry.
Best Uses and Limits
Elder Ray works best when the trader already has a trend context. It can show whether pullbacks are healthy, whether momentum is fading, and whether buyers or sellers are losing control near important levels.
It is weaker when the market has no direction. In a tight range, bull and bear power can flip without offering clean information. In those conditions, traders should reduce confidence and wait for structure.
- Use it to judge trend pressure.
- Watch pullback quality.
- Be careful in tight ranges.
- Confirm with levels and volume.
How to Add the Indicator to a Trading Routine
Elder Ray Index for Crypto should enter the routine as a filter, not as a command. Start with the higher-timeframe market structure, then ask whether the indicator supports that structure. If the chart says the trend is weakening but the indicator still looks bullish, the trader should wait for alignment rather than force the setup.
The next step is to define the decision point. The indicator can help identify pressure, trend quality, or momentum, but the trade still needs a price level. That level might be a breakout, a retest, a support zone, or a failed low. Without a level, the indicator can create vague confidence instead of a trade plan.
Before using it live, test the indicator on the exact timeframe and asset group you trade most often. Large-cap assets, volatile altcoins, and thin markets can all react differently. A rule that looks clean on Bitcoin daily candles may be too slow or too noisy on a smaller intraday pair.
Finally, record the result. After each trade, note whether the indicator improved timing, avoided a bad entry, or added noise. A tool earns a place in the routine only if it improves decisions over a sample of trades. One clean example is not enough.
- Start with market structure.
- Use the indicator as confirmation.
- Attach the signal to a price level.
- Review whether it improves decisions.
When to Ignore the Signal
Every technical indicator has conditions where it becomes less useful. Low-liquidity markets, sudden news moves, thin order books, and tight ranges can all create signals that look clean in the panel but fail on the chart. Crypto traders should be especially careful with smaller assets where one large order can distort the signal.
It is also smart to ignore a signal when the risk-reward is poor. A bullish reading near heavy resistance is not automatically a good long setup. A bearish reading after a large drop may arrive too late. The chart location decides whether the signal is tradable.
A third reason to ignore the signal is overlap. If several indicators are built from similar price data, they may appear to confirm each other while actually repeating the same information. A cleaner stack uses one trend tool, one momentum or pressure tool, and one risk framework instead of many versions of the same idea.
When in doubt, reduce the signal to a question instead of an action. Ask what the indicator is warning about, then decide whether price, volume, and risk-reward support the same answer. If the answer is mixed, wait. Do not rush.
- Be cautious in thin or news-driven markets.
- Reject signals with poor risk-reward.
- Avoid duplicate indicator confirmation.
- Let chart location decide trade quality.
Bottom Line
The Elder Ray Index gives crypto traders a structured way to read buying and selling pressure around a trend baseline. Bull power and bear power can make pullbacks and momentum shifts easier to interpret.
Use it as a pressure gauge, not as a complete trading system. The best setups still require trend context, chart structure, volume, and risk control.
- Bull power shows buyer pressure.
- Bear power shows seller pressure.
- Trend context gives the signal meaning.
- Risk planning turns the reading into a trade.
FAQ
What is the Elder Ray Index?
It is an indicator that compares price highs and lows with a moving average to estimate bull power and bear power.
What is bull power?
Bull power measures how far the high is above the trend baseline, showing upside pressure.
What is bear power?
Bear power measures how far the low is below the trend baseline, showing downside pressure.
Is Elder Ray useful for crypto?
It can help read trend pressure and pullback quality, but it should be confirmed with structure and risk rules.