Intro
Crypto markets move quickly, and that speed makes it hard to tell whether price is truly trending or just reacting to short-term noise. The EMA 20, EMA 50, and EMA 200 setup is popular because it simplifies that problem. It gives a fast view of momentum (EMA 20), a mid-term trend filter (EMA 50), and the broader market bias (EMA 200).
This guide explains how the EMA trio works, when it performs best, and how traders use it for scalping, day trading, and swing trading. The goal is simple: turn a common indicator into a repeatable EMA trading strategy with clearer trend context, better timing, and fewer false signals.
Understanding the Popularity of EMAs
Exponential Moving Averages (EMAs) are one of the first tools many traders learn because they are easy to read and useful across different market conditions. Unlike a simple moving average, an EMA gives more weight to recent prices, so it reacts faster to momentum changes while still smoothing price action.
The EMA 20, EMA 50, EMA 200 combination became widely used because it covers three decision layers at once:
- short-term movement and pullbacks
- mid-term confirmation
- long-term trend direction
Behind the periods
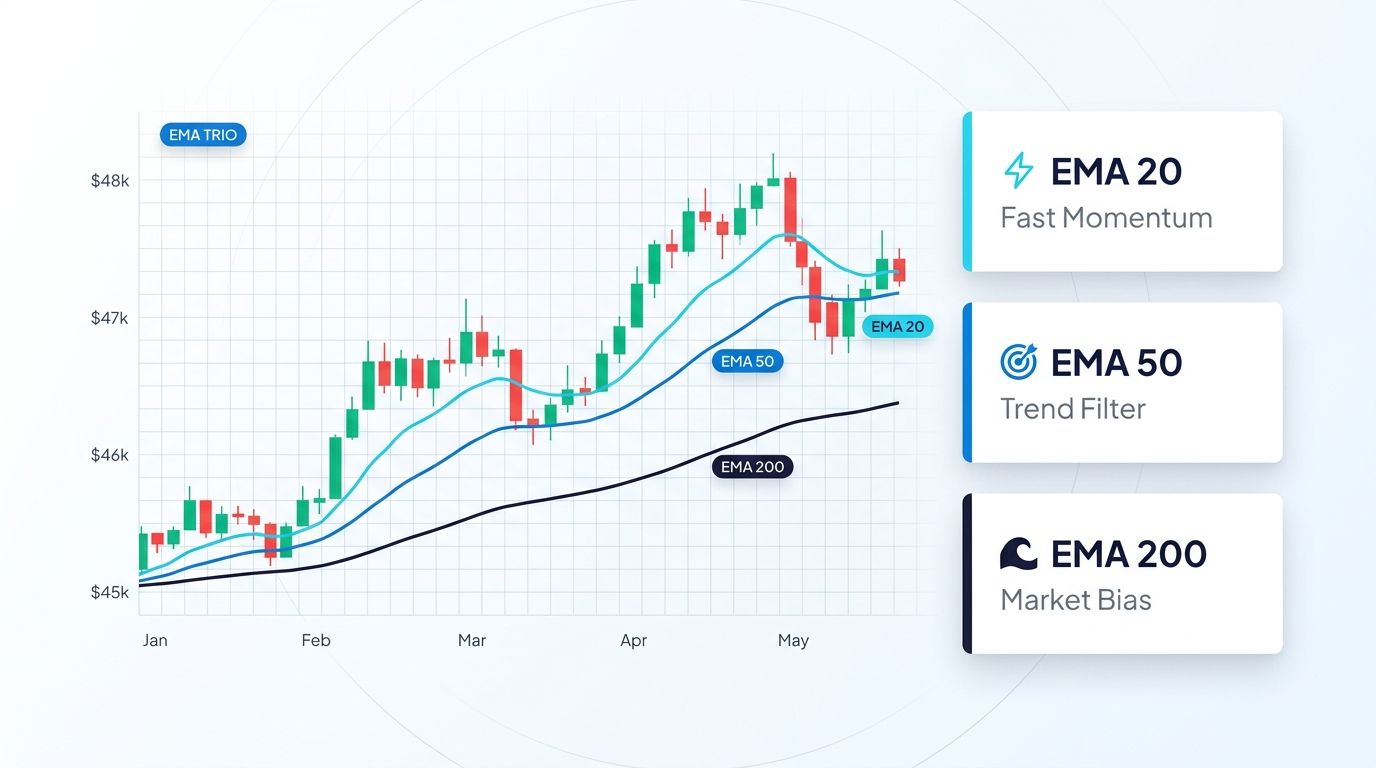
EMA 20 is the fast line. It responds quickly to price changes, which makes it useful for spotting momentum and timing pullbacks in a trend. When price keeps respecting EMA 20 during an uptrend, it often signals strong momentum.
EMA 50 sits in the middle. It filters noise better than EMA 20 and often acts as a practical zone for pullbacks. Many traders treat EMA 50 as a dynamic support or resistance area, especially when a trend is still healthy but not moving in a straight line.
EMA 200 is the long-term filter. It is commonly used to define the market regime. If price is above EMA 200 and EMA 200 is rising, many traders focus more on long setups. If price is below EMA 200 and EMA 200 is falling, the focus often shifts to short setups. EMA 200 is also watched as a major dynamic support or resistance level.
Reasons for Popularity
EMAs remain popular because they are easy to interpret, even for beginners. The lines provide a clean visual of whether price is trending, weakening, or turning. They are also flexible, since the same EMA trio can be used on different timeframes for different styles, from intraday trading to swing trading.
Another reason is confirmation. Using one indicator line can be misleading in choppy conditions, but combining EMA 20, EMA 50, and EMA 200 adds context. It helps traders avoid taking signals that conflict with the bigger trend. On top of that, EMAs work well alongside other tools such as RSI and MACD, which can strengthen decision-making when markets get noisy.
Understanding of EMA 20, 50, and 200
The EMA trio is most useful when it is treated as a structure, not a shortcut. Instead of asking, “Did the lines cross,” a better approach is to ask, “What is the market bias, and where is the best place to enter with controlled risk?” This mindset makes the setup more consistent, especially in crypto where false moves are common.
In trending markets, EMAs often behave like moving zones that price reacts to. Those reactions are not always perfect, but they can help traders plan entries on pullbacks, define invalidation levels, and stay aligned with trend direction.
EMA Strategy In General
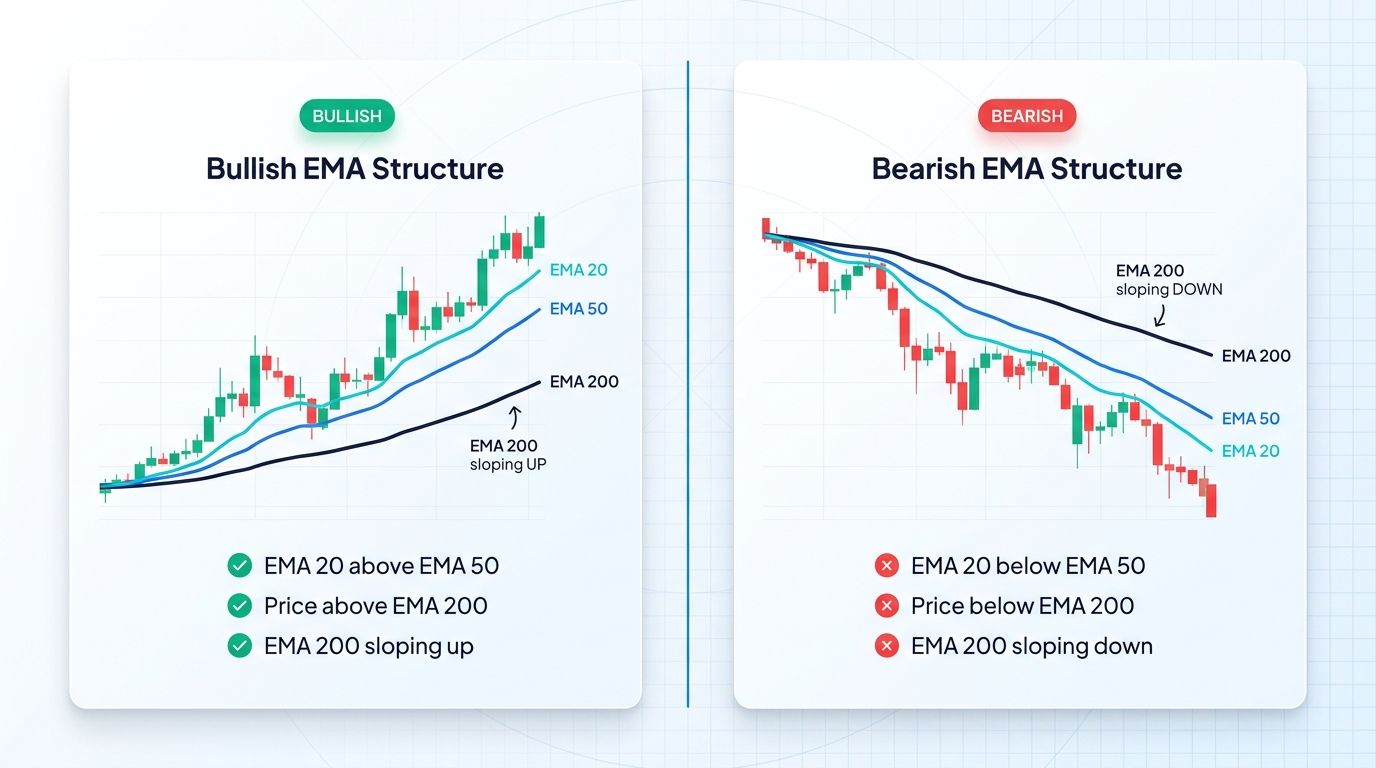
Trend identification becomes clearer when the EMAs line up. A common bullish structure is EMA 20 above EMA 50, with price above EMA 200 and EMA 200 sloping upward. A common bearish structure is EMA 20 below EMA 50, with price below EMA 200 and EMA 200 sloping downward. The slope of EMA 200 matters because a flat EMA 200 often signals a sideways market where signals are less reliable.
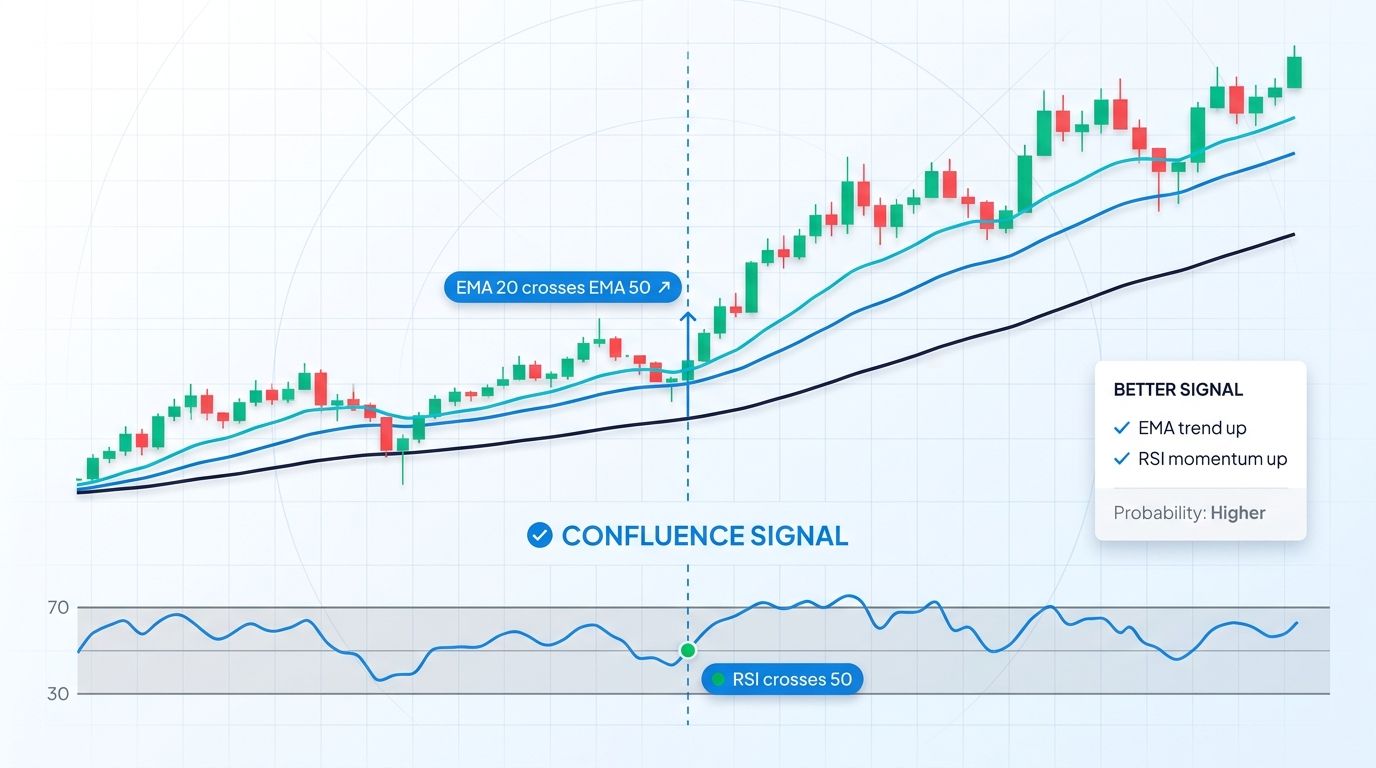
Crossovers are popular because they are easy to see, but they work best as alerts rather than instant entry signals. For example, EMA 20 crossing above EMA 50 can suggest strengthening bullish momentum, while EMA 20 crossing below EMA 50 can suggest weakening momentum or a bearish shift. To reduce false signals, many traders wait for candle close and prefer crossovers that align with the EMA 200 direction.
Support and resistance is another reason this trio is useful. In an uptrend, price often reacts around EMA 20 during shallow pullbacks and around EMA 50 during deeper pullbacks. EMA 200 tends to act like a broader trend boundary, where breaks and reclaims can signal bigger regime changes.
Using The EMA Trio For Crypto Market
Crypto is known for volatility, and volatility can distort signals when traders rely on only one indicator or one timeframe. The EMA 20, EMA 50, and EMA 200 trio helps by smoothing price across multiple horizons, so traders can separate trend direction from short-term fluctuations.
This setup often performs best when the market is trending with clear structure, such as higher highs and higher lows in an uptrend, or lower highs and lower lows in a downtrend. It tends to struggle when the market is ranging, because price may cut through the EMAs repeatedly and trigger frequent crossovers.
A practical way to use this in crypto is to treat EMA 200 as a filter first. When EMA 200 is rising and price is above it, trend-following long setups typically have better odds. When EMA 200 is falling and price is below it, short setups often become cleaner. In sideways conditions, it is usually better to reduce position size, wait for clearer structure, or add confirmation tools.
EMA with Other Oscillator Tools
EMAs are strong for trend structure, but they do not always explain momentum quality or exhaustion. This is where oscillators can help. Pairing the EMA trio with an oscillator can improve trade selection, especially during choppy phases when the market produces misleading crossovers.
MACD is useful because it is built from moving average relationships and can help confirm momentum shifts that match EMA structure. For example, an EMA 20 above EMA 50 signal is typically stronger when MACD also supports bullish momentum rather than weakening.
RSI measures the speed and magnitude of price changes. Traders often use it to confirm pullback entries, identify potential overbought or oversold conditions, and avoid entering late after a move is already stretched. It can also help detect weakness when price pushes higher but momentum does not follow.
A practical combination is to use EMA 200 for trend direction, EMA 20 and EMA 50 for timing on pullbacks, and RSI or MACD to confirm whether momentum supports the trade idea.
2026 Update: What to Check Before You Act
Use the EMA 20/50/200 setup as a decision framework, not as a standalone buy or sell signal. The strongest setups combine trend alignment, market structure, and predefined invalidation.
| Check | What to review | Why it matters |
|---|---|---|
| Trend filter | 20 EMA above 50 EMA above 200 EMA usually supports a bullish trend; the reverse supports a bearish trend. | Avoid taking signals against the higher-timeframe structure. |
| Entry timing | Wait for a pullback, retest, breakout, or candle confirmation near the moving averages. | Prevents chasing late moves after the easy part of the trend is already gone. |
| Risk rule | Define the invalidation level before entry and compare the setup with reward-to-risk. | Keeps the strategy usable during choppy crypto sessions. |
Quick trader checklist
- Compare the 20/50/200 EMA stack on at least two timeframes.
- Avoid signals during low-volume chop or immediately before major news.
- Use alerts so you do not manually chase every moving-average touch.
FAQ
Is the EMA 20/50/200 strategy enough by itself?
No. It is best used as a trend filter. Combine it with support and resistance, volume, market structure, and a defined stop or invalidation level before entering a trade.
Conclusion
EMA 20, EMA 50, and EMA 200 create a clear framework for trend trading. Together, they help traders define market bias, reduce noise, and plan entries and exits with more structure. The main improvement comes from using the trio as a system: first filter the market with EMA 200, then use EMA 20 and EMA 50 to time pullbacks and manage risk.
Altrady is a perfect trading platform suited for crypto markets. Start testing EMAs strategies on paper trading with a free trial account.