
On May 12, 2026, the ETH/BTC ratio fell to 0.02835, its lowest level since July 2025. Ethereum has underperformed bitcoin by more than 35% from its August 2025 peak ratio of 0.04324. For crypto traders, the question is what this multi-week trend signals about the broader market structure and how to position for what comes next.
The ETH/BTC ratio is one of the most-watched cross-asset metrics in crypto. It captures the relative performance of the two largest cryptocurrencies and signals which narrative is dominating market flows. A falling ratio means bitcoin is outperforming. A rising ratio means ethereum is leading.
This guide explains what the ETH/BTC ratio is, why it matters, the historical context for the current move, the structural forces driving ethereum's underperformance, and the practical implications for crypto traders.
What Is the ETH/BTC Ratio?
Note: The institutional ETH exposure landscape expanded further in 2026 with the launch of BlackRock ETHB, the first US-regulated ETH staking ETF that passes staking yield to investors.
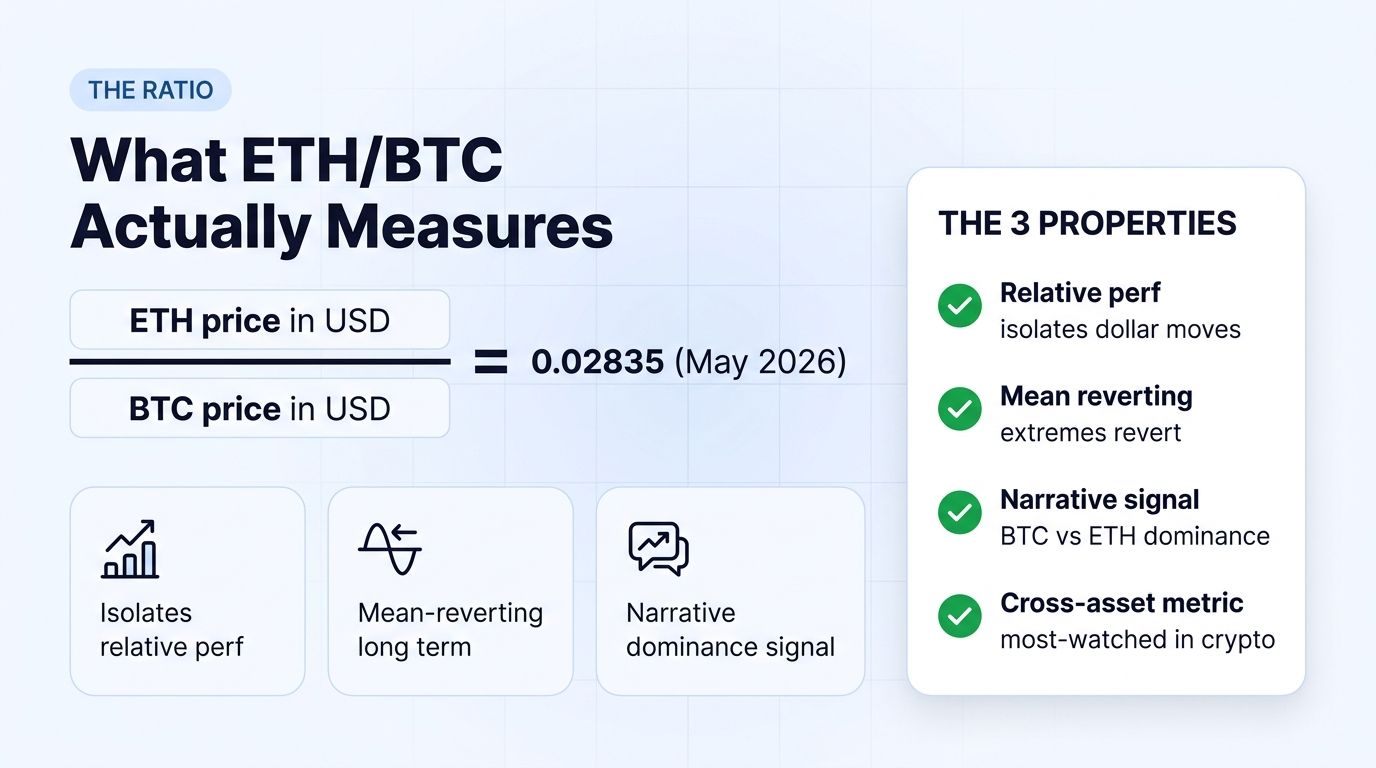
The ETH/BTC ratio measures how much bitcoin one ethereum is worth. If bitcoin is $80,000 and ethereum is $2,268, the ratio is 0.02835 (2,268 / 80,000).
Three properties make the ratio useful.
First, it isolates relative performance from dollar movements. If bitcoin and ethereum both rise 20%, the ratio is unchanged. If bitcoin rises 20% and ethereum rises 10%, the ratio falls. This separates "is crypto up?" from "which crypto is winning?"
Second, the ratio is mean-reverting over long periods. Extreme readings in either direction tend to revert. Periods of ethereum outperformance are followed by periods of bitcoin outperformance, and vice versa.
Third, the ratio reflects narrative dominance. When bitcoin is winning, the ratio falls, and bitcoin-focused narratives (store of value, treasury reserves, ETF flows) dominate market conversation. When ethereum is winning, the ratio rises, and ethereum-focused narratives (DeFi, staking, scaling) dominate.
The Current Move in Context
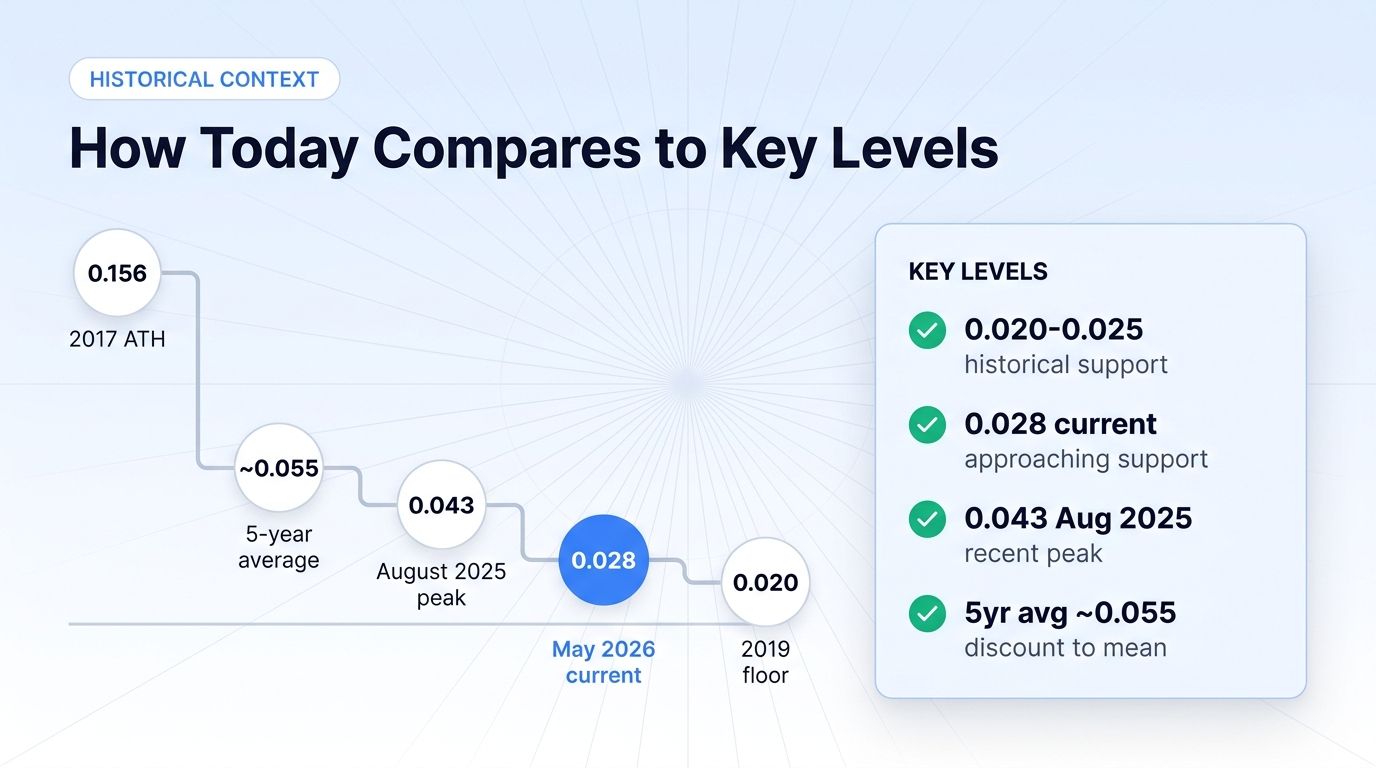
The ratio reached 0.04324 in August 2025 amid strong ethereum performance and growing institutional ETH interest. The decline since has been gradual but persistent. By May 2026, the ratio has fallen approximately 35%.
Three reference points help contextualize the current level.
Historical floor: The ratio reached lows around 0.02 in late 2019. Below 0.025 has historically been a strong support area where ethereum tends to find buyers.
5-year average: Roughly 0.05-0.06. The current 0.028 is significantly below the multi-year average, suggesting ethereum is at a relative discount.
ETH/BTC peak: The all-time high was approximately 0.156 in 2017. The current level is roughly 18% of that peak, indicating ethereum has dramatically underperformed bitcoin over the longest time frames.
The persistent decline since August 2025 is more notable than the absolute level. Multi-week or multi-month directional moves in the ratio often signal sustained narrative shifts.
Why Ethereum Has Underperformed
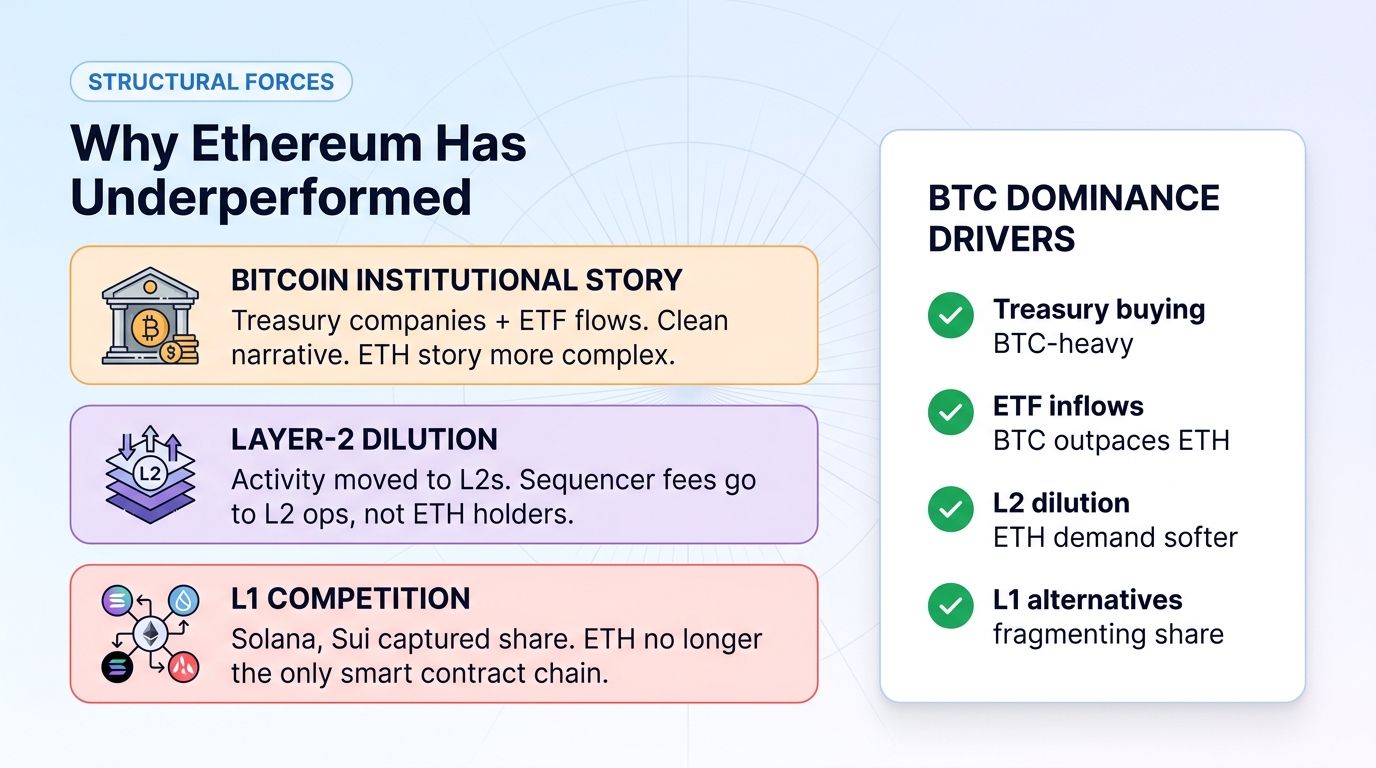
Three structural factors.
Factor 1: Bitcoin's Institutional Story Is Cleaner
Bitcoin has a clear institutional narrative: digital gold, treasury reserve asset, store of value, ETF-traded mass-market exposure. Corporate treasury companies (Strategy, Twenty One Capital, dozens of smaller ones) buy bitcoin specifically. Spot bitcoin ETFs have absorbed massive flows.
Ethereum's institutional story is more complex. Spot ethereum ETFs exist but have absorbed smaller flows than bitcoin ETFs. Corporate treasury companies focused on ethereum (Bitmine Immersion) are growing but remain smaller than the bitcoin treasury cohort. The story of "what is ethereum's institutional role?" is less cleanly articulated than bitcoin's.
Factor 2: Layer-2 Scaling Has Diluted ETH Demand
Ethereum's scaling strategy has shifted toward layer-2 networks (Arbitrum, Optimism, Base, etc.). Transactions and economic activity have moved from mainnet ethereum to these layer-2s. While this scales the ecosystem, it reduces direct demand for ETH as a gas asset on mainnet.
The economic value capture for ETH has been weaker than many expected when layer-2s were envisioned. Layer-2 sequencer fees go to layer-2 operators rather than ETH holders.
Factor 3: Alternative Layer-1 Competition
Solana, Sui, Aptos, and other alternative layer-1 networks have captured significant developer and user activity that might otherwise have gone to ethereum. The proliferation of credible alternatives reduces ethereum's monopoly on smart contract activity.
By 2026, Solana in particular has matured into a credible alternative for many use cases (memecoins, payments, NFTs). The pressure on ethereum's market share has been continuous.
Additional Factor: Macro Risk-Off Affects ETH More
In risk-off periods, ethereum tends to decline more than bitcoin because it is perceived as higher-beta. The macro uncertainty in early 2026 (inflation data, CLARITY Act vote pending, broader equity volatility) has produced multiple risk-off windows that disproportionately hurt ETH.
What the Ratio Decline Signals
Three interpretations.
Interpretation 1: Bitcoin Cycle Dominance
The current cycle is being defined by bitcoin's institutional adoption and treasury company buying. As long as that narrative dominates, ETH/BTC continues falling. The ratio is a coincident indicator of bitcoin's relative narrative strength.
Implication for traders: until the narrative shifts (or until ETH/BTC reaches deeply oversold extremes), expect continued bitcoin outperformance.
Interpretation 2: Mean Reversion Setup
Below 0.025-0.028 has historically been a support area where ethereum tends to recover. If the current level holds, mean reversion buyers may emerge. Long ETH/BTC positions (buying ETH while shorting BTC) could perform well if the ratio bounces.
Implication for traders: this is a level where contrarian ETH bulls may be looking to enter relative-value trades.
Interpretation 3: Structural Regime Change
If ethereum's relative position is permanently weakened by layer-2 dilution and alternative L1 competition, the ratio may continue declining and find lower long-term equilibrium. This view sees the current move as the beginning of a longer trend rather than a reversion setup.
Implication for traders: ethereum may underperform for longer than mean-reversion models suggest. Bitcoin and select alternative L1s (SOL, SUI) may be better long-term allocations than ETH.
How Traders Use the ETH/BTC Ratio
Three practical applications.
Application 1: Allocation Decisions
Many traders use ETH/BTC to inform allocation between the two majors. When the ratio is below historical averages, they overweight ETH. When the ratio is above historical averages, they overweight BTC.
Current reading suggests the contrarian allocation would be overweight ETH, but momentum traders are waiting for the trend to reverse before adding.
Application 2: Direct Pair Trading
The ETH/BTC pair is tradable on most major exchanges. Going long ETH/BTC expresses the view that the ratio rises (ETH outperforms). Going short expresses the view that the ratio falls.
This produces market-neutral exposure to the relative call without taking on broader crypto market direction.
Application 3: Signal for Altcoin Strategy
The ETH/BTC ratio often correlates with broader altcoin performance. When ETH outperforms BTC, altcoins tend to outperform as well. When ETH underperforms BTC, altcoins tend to underperform.
Traders use ETH/BTC as a leading or coincident signal for broader altcoin positioning.
Trading the Current Setup
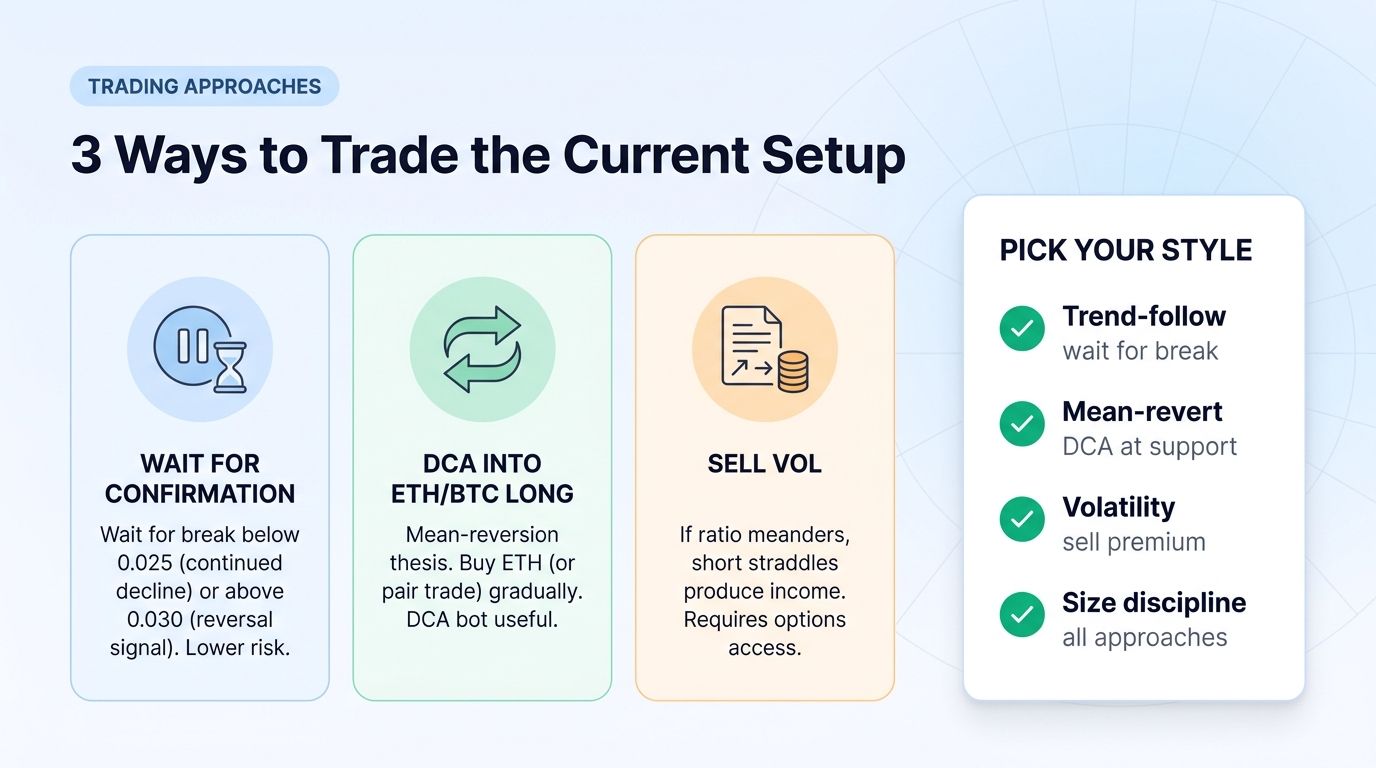
Three approaches for the current environment.
Approach 1: Wait for Confirmation
Wait for the ratio to either break below 0.025 (signaling continued decline) or break above 0.030 (signaling potential reversal). Either direction provides clearer signal than entering at the current ambiguous level.
This approach trades reduced returns (you miss part of any move) for higher win rate (you avoid entering at the wrong point in the cycle).
Approach 2: Dollar-Cost Average into ETH/BTC Long
If you believe in mean reversion, dollar-cost averaging into long ETH/BTC (buying ETH and shorting BTC, or just buying ETH if you prefer directional exposure) at current levels can produce strong returns if the ratio recovers.
A platform like Altrady with DCA bot functionality across 19+ exchanges supports this approach for the long ETH leg.
Approach 3: Sell ETH/BTC Volatility
Options markets sometimes price the ratio's volatility higher than realized. Selling options structures (e.g., short straddles on extreme moves) can produce income while the ratio meanders.
This approach requires options access and risk management for tail scenarios. Most retail traders are better suited to directional or pair-trade approaches.
How the Macro Environment Affects the Ratio
Three macro factors are important in mid-2026.
Factor 1: CLARITY Act and Regulatory Clarity
If the CLARITY Act passes with clean treatment of ethereum, ETH could outperform on regulatory clarity. If the bill creates uncertainty about ETH's status (e.g., conflicting tests for sufficient decentralization), ETH could underperform further.
Factor 2: Macro Risk Environment
Risk-off episodes hurt ETH more than BTC. Continued macro uncertainty (inflation, geopolitics, equity volatility) supports continued ETH/BTC decline. Risk-on rallies could support ETH catch-up.
Factor 3: Treasury Company Activity
Corporate treasury buying has been disproportionately bitcoin-focused. If significant ethereum treasury company activity emerges (or if existing companies like Bitmine accelerate buying), it could support ETH relative to BTC.
How ETH/BTC Fits Into a Portfolio
A practical framework:
- Core positions in both BTC and ETH: 50-70% of crypto allocation, with weighting determined by your view on the ratio
- Active ratio trades: 5-15% of capital, dedicated to specific pair trades when you have conviction on the direction
- Watch ratio for altcoin signals: Use ETH/BTC as one input among many when sizing altcoin positions
- Avoid extreme positions either way: The ratio has produced sharp reversals historically; do not over-concentrate at any single level
The Risks of Trading the Ratio
Trend persistence. Mean reversion does not always happen on the timeline traders expect. The ratio can decline for many months or years before reversing. Patience is required, and patience costs money.
Funding cost. If you express the trade through derivatives or borrowed positions, funding rates matter. Sustained directional moves can produce expensive funding costs even when the underlying view is correct.
Correlation breakdown in stress. In severe market stress, both ETH and BTC can fall together, and the ratio can become unpredictable. The "market-neutral" assumption of pair trading can break down.
Information disadvantage. Sophisticated traders monitor the ratio closely. The "easy" trades are often gone before retail can position. Trading the ratio profitably requires more than just observing the chart.
FAQ
Is ETH a buy at current ETH/BTC levels?
This is a relative-value question. ETH may be a buy relative to BTC at current levels (mean reversion thesis) while still being a hold or sell in absolute terms (if you expect the overall crypto market to decline). Separating relative-value from absolute-direction views is critical.
How low can the ETH/BTC ratio go?
Historical support has been around 0.02-0.025. The lowest level in recent history was approximately 0.018 in late 2019. Below the 5-year historical low would suggest a structural regime change rather than a normal cyclical move.
What is the timing for mean reversion?
Mean reversion in the ETH/BTC ratio typically takes 3-12 months when it occurs. Short-term traders should not expect immediate reversal even if the longer-term thesis is correct.
How does the layer-2 narrative affect the ratio?
Layer-2 scaling has been a net negative for ETH relative to BTC because it dilutes ETH demand. If layer-2 fees flow back to ETH holders through future protocol changes, the relationship could shift. Currently, the layer-2 dynamic supports continued ETH underperformance.
Can I trade ETH/BTC on Altrady?
Yes. Altrady connects to 19+ exchanges, most of which list the ETH/BTC trading pair directly. You can take positions in the pair, manage them across exchanges, use the signal bot or grid bot for automated strategies, and view your full portfolio in one dashboard. The pair trade can be set up directly through your preferred exchange.
Conclusion
The ETH/BTC ratio's decline to 0.02835 in May 2026 represents a meaningful market signal. After ethereum's strong relative performance through August 2025, the subsequent 35% decline reflects bitcoin's dominance in the current institutional adoption cycle, layer-2 dilution of ETH demand, and alternative layer-1 competition.
For traders, the practical takeaway is this: the current level is approaching historical support zones where mean reversion has often occurred. Whether the ratio bounces or continues declining depends on the unfolding interplay of regulatory clarity (CLARITY Act), macro environment, and treasury company activity.
Patient mean-reversion buyers may be presented with attractive opportunities at these levels. Trend-following traders should wait for confirmation before committing to a direction. Both approaches require sizing positions to a level where the worst-case outcome does not damage broader portfolio health.
The longer-term question is whether ethereum's relative position can recover or whether the multi-cycle decline reflects structural changes that produce a lower long-run equilibrium. The next 6-12 months should provide significant data points to answer that question. In the meantime, the ETH/BTC ratio remains one of the most important cross-asset metrics in crypto, worth monitoring daily as part of any serious trader's workflow.