What Is a Fair Value Gap?
A Fair Value Gap, often abbreviated as FVG, is a price inefficiency that appears on a chart when the market moves so quickly that trading activity skips over a range of prices entirely. The result is a visible gap between candles where price never traded, leaving an imbalance between buyers and sellers.
This concept comes from the ICT (Inner Circle Trader) methodology, a popular framework used by smart money traders and institutional analysts. In ICT theory, markets are not random. Large institutional players, market makers, and liquidity pools drive price in deliberate ways, and Fair Value Gaps are one of the footprints they leave behind.
When you understand how FVGs form and what they mean, you gain a sharper lens for reading market structure. Instead of just seeing a candlestick chart, you begin to see areas of unfinished business, zones where price is likely to return before continuing in the original direction.
Fair Value Gaps are especially relevant in crypto markets, where volatility is high and sharp moves happen frequently. BTC can gap up 5% in a single hour. ETH can drop sharply on bad news and leave behind a wide imbalance zone. These FVGs often act as powerful magnets, pulling price back to rebalance before the next leg of the trend begins.
How Fair Value Gaps Form
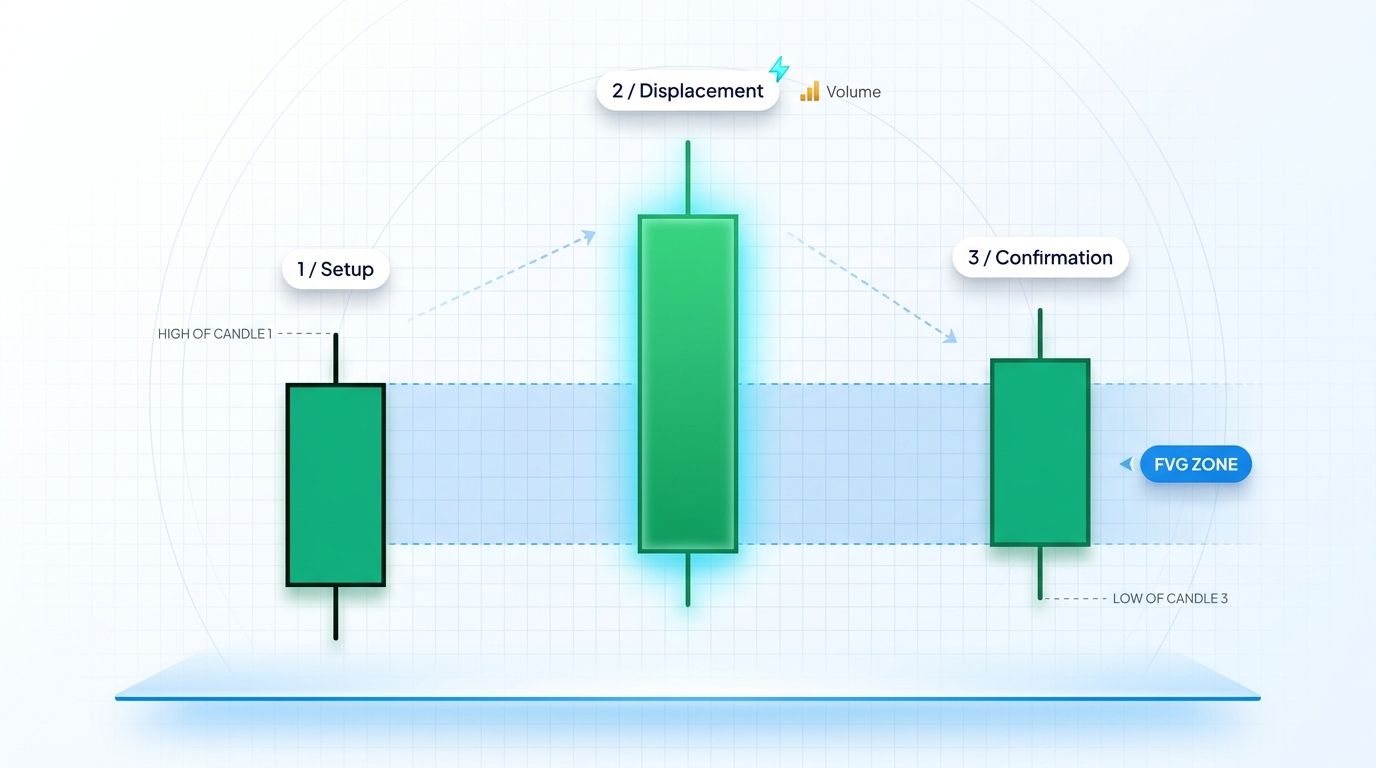
An FVG forms during a three-candle sequence where the middle candle moves aggressively, creating a gap between the high of the first candle and the low of the third candle (in a bullish FVG), or between the low of the first candle and the high of the third candle (in a bearish FVG).
Here is the mechanics behind it:
1. Candle 1 closes at a certain price level. 2. Candle 2 opens and moves aggressively in one direction with strong momentum. 3. Candle 3 opens and continues the move, but there is a gap between the wick of Candle 1 and the wick of Candle 3.
That gap, the space where no price overlap exists, is the Fair Value Gap.
The reason this forms is institutional order flow. When a large player enters the market with a massive buy or sell order, the order book gets consumed rapidly. Price moves faster than normal trading activity can fill, leaving behind a zone of incomplete price discovery. The market "owes" a revisit to that area because many orders were placed without proper counterparty matching at every price level.
In practical terms, FVGs form most commonly around major news events, breakouts from consolidation zones, or the beginning of strong trending moves. You will often see them right before a significant market rally or sell-off.
Types of Fair Value Gaps
Bullish FVG
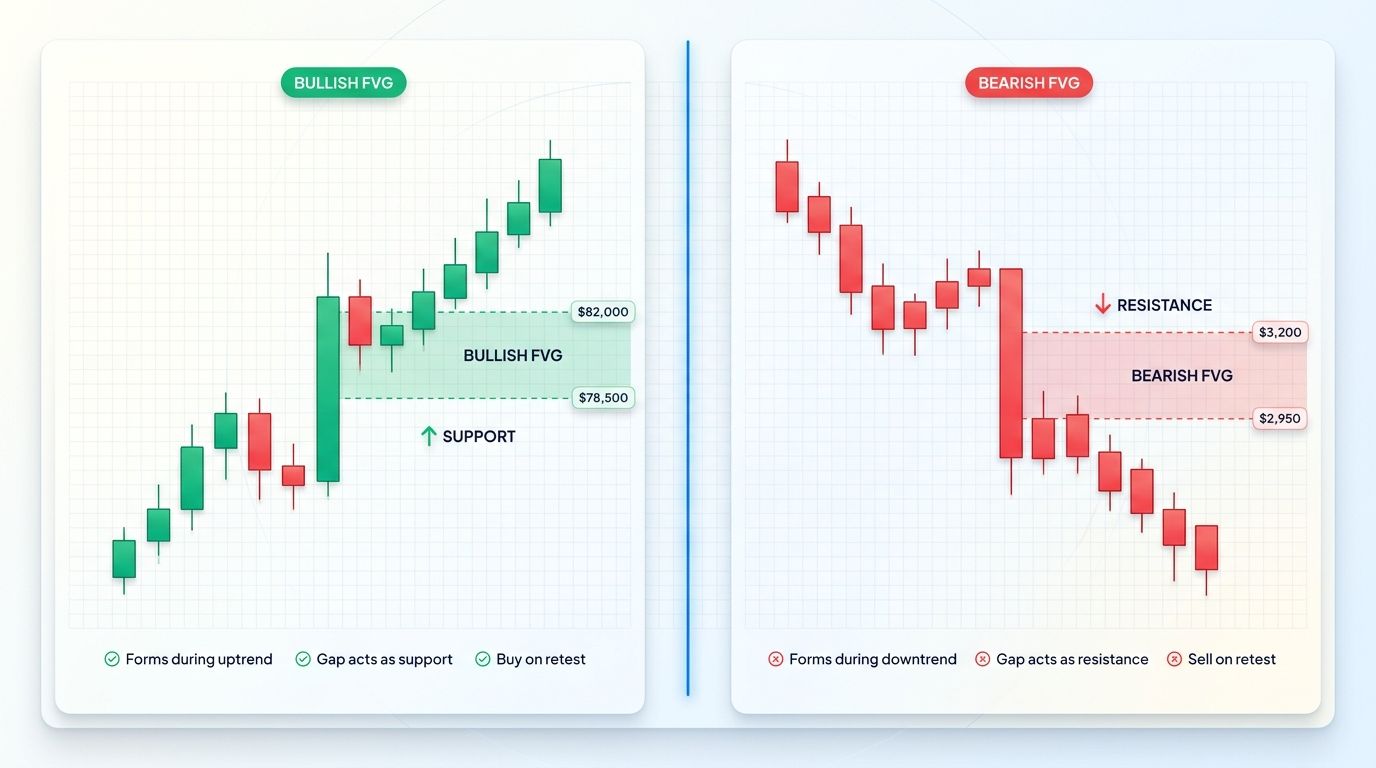
A bullish Fair Value Gap forms when price moves upward aggressively, leaving a gap between the high of the first candle and the low of the third candle. The middle candle is usually a large bullish candle with strong body and momentum.
In a bullish FVG scenario:
- Price forms a base or consolidation area.
- A large bullish candle fires through resistance.
- The resulting gap between Candle 1's high and Candle 3's low is the FVG zone.
- Traders expect price to retrace back into this zone and find support before continuing higher.
For example, if BTC is trading at $80,000 and breaks out aggressively to $84,000, leaving a gap between $80,500 and $81,500, that gap becomes the bullish FVG. A pullback into the $80,500 to $81,500 zone is considered a high-probability long entry.
Bearish FVG
A bearish Fair Value Gap forms when price drops sharply, leaving a gap between the low of the first candle and the high of the third candle. The middle candle is typically a large bearish candle with strong downward momentum.
In a bearish FVG scenario:
- Price is at a high or has just rejected from a key resistance zone.
- A large bearish candle drives price down quickly.
- The gap between Candle 1's low and Candle 3's high is the FVG zone.
- Traders expect price to retrace back up into that gap and find resistance before continuing lower.
For example, if ETH drops from $3,200 down to $2,900 leaving a gap between $3,050 and $3,150, the zone from $3,050 to $3,150 becomes the bearish FVG. A bounce up into that range is considered a high-probability short entry.
How to Identify Fair Value Gaps on a Chart
Identifying FVGs is a skill that becomes intuitive once you train your eye to spot the three-candle pattern. Here is a step-by-step process:
Step 1: Find Three Consecutive Candles
Look for a sequence of three candles where the middle one is significantly larger than the surrounding candles, showing a clear burst of momentum in one direction.
Step 2: Measure the Gap
For a bullish FVG: measure the distance between the high of Candle 1 and the low of Candle 3. If there is no overlap, you have an FVG.
For a bearish FVG: measure the distance between the low of Candle 1 and the high of Candle 3. If there is no overlap, you have an FVG.
Step 3: Draw the Zone on Your Chart
Mark the FVG as a rectangle on your chart, covering the price range between those two reference points. Most charting platforms allow you to draw rectangle zones manually. Some platforms and scripts can auto-detect and highlight FVGs automatically.
Step 4: Wait for Price to Return
Once the zone is marked, the trade setup comes when price retraces back into it. Watch for a reaction: slowing momentum, a rejection wick, or a reversal candle forming inside the FVG zone.
Timeframe Considerations
FVGs exist on every timeframe. A 1-minute FVG is relevant for scalpers. A 4-hour FVG matters for swing traders. A daily or weekly FVG has significant weight for position traders. Higher timeframe FVGs carry more weight and tend to hold as stronger support or resistance zones.
Trading Strategies Using Fair Value Gaps
The FVG Retest Entry
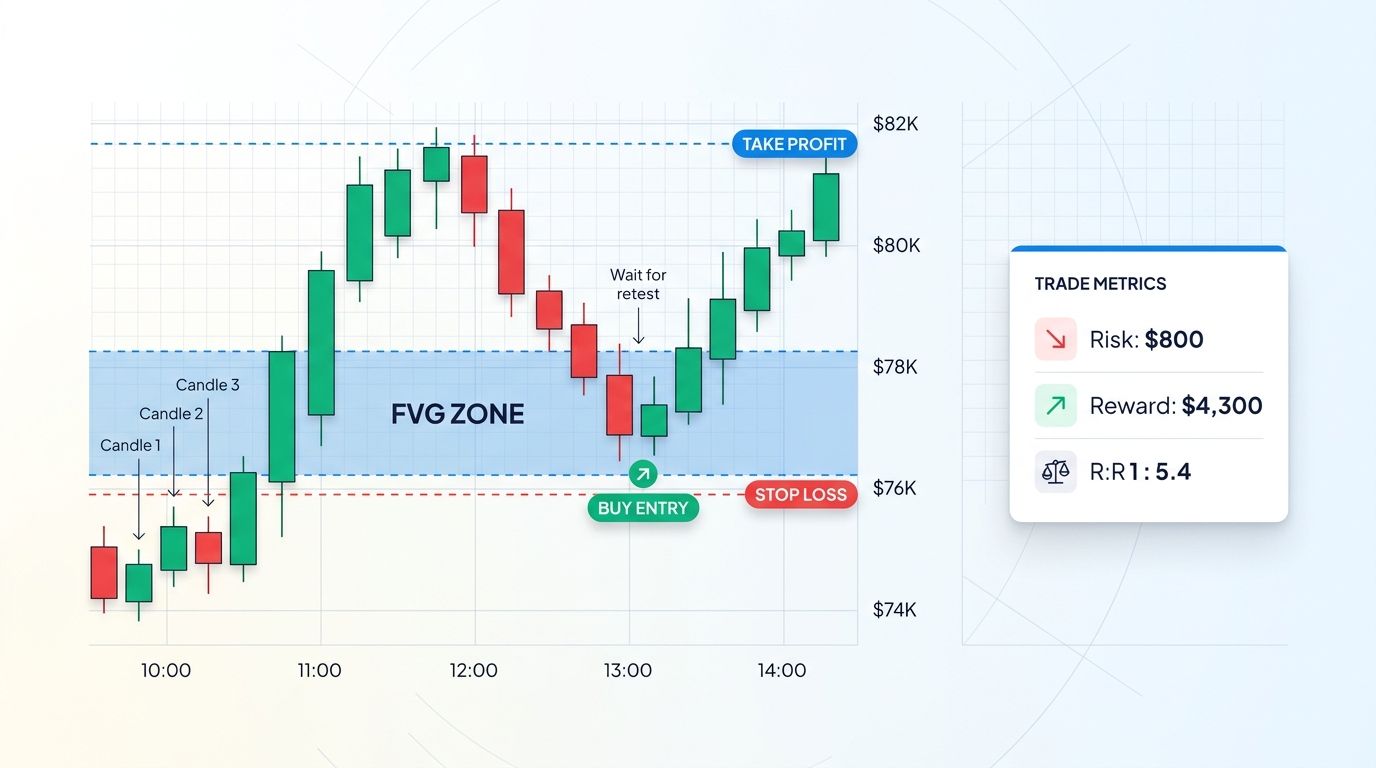
The most common strategy is waiting for price to retrace back into the FVG after the initial move, then entering in the direction of the original move.
For a bullish FVG: 1. Mark the FVG zone after the breakout. 2. Wait for price to pull back and enter the zone. 3. Look for a confirmation candle: a bullish engulfing, a pin bar, or a strong close back above the FVG midpoint. 4. Enter long at the upper boundary of the FVG or at the 50% midpoint. 5. Set your stop loss below the FVG zone. 6. Target the previous swing high or the next liquidity pool above.
For a bearish FVG: 1. Mark the FVG zone after the sharp drop. 2. Wait for price to bounce and reenter the zone. 3. Look for a bearish confirmation candle inside the zone. 4. Enter short at the lower boundary of the FVG or at the midpoint. 5. Set your stop loss above the FVG zone. 6. Target the previous swing low or the next liquidity pool below.
The Partial Fill Strategy
Sometimes price only partially fills an FVG before reversing. Traders use the 50% level (the midpoint of the FVG) as a common entry and exit reference. If price enters the zone and stalls at the midpoint with a strong rejection, that can be sufficient confirmation to enter the trade.
FVG as Stop Loss Buffer
Another approach is to use the FVG zone as a buffer for your stop loss. Because FVGs act as support or resistance, placing your stop just beyond the far edge of the zone gives your trade room to breathe while the structure holds.
Fair Value Gaps in Crypto Markets
Crypto markets are particularly fertile ground for Fair Value Gap strategies, for several key reasons.
High Volatility Creates Large FVGs. The crypto market operates 24 hours a day, 7 days a week, and price can move violently without warning. A single large candle triggered by a liquidation cascade, a major macro event, or a whale order can create a textbook FVG on the chart in seconds.
Thin Liquidity in Off-Hours. During Asian session or weekend trading, liquidity is thinner and large orders move price more efficiently, often creating clean FVGs that get filled during the next high-volume session.
Institutional Participation is Growing. As spot ETFs and institutional money enter the crypto space, smart money behavior, including creating and filling Fair Value Gaps, becomes more pronounced. Following the footprints of institutional order flow is increasingly viable in BTC and ETH markets.
Leveraged Markets Amplify Moves. Futures markets for BTC, ETH, SOL, and other major coins have high open interest and leverage ratios. When liquidations stack up, price sweeps through levels rapidly, leaving multiple FVGs across different timeframes.
Practical example: In early 2025, BTC formed a clean bullish FVG on the 4-hour chart during a breakout from the $90,000 range. The gap sat between $91,200 and $92,800. Price pulled back into that zone, found support at the midpoint, and launched the next leg higher. Traders who recognized the FVG and entered long at the retest captured a multi-thousand dollar move with a tight stop.
Combining FVG with Other Technical Tools
Fair Value Gaps are powerful on their own, but they become significantly more reliable when combined with complementary concepts.
ICT Concepts
FVGs are natively part of the ICT framework. Combining them with other ICT tools adds context and confluence:
- Order Blocks: An order block is a consolidation zone before a significant move. When an FVG sits directly on top of an order block, the combined zone is very strong.
- Liquidity Sweeps: If price sweeps a previous swing high or low before dropping into an FVG, the setup has higher probability.
- Market Structure Shifts: An FVG forming after a confirmed change of character or market structure shift adds directional conviction.
Support and Resistance
Classic support and resistance levels work well alongside FVGs. If a bullish FVG sits right at a known support level, the confluence makes the long setup more compelling. If a bearish FVG aligns with a prior resistance level, the short setup has extra weight.
Order Flow and Volume Analysis
Analyzing volume at the FVG zone adds depth. When price returns to an FVG on declining volume, it suggests the retracement is weak and the original move is likely to resume. High volume on the retest, especially with a rejection candle, confirms active participation and defense of the zone.
Moving Averages
The 200-period EMA and the 50-period EMA can act as dynamic filters. An FVG that forms above the 200 EMA on the daily chart is more likely to hold as support than one forming in a structurally bearish downtrend.
Common Mistakes When Trading Fair Value Gaps
Even experienced traders make avoidable errors when applying FVG strategies. Knowing these pitfalls in advance saves both time and capital.
Entering Without Confirmation. The biggest mistake is entering a trade the moment price touches the FVG without waiting for a confirmation signal. Price can pierce through an FVG and continue moving against your position. Always wait for a reaction candle or a clear rejection before committing.
Ignoring Higher Timeframe Context. A bullish FVG on a 15-minute chart means very little if the daily chart shows a strong bearish trend. Always check the higher timeframe structure before trading an FVG. Trade with the trend, not against it.
Trading Every FVG Equally. Not all FVGs are the same. A fresh FVG on the 4-hour chart during a breakout holds more weight than an old FVG from three weeks ago that price has already partially tested multiple times. Focus on high-quality, untested FVGs in trending markets.
Setting Stops Too Tight. Placing a stop loss just inside the FVG zone rather than beyond it leads to getting stopped out by normal wick activity. Give the trade enough room by placing your stop below (for longs) or above (for shorts) the entire FVG zone.
Chasing Filled Gaps. Once an FVG has been fully filled and price has passed through it completely, it loses its significance as a trade setup. Only trade FVGs that still have untested range remaining.
Over-relying on FVGs Alone. FVGs are a tool, not a complete trading system. They work best as part of a broader confluence-based approach. Combine them with structure, liquidity levels, and volume for the best results.
Trade Smarter with Altrady
Spotting Fair Value Gaps manually across multiple charts and exchanges is time-consuming. That is exactly the problem Altrady solves.
Altrady is a professional multi-exchange trading platform that connects to 15+ exchanges including Binance, Coinbase, Kraken, Bybit, and more, giving you a unified dashboard to monitor all your positions and market activity in one place. Instead of jumping between browser tabs and losing track of your setups, everything you need is centralized.
With Altrady's real-time alerts, you can set price notifications for specific levels, including the boundaries of your FVG zones. The moment price enters your target area, you get notified instantly, so you never miss a high-probability setup again.
The platform's smart order system lets you automate your entries, stops, and take-profit levels in advance. Once you have identified an FVG setup, you can place conditional orders that trigger automatically when price reaches your zone, removing the emotion and the screen time from your trade execution.
Whether you are a swing trader looking for 4-hour FVG setups on BTC and ETH, or a scalper hunting 5-minute imbalances during the New York session, Altrady's multi-chart workspace adapts to your style.
Start your free trial today and see how a professional trading environment changes the quality and consistency of your setups.
Frequently Asked Questions
What is the difference between a Fair Value Gap and a price gap?
A traditional price gap occurs when a market closes and reopens at a different level, often seen in stocks between sessions. A Fair Value Gap is different. It is a three-candle intrabar imbalance where consecutive candles show no price overlap, and it can appear on any timeframe including tick-by-tick charts. FVGs come from the ICT framework and are rooted in institutional order flow theory rather than session-based price gaps.
How reliable are Fair Value Gaps as a trading signal?
FVGs are a high-probability structural tool when used with confluence. On their own, they do not guarantee a trade will work, as price does not always return to fill an FVG immediately. Their reliability improves significantly when combined with higher timeframe trend context, order blocks, and confirmation candles at the zone. Experienced FVG traders typically win rate above 55 to 65 percent on setups with proper confluence.
Do Fair Value Gaps always get filled?
No, not all FVGs get filled. While the market tends to revisit imbalance zones over time, some FVGs in strongly trending markets may remain unfilled for extended periods. A bullish FVG in a strong uptrend may never fully fill if the trend accelerates. Traders should not assume every FVG will attract price back to it. The ones in areas with confluence and opposing liquidity are the most likely to fill.
What timeframes work best for FVG trading in crypto?
The 15-minute, 1-hour, and 4-hour charts are the most commonly used timeframes for FVG trading in crypto. The 15-minute chart suits intraday and short-term swing setups. The 4-hour chart is popular among swing traders looking for setups that play out over one to three days. Daily chart FVGs are used by position traders and carry the most structural weight. Scalpers use the 1-minute and 5-minute charts but with the understanding that smaller timeframe FVGs have lower reliability.
Can beginners use Fair Value Gaps in their trading?
Yes, FVGs are actually one of the more beginner-friendly concepts within the ICT methodology because the pattern is visually clear and the setup rules are defined. The three-candle structure is easy to spot once you practice. That said, beginners should start by backtesting FVG setups on historical charts before trading with real capital, and they should always combine FVGs with basic trend analysis to filter for higher-probability entries. Paper trading for at least 30 to 60 days helps build confidence in the setup before going live.