What Is a Hammer Candlestick Pattern?
The hammer candlestick pattern is one of the most recognizable bullish reversal signals in technical analysis. It forms a single candle with a small real body positioned near the top of the trading range and a long lower wick that extends well beyond the body. Visually, it resembles a hammer standing upright on its handle.
A hammer candle matters because it captures a moment of market rejection. Price was pushed down during the session, tested lower levels, then was aggressively bought back up to close near the open. When this happens at the end of a downtrend or at a clear support level, it signals that sellers are losing control and buyers are stepping in with conviction.
For active crypto traders, the hammer candlestick pattern provides a clean visual trigger with defined risk. The hammer's low acts as a natural stop level, and the close near the high acts as the starting point for upside targets. Combined with confluence like a retest of support, an oversold oscillator, or bullish divergence, the hammer becomes a high-probability setup.
How to Identify a Hammer on a Chart
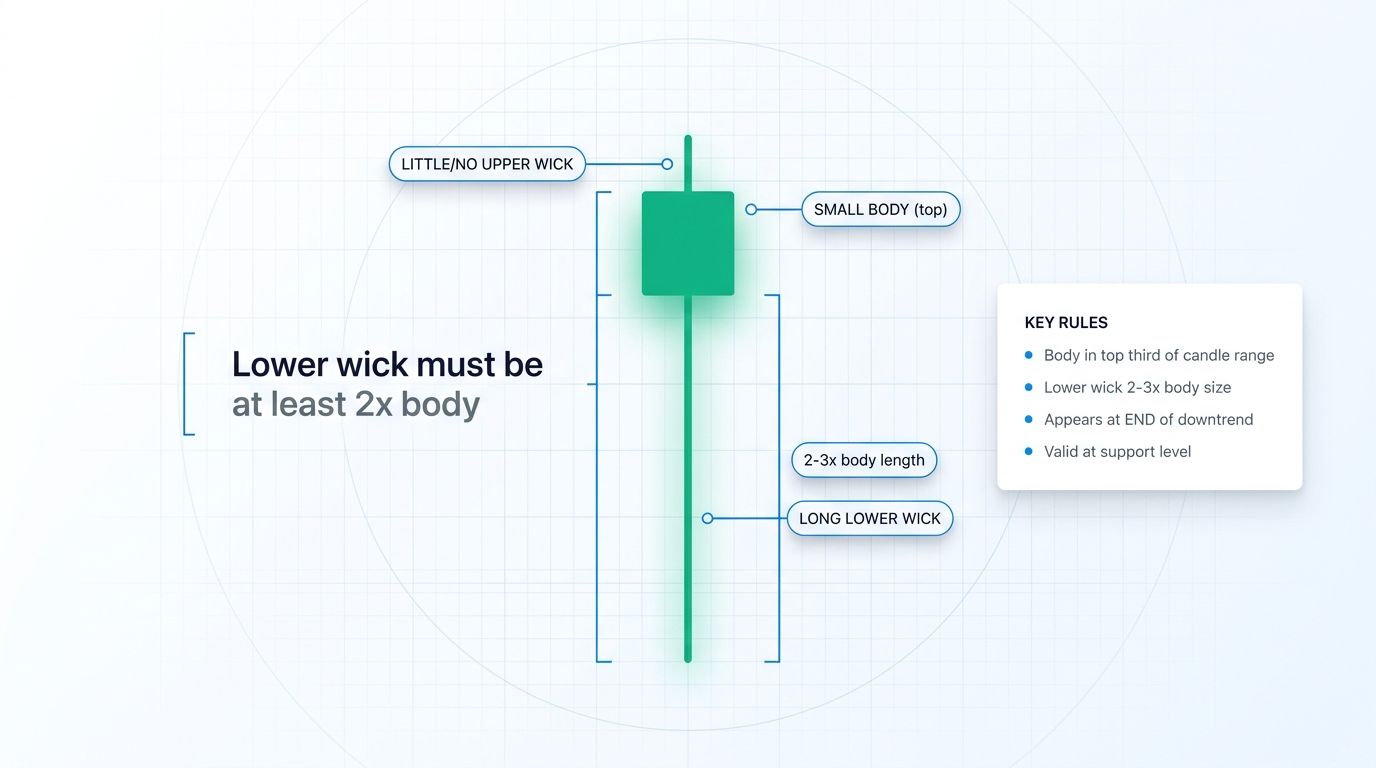
Spotting a valid hammer candle requires more than seeing a long wick. Verify a specific set of rules before you treat it as a tradable signal.
- Small real body located at the top of the total range. The body can be bullish (green) or bearish (red), though a bullish hammer carries slightly stronger conviction.
- Lower wick at least two times the length of the real body. Two to three times is ideal.
- Little to no upper wick. A visible upper wick weakens the signal because sellers were still active at the highs.
- Appears at the end of a clear downtrend or at a defined support zone. A hammer inside a sideways range has no directional meaning.
- Higher timeframes produce stronger signals. A 4-hour, daily, or weekly hammer carries far more weight than one on a 5-minute chart.
When all conditions line up, you have a textbook hammer candlestick pattern. When even one is missing, signal quality drops and you should either skip the trade or demand stronger confirmation.
Hammer vs Hanging Man vs Inverted Hammer vs Shooting Star
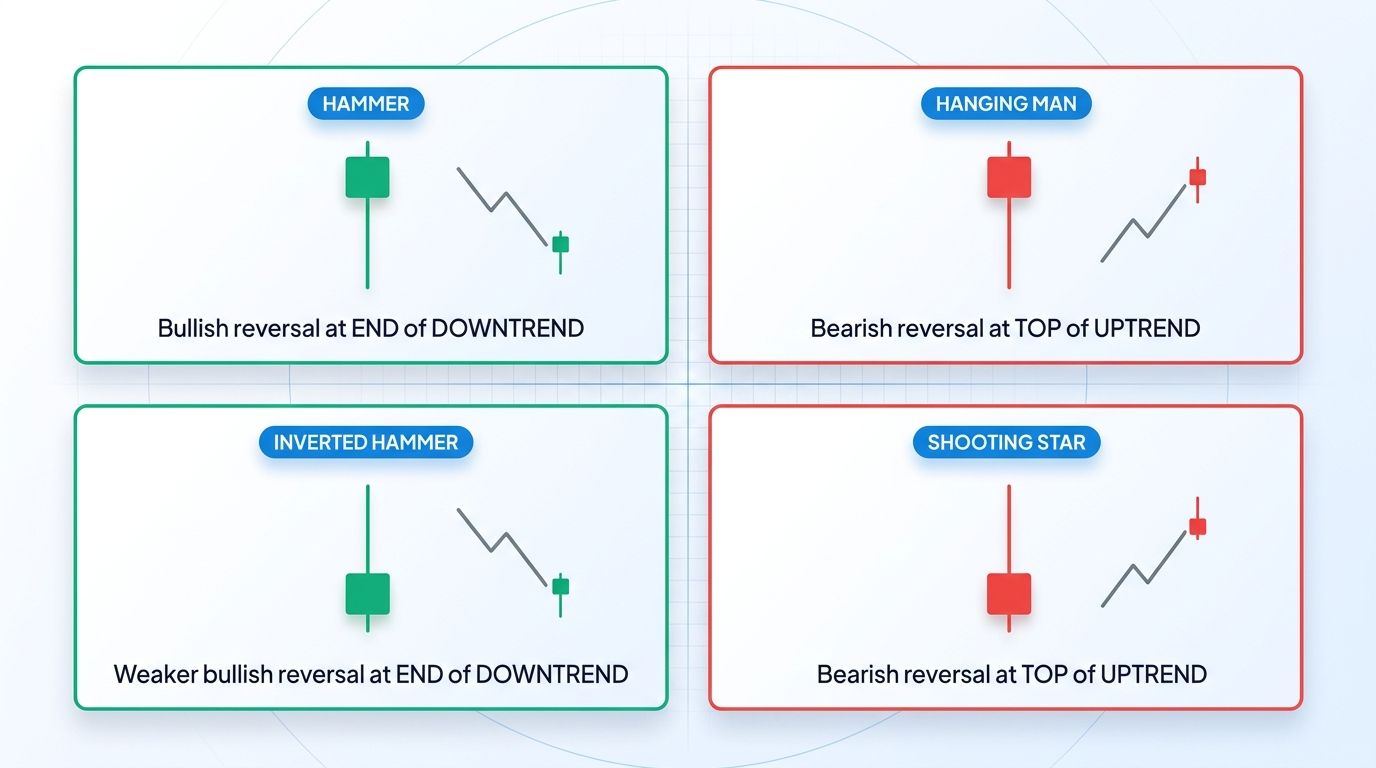
A common source of confusion is that four candlestick patterns share nearly identical shapes but carry very different meanings. Understanding the hammer vs hanging man distinction, plus the inverted hammer and shooting star, is essential.
Hammer
Small body at the top of the range and a long lower wick. Appears at the bottom of a downtrend or at support. The message is bullish reversal: sellers drove price down, buyers rejected the lows, and momentum is shifting upward.
Hanging Man
Same shape as the hammer: small body on top, long lower wick. But it appears at the top of an uptrend and warns of bearish reversal. The long lower wick here signals that sellers are probing lower prices, which can indicate buyer exhaustion.
Inverted Hammer
Small body at the bottom of the range and a long upper wick. Appears at the end of a downtrend and hints at bullish reversal, though weaker than a classic hammer because the close is lower in the range. Confirmation on the next candle is essential.
Shooting Star
Same shape as the inverted hammer: small body at the bottom, long upper wick. But it appears at the top of an uptrend and signals bearish reversal. Buyers tried to push higher and were firmly rejected by sellers.
| Pattern | Shape | Location | Signal | |---|---|---|---| | Hammer | Small body top, long lower wick | End of downtrend | Bullish reversal | | Hanging Man | Small body top, long lower wick | Top of uptrend | Bearish reversal | | Inverted Hammer | Small body bottom, long upper wick | End of downtrend | Bullish reversal (weaker) | | Shooting Star | Small body bottom, long upper wick | Top of uptrend | Bearish reversal |
The critical takeaway: the candle shape alone does not tell you what to do. The prior trend and the location on the chart determine whether the signal is bullish or bearish.
What the Hammer Tells You About Market Psychology
Every candle is a record of the battle between buyers and sellers, and the hammer candle tells one of the clearest stories you can read. During the session, sellers pushed price down to test lower levels, creating the long lower wick. Before the candle closed, buyers stepped in aggressively and drove price back up to the top of the range.
That round trip from the lows back up to the top is the heart of the hammer pattern. It shows seller exhaustion, aggressive buyer response, and a decisive shift in momentum within a single candle. The longer the lower wick relative to the body, the more dramatic the rejection and the stronger the psychological signal.
When this price action unfolds at key support after an extended downtrend, it is often the first visible sign that the downtrend is losing strength. Sellers cannot hold new lows and buyers have demonstrated willingness to step in with conviction. That combination of exhaustion and fresh demand is what creates the conditions for a reversal.
How to Trade a Hammer Candlestick Pattern
Knowing what a hammer looks like is only half the job. Trading it profitably requires a disciplined framework that handles entries, stops, targets, and confluence with care. Below is a rule-based approach you can apply on any timeframe and any pair.
Rule 1: Demand a clear downtrend first
A hammer only has bullish meaning at the end of a downtrend or at a recognizable support level. If price has been moving sideways in a range, or if the hammer forms near resistance, the signal is invalid. Before you even consider trading a hammer, confirm that the prior move has been clearly bearish. Look for lower highs and lower lows, a declining moving average, or a rejection from higher levels in recent sessions.
Rule 2: Require confirmation
Do not enter on the hammer candle itself. Wait for the next candle to close above the hammer's high. This confirmation candle is what validates the reversal and dramatically improves your win rate. Entering without confirmation means you are trading a hope; entering after confirmation means you are trading a structure.
Rule 3: Check volume
A hammer with above-average volume is far more reliable than one on thin volume. Heavy volume in the lower wick zone shows that buyers were aggressive when price tested the lows. That commitment is what makes the rejection meaningful. If the hammer forms on below-average volume, treat it as a weaker signal or skip it entirely.
Rule 4: Use confluence
The hammer on its own has a modest win rate. Combined with additional signals, it becomes much more powerful. Look for alignment with a key horizontal support level, an oversold RSI reading (below 30), a bullish divergence on MACD or RSI, a 200-period moving average, or a Fibonacci retracement level. A hammer that lines up with two or more confluence factors is where the best setups live.
Entry, Stop, Target Framework
- Entry: on the close of the confirmation candle, or on a retest of the hammer's midpoint for a better risk-to-reward ratio
- Stop loss: just below the hammer's low, which represents the exact rejection point. Avoid placing stops too close to the body; the low is the structural invalidation level.
- Target 1: the next swing high or minor resistance, aiming for at least 1:2 risk-to-reward
- Target 2: the next major structural resistance or prior breakdown level
- Consider scaling out: take partial profit at T1 and trail the remainder to T2 using a structure-based trailing stop
Example: Trading a Daily Hammer on BTC
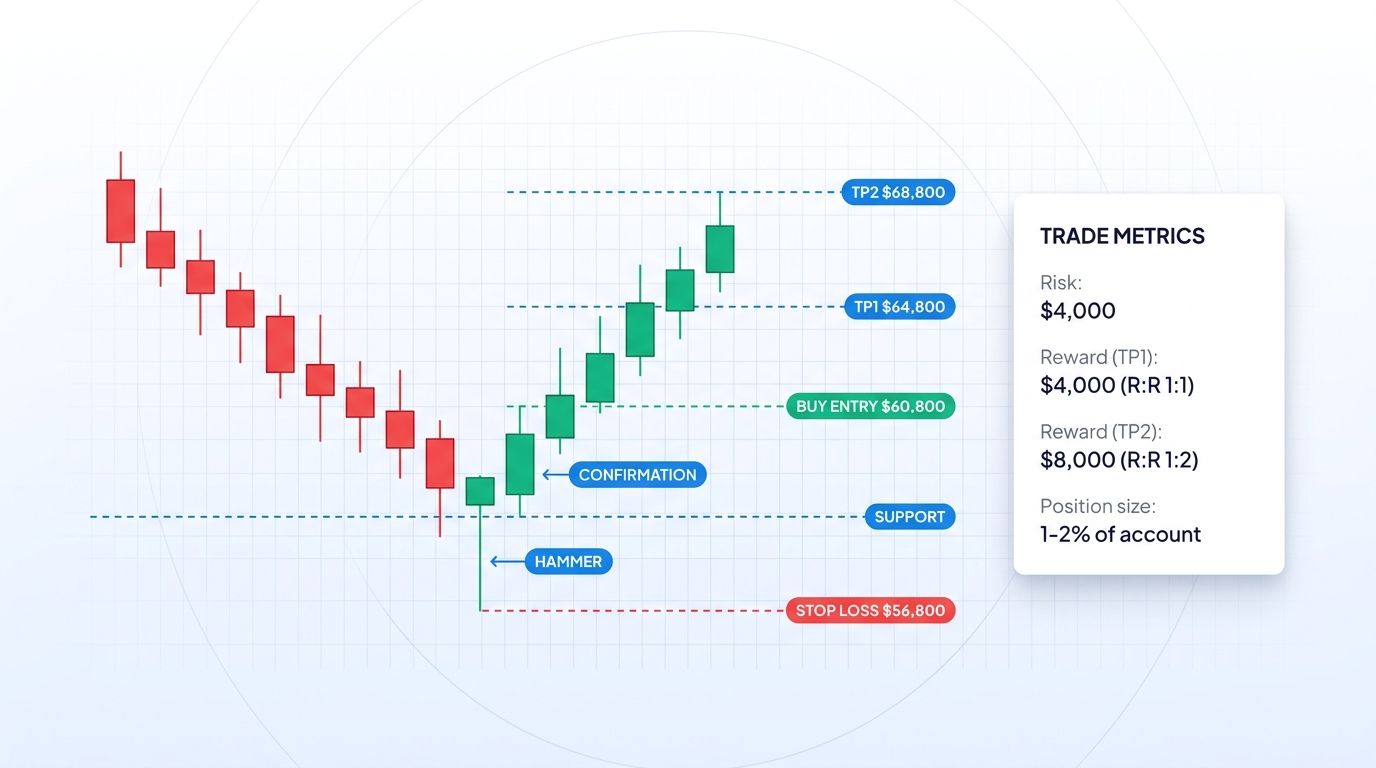
Imagine BTC has been in a four-week downtrend, dropping from 70,000 to horizontal support at 58,000. The daily chart prints a candle with an open at 59,200, a low at 57,100, a high at 59,600, and a close at 59,400. The lower wick is roughly three times the body, the upper wick is minimal, volume is 30 percent above the 20-day average, and daily RSI is at 28.
The next day, price closes at 60,800, confirming the reversal with a strong bullish close above the hammer's high. You enter at 60,800. Your stop goes just below the hammer low at 56,800, giving you 4,000 of risk. Target 1 is the prior swing high around 64,800 (1:1). Target 2 is the breakdown zone at 68,800 (1:2). You scale out half at T1 and trail the remainder.
Size the position so that if the stop at 56,800 is hit, your loss is no more than 1 percent of trading capital. That discipline means even if this hammer fails, you can take ten more setups like it without significant drawdown.
Common Mistakes When Trading Hammers
- Confusing the hammer with the hanging man. The shape is identical, but the trend context flips the meaning. Always check the prior move.
- Entering on the hammer itself without waiting for the next candle to confirm. This is the single biggest reason hammer trades fail.
- Ignoring the prior trend. A hammer inside a range or near resistance is noise, not a signal.
- Taking hammers in choppy, directionless markets. Without a clear downtrend, the reversal has nothing to reverse.
- Using hammers on 1-minute or 5-minute charts for scalping. Lower timeframes produce constant false hammer signals that are indistinguishable from noise.
- Setting stops too tight. A stop just below the hammer body instead of the hammer low will get taken out on normal volatility before the setup has a chance to play out.
- Chasing entries after the confirmation candle has already extended far above the hammer high. If you missed the ideal entry, wait for a pullback or skip the trade.
Hammer Patterns in Crypto Markets
Crypto trades 24/7 with high volatility, so hammer candle formations appear frequently across every pair and timeframe. That abundance is a double-edged sword: plenty of setups, but many are fakeouts, especially on lower timeframes and low-cap altcoins where liquidity is thin.
To improve your hammer pattern crypto edge, focus on:
- Higher timeframes (4-hour and above). Daily and weekly hammers are the most reliable.
- Major pairs with deep liquidity such as BTC, ETH, SOL, and other large-cap altcoins.
- Confluence with support levels, Fibonacci retracements, volume nodes, and key moving averages like the 50 and 200 EMA.
- Awareness of weekend price action. Thin weekend volume can produce hammers that reverse by Monday once real liquidity returns.
- Correlation with BTC. If BTC is still in a strong downtrend, altcoin hammers are more likely to fail.
Treat every hammer as a hypothesis that needs verification. Confluence, volume, confirmation, and higher timeframe alignment are the filters that separate high-probability setups from noise.
How Altrady Helps You Spot and Trade Hammer Patterns
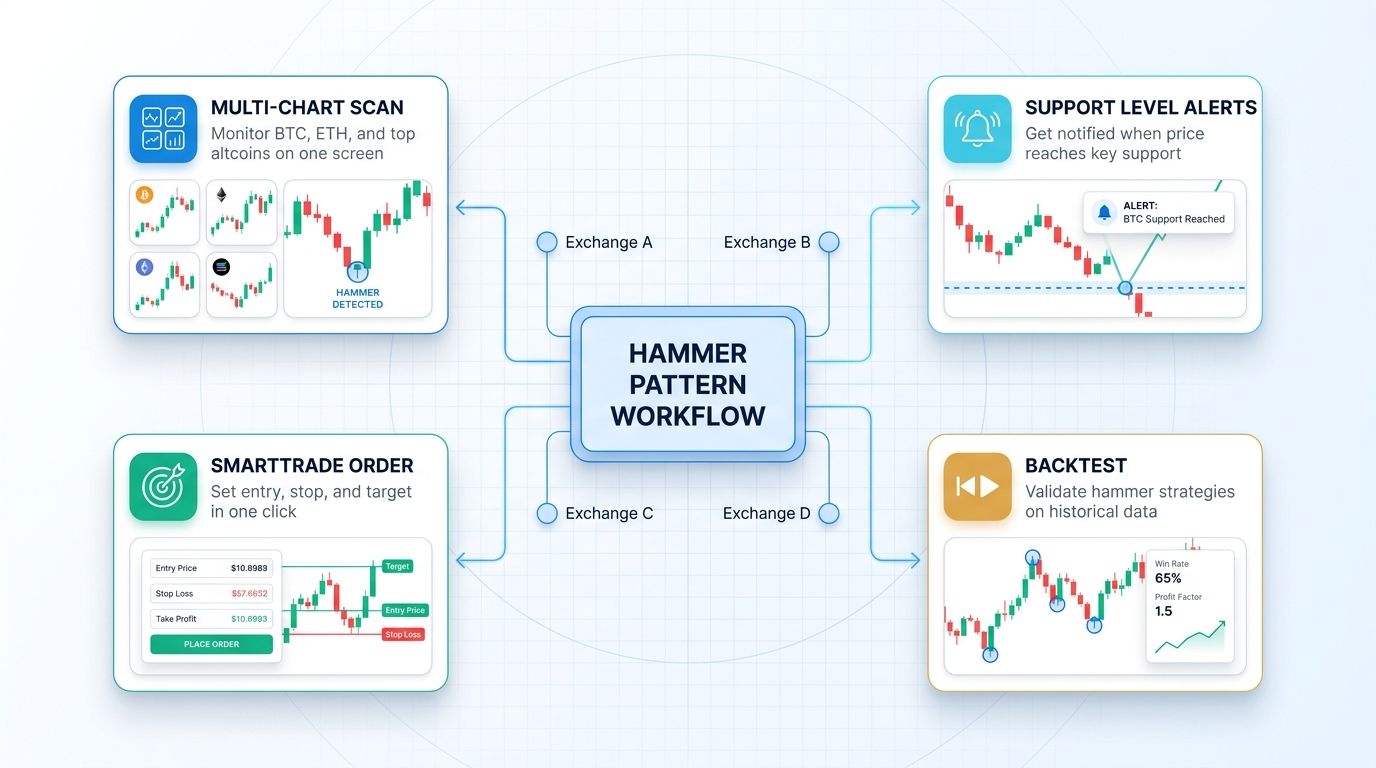
Altrady is a multi-exchange crypto trading terminal built for traders who want to execute setups like the hammer reversal with speed and precision. The platform brings scanning, charting, order management, and risk controls into one workflow.
- Multi-chart view lets you scan multiple pairs and timeframes at once, so you can identify hammer formations across your entire watchlist without flipping between tabs.
- Custom alerts fire at key support levels where hammers are most likely to form, so you get notified the moment price enters your zone.
- SmartTrade orders give you precise stop-loss and take-profit placement. Pre-configure entry, stop, and multiple targets before price reaches your setup zone.
- Backtest functionality validates hammer plus confluence strategies on historical data. Measure win rate, risk-to-reward, and drawdown before risking capital.
- Paper trading mode gives you a risk-free environment to practice pattern recognition and refine entry timing.
Start a free trial of Altrady to see how multi-chart scanning, custom alerts, and SmartTrade orders can sharpen your reversal trading workflow.
Frequently Asked Questions
Is a hammer candlestick bullish or bearish?
A hammer is a bullish reversal pattern, but only when it appears at the bottom of a downtrend or at a support level. The same shape at the top of an uptrend is called a hanging man and signals potential bearish reversal. Context decides the meaning.
How reliable is the hammer candlestick pattern?
On its own, the hammer has a mediocre win rate around 55 to 60 percent. Combined with confluence such as a support level, oversold oscillator, or bullish divergence, the win rate can reach 70 percent or more. Always use confirmation and position sizing rules to manage the trades that inevitably fail.
What is the difference between a hammer and a doji?
A hammer has a small but real body near the top of the range with a long lower wick. A doji has virtually no body because the open and close are effectively equal, and it can have wicks on either or both sides. Both signal indecision or reversal, but the hammer carries clearer directional bias when confirmed.
Can I trade hammers on a 5-minute chart?
You can, but the signal quality drops significantly. On 5-minute and 15-minute charts, hammer shapes form constantly and most are noise rather than real reversals. Prioritize 1-hour and higher for swing setups, and stick to 4-hour and daily for position trading.
Do I need volume confirmation to trade a hammer?
It is not strictly required, but it is strongly recommended. A hammer with above-average volume shows real buyer commitment at the lows. A hammer on thin volume can be a weak signal or an outright fakeout. Volume is one of the cleanest filters you can apply to reversal patterns.
Conclusion
The hammer candlestick pattern is one of the most useful bullish reversal signals a trader can learn, but it only works with discipline. The shape alone means nothing. What matters is where it forms, what trend precedes it, whether volume supports the move, and whether the next candle confirms the reversal. When those pieces align, the hammer reversal becomes a high-probability setup with clean entry, stop, and target logic.
Treat every hammer as a hypothesis that needs verification, not an automatic buy signal. Pair it with confluence like support zones, oversold oscillators, and bullish divergence. Use higher timeframes for the strongest signals and stay cautious on low-liquidity altcoins and weekend price action.
Ready to put these ideas into practice? Altrady offers a free trial and a paper trading mode so you can refine your hammer candlestick pattern execution without risk. Build the skill first, then scale into live capital with a process that is repeatable and risk that is controlled.