
Crypto charts are noisy. A normal moving average can lag during fast moves and flip too often during choppy periods. Kaufman's Adaptive Moving Average, usually shortened to KAMA, tries to solve that by adjusting to market efficiency.
KAMA responds faster when price moves cleanly in one direction and slows down when price becomes noisy. That makes it useful for traders who want trend context without reacting to every small candle.
What Makes KAMA Adaptive
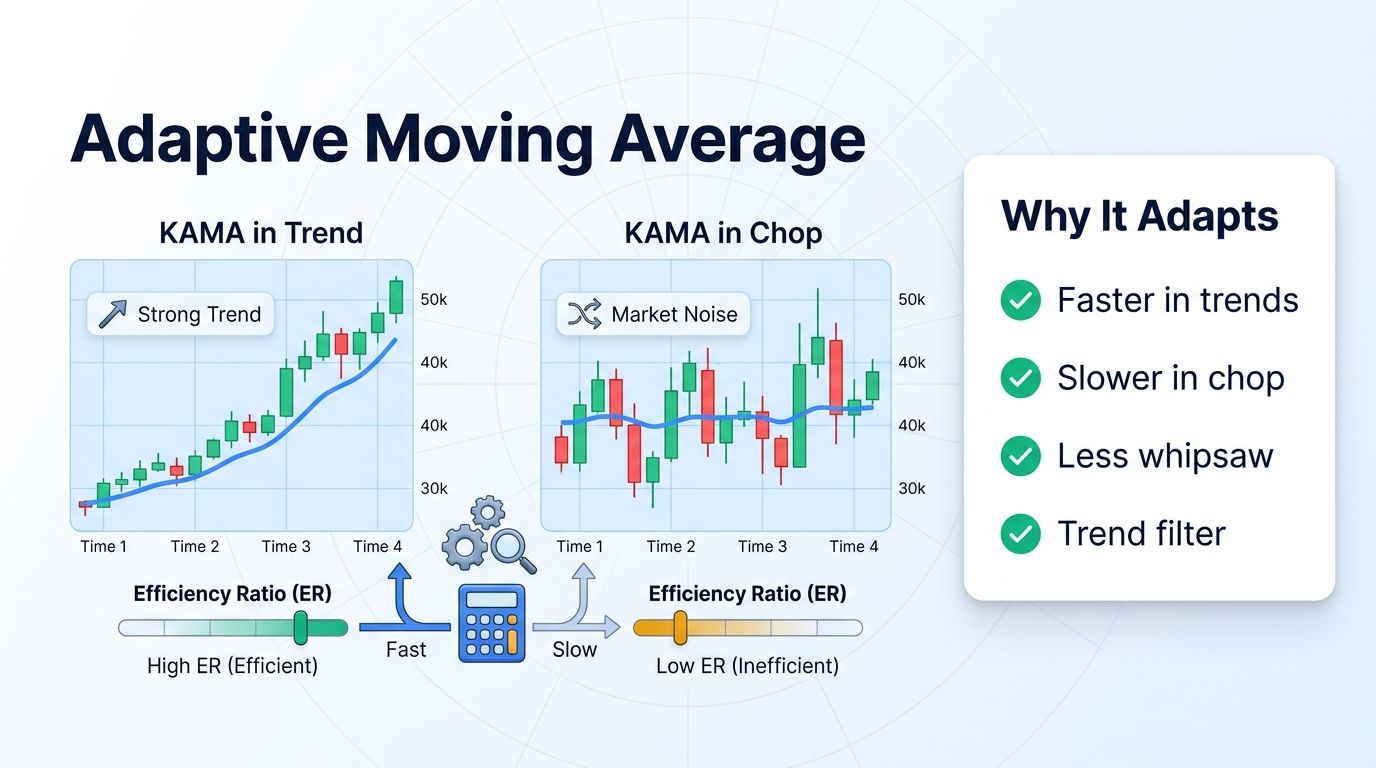
KAMA changes its sensitivity based on how efficiently price is moving. If the asset moves from point A to point B with little noise, the average can respond more quickly. If price bounces around without progress, the average becomes slower.
This is different from a simple moving average that treats every period the same. KAMA attempts to respect the character of the move, not only the number of candles in the lookback.
- KAMA speeds up during cleaner trends.
- KAMA slows down during noisy ranges.
- The goal is less whipsaw and less lag.
- It is a trend filter, not a complete system.
How Traders Use KAMA
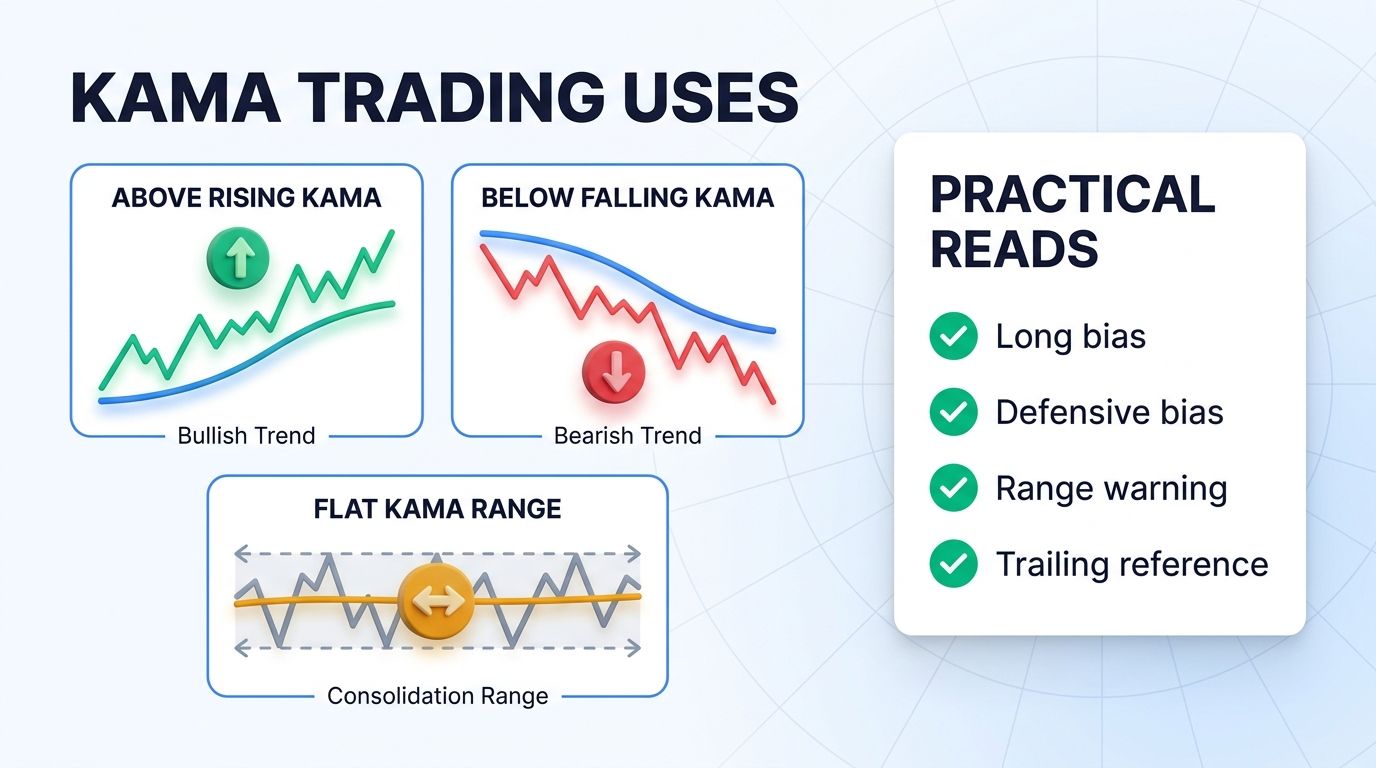
The simplest use is directional filtering. If price is above a rising KAMA, traders may prefer long setups. If price is below a falling KAMA, traders may prefer short or defensive setups. If KAMA is flat, the market may not be offering a clean trend.
KAMA can also help with trailing logic. A trader might use it as a dynamic reference for pullbacks, trend health, or exit review. The key is to define the rule before the trade rather than moving the rule after price gets uncomfortable.
- Rising KAMA can support long-bias setups.
- Falling KAMA can support defensive bias.
- Flat KAMA warns of weak trend quality.
- Trailing rules must be defined before entry.
KAMA vs SMA and EMA
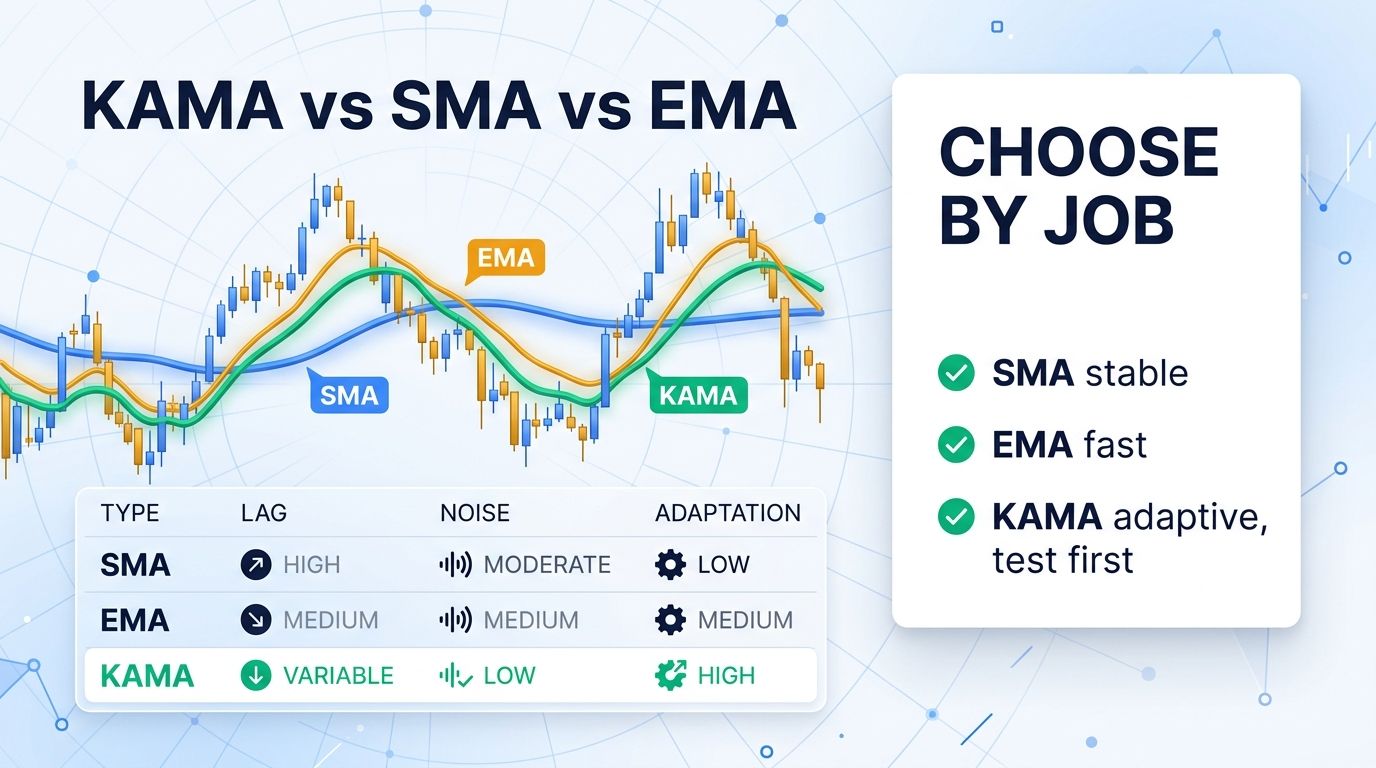
SMA is simple and stable, but it can lag sharply during fast crypto moves. EMA responds faster, but that speed can create more false turns in noisy markets. KAMA tries to sit between them by adapting to the quality of price movement.
That does not make KAMA automatically better. It means the indicator is designed for a different problem. Traders should test whether it improves decisions on their asset, timeframe, and strategy type.
- SMA is stable but slower.
- EMA is faster but can whipsaw.
- KAMA adjusts to trend efficiency.
- Testing matters more than indicator preference.
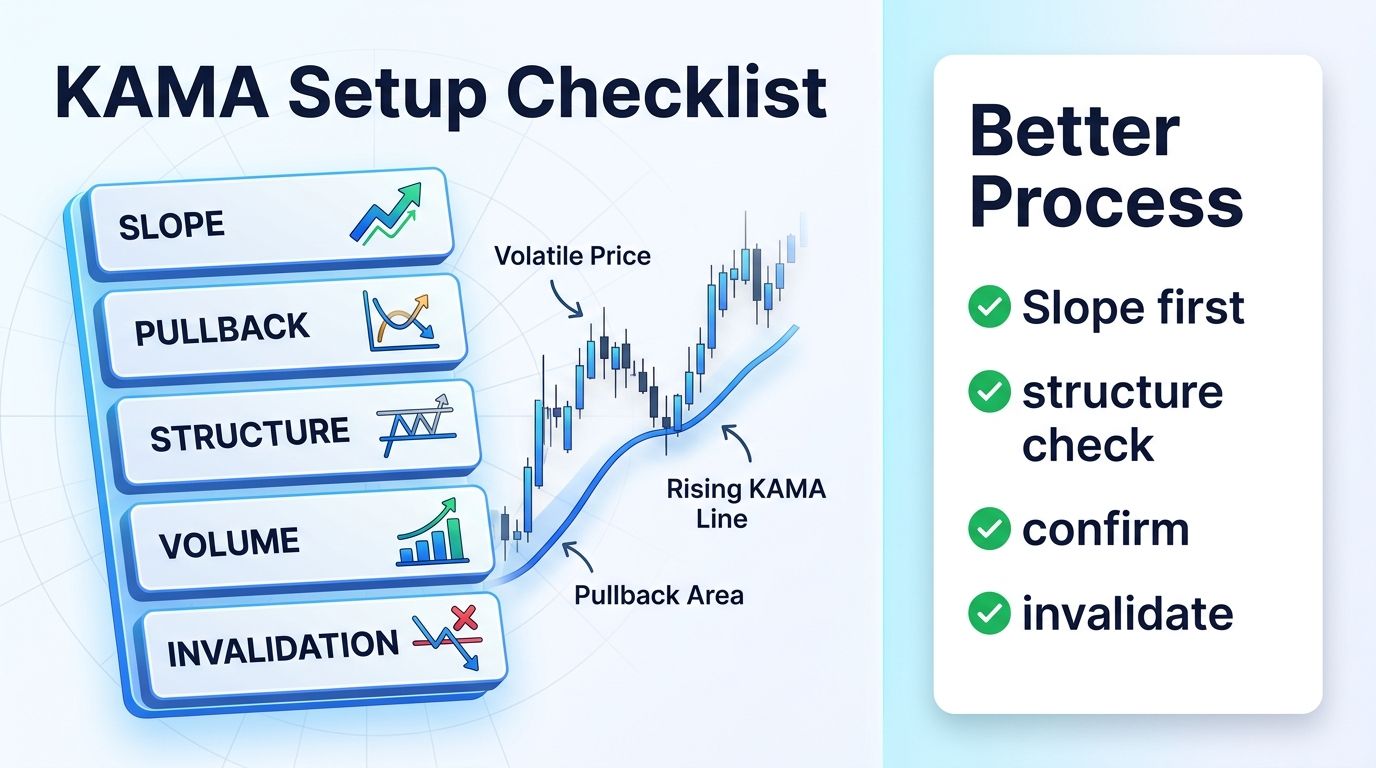
A KAMA Setup Checklist
A practical KAMA setup starts by defining trend direction, then checking whether price respects the adaptive average during pullbacks. Add volume, support or resistance, and invalidation. The indicator should reduce noise, not replace the trade plan.
KAMA is especially useful when the trader is tempted to overreact. If price dips but KAMA is still rising and structure remains intact, the pullback may be noise. If KAMA flattens or turns down, the trend may need review.
- Check slope before signal.
- Compare pullbacks with structure.
- Confirm with volume or momentum.
- Use invalidation if KAMA turns against the setup.
Common KAMA Mistakes
The first mistake is assuming adaptive means predictive. KAMA adapts to price behavior that has already happened. It can help filter noise, but it cannot know the future.
The second mistake is changing settings until the chart looks perfect. Overfitted settings may look excellent on the past and fail in live markets. Keep settings simple and test across different conditions.
- KAMA is adaptive, not predictive.
- Avoid overfitting settings.
- Do not ignore support and resistance.
- Review results across ranges and trends.
How to Add the Indicator to a Trading Routine
Kaufman Adaptive Moving Average for Crypto should enter the routine as a filter, not as a command. Start with the higher-timeframe market structure, then ask whether the indicator supports that structure. If the chart says the trend is weakening but the indicator still looks bullish, the trader should wait for alignment rather than force the setup.
The next step is to define the decision point. The indicator can help identify pressure, trend quality, or momentum, but the trade still needs a price level. That level might be a breakout, a retest, a support zone, or a failed low. Without a level, the indicator can create vague confidence instead of a trade plan.
Before using it live, test the indicator on the exact timeframe and asset group you trade most often. Large-cap assets, volatile altcoins, and thin markets can all react differently. A rule that looks clean on Bitcoin daily candles may be too slow or too noisy on a smaller intraday pair.
Finally, record the result. After each trade, note whether the indicator improved timing, avoided a bad entry, or added noise. A tool earns a place in the routine only if it improves decisions over a sample of trades. One clean example is not enough.
- Start with market structure.
- Use the indicator as confirmation.
- Attach the signal to a price level.
- Review whether it improves decisions.
When to Ignore the Signal
Every technical indicator has conditions where it becomes less useful. Low-liquidity markets, sudden news moves, thin order books, and tight ranges can all create signals that look clean in the panel but fail on the chart. Crypto traders should be especially careful with smaller assets where one large order can distort the signal.
It is also smart to ignore a signal when the risk-reward is poor. A bullish reading near heavy resistance is not automatically a good long setup. A bearish reading after a large drop may arrive too late. The chart location decides whether the signal is tradable.
A third reason to ignore the signal is overlap. If several indicators are built from similar price data, they may appear to confirm each other while actually repeating the same information. A cleaner stack uses one trend tool, one momentum or pressure tool, and one risk framework instead of many versions of the same idea.
When in doubt, reduce the signal to a question instead of an action. Ask what the indicator is warning about, then decide whether price, volume, and risk-reward support the same answer. If the answer is mixed, wait. Do not rush.
- Be cautious in thin or news-driven markets.
- Reject signals with poor risk-reward.
- Avoid duplicate indicator confirmation.
- Let chart location decide trade quality.
Bottom Line
KAMA is useful when a trader wants a moving average that adapts to trend quality. It can help reduce noise during choppy periods and respond more quickly during cleaner moves.
Use it as a filter inside a broader process. The trade still needs structure, volume context, invalidation, and position sizing.
- KAMA adapts to market efficiency.
- It can reduce whipsaw compared with faster averages.
- It still needs confirmation.
- Risk controls remain essential.
FAQ
What is KAMA in trading?
KAMA is Kaufman's Adaptive Moving Average, a moving average that adjusts sensitivity based on price efficiency.
Is KAMA useful for crypto?
It can be useful because crypto often shifts between clean trends and noisy ranges.
Is KAMA better than EMA?
Not always. EMA is faster, while KAMA adapts to noise. The better choice depends on the strategy and timeframe.
Can KAMA predict reversals?
No. It filters trend behavior but should be confirmed with structure, volume, and risk rules.