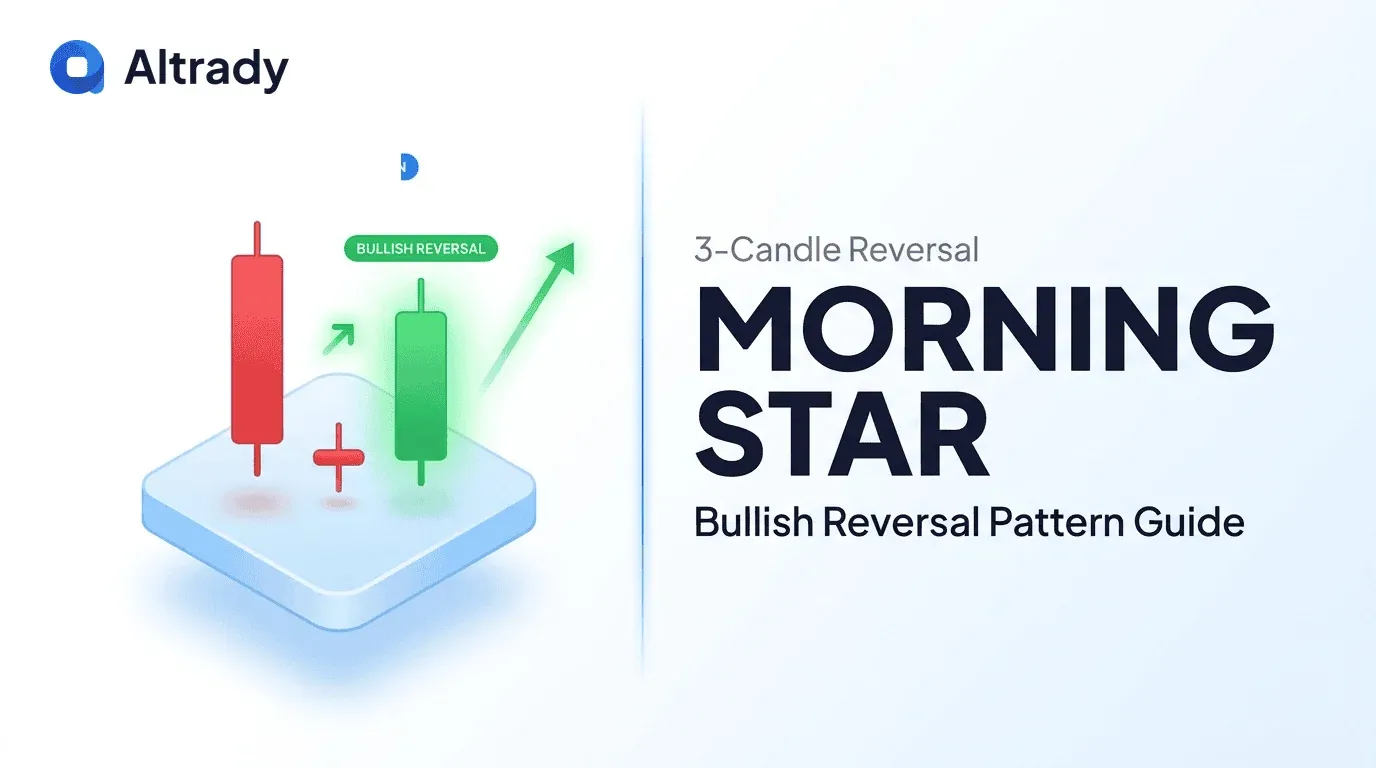

After an extended downtrend punishes buyers for days or weeks, a single three-candle formation can flip sentiment from despair to opportunity in under 72 hours. The morning star candlestick pattern is that formation, and it is one of the most reliable bullish reversal signals in crypto. This guide covers the three-candle structure, the psychology behind each candle, a full trading framework, and how morning star compares to other bullish reversal patterns.
What Is a Morning Star Candlestick Pattern?
The morning star candlestick pattern is a three-candle bullish reversal that appears at the bottom of a downtrend and signals sellers are losing control to buyers. It takes its name from the star that shines before dawn. Unlike noisy single-candle reversals, it earns its signal through a three-session handover.
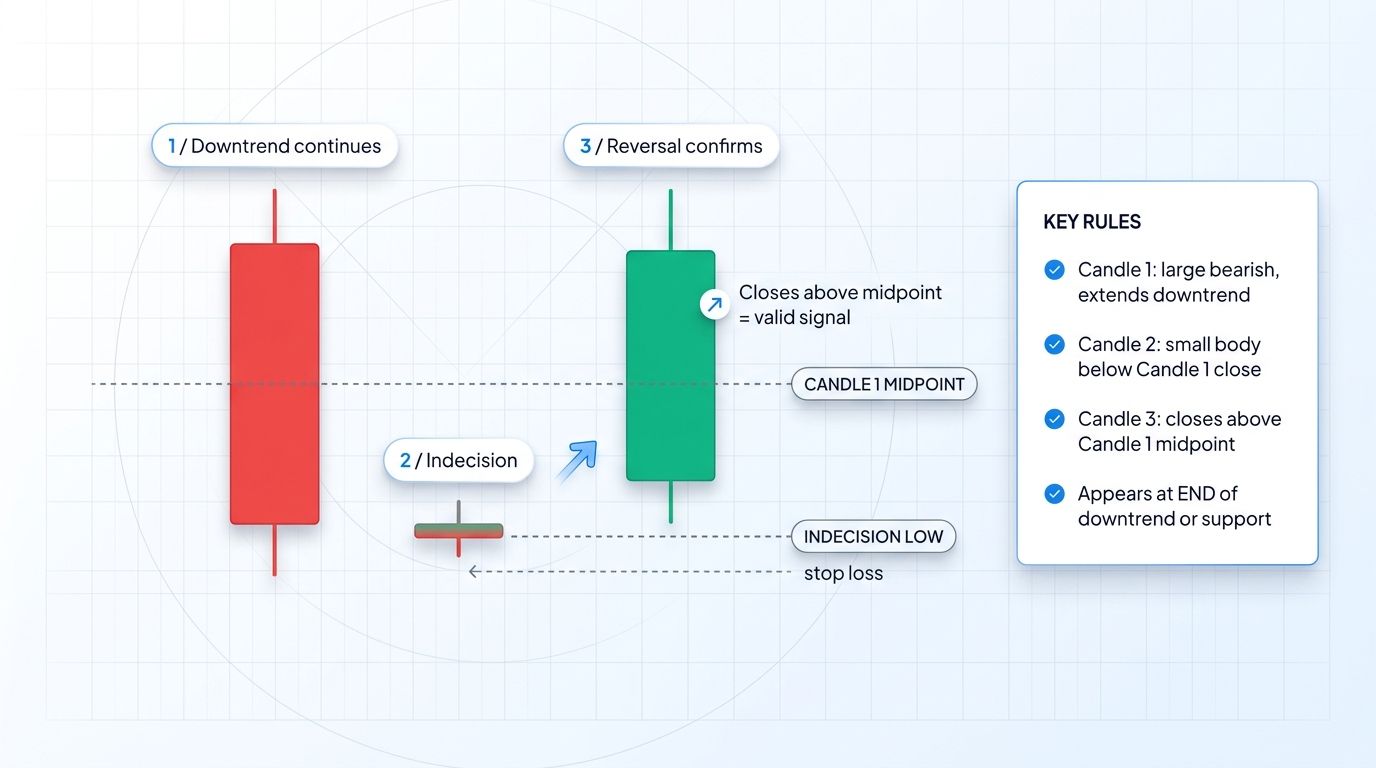
The pattern is composed of three specific candles. Candle 1 is a large bearish (red) candle that extends the existing downtrend. Candle 2 is a small-bodied candle, often a doji or spinning top, that represents indecision as sellers lose momentum. Candle 3 is a large bullish (green) candle that closes well into the body of Candle 1, confirming buyers have taken control.
Traders watch for this pattern because it often marks the exact low of a corrective leg. When it appears at major support, a Fibonacci retracement, or a key moving average, the probability of a genuine reversal increases substantially. The morning star candlestick pattern is particularly powerful in crypto because it captures the transition from capitulation selling to early accumulation.
How to Identify a Morning Star on a Chart
The three-candle structure
The structure of a morning star candlestick pattern is strict, and each candle plays a specific role.
- Candle 1 (Day 1): a strong bearish candle with a long real body that extends the prior downtrend. It should not have an unusually long lower wick, which would already hint at buying pressure.
- Candle 2 (Day 2): a small-bodied candle that represents indecision. It can be a classic doji, a spinning top, or any tiny body. Candle 2's body should sit at or below the close of Candle 1.
- Candle 3 (Day 3): a bullish candle with a strong real body that closes past at least the 50% midpoint of Candle 1's body. A deeper close, above 70% or even engulfing Candle 1, makes the signal stronger.
Key identification rules
Beyond the three-candle shape, context and confirmation rules decide whether the pattern is tradable or noise:
- The pattern must appear at the end of a clear downtrend, not mid-range or near resistance.
- Candle 2's body should be small in absolute terms compared to Candle 1. A large Candle 2 invalidates the signal.
- Candle 3 should close above the midpoint of Candle 1's body. Below that threshold, the reversal is incomplete.
- Higher volume on Candle 3 than on Candle 1 adds significant conviction. Reversals on declining volume frequently fail.
- The pattern gains credibility at horizontal support, a 0.618 or 0.786 Fibonacci retracement, a major moving average, or a prior breakdown level retested from below.
Why the Morning Star Works: The Psychology
Every reliable candlestick pattern reflects a psychological shift, and the morning star maps the shift from seller dominance to buyer control across three sessions. Candle 1 is pure bearish sentiment: shorts press, longs stop out, and the path of least resistance is down. Price closes near the low, and the narrative heading into the next session is continued decline.
Candle 2 is where the story changes. Sellers try to extend the move, but buyers start absorbing supply at lower prices. The tug of war produces a small body with little net progress. This is the moment when weak hands finish selling and stronger hands begin accumulating.
Candle 3 is confirmation. Buyers step in aggressively, driven by the absence of new lows and improving order flow. The strong bullish close past Candle 1's midpoint tells the market the trend has changed. The morning star candlestick pattern captures this complete handover in one recognizable sequence, which is why it ranks among the highest quality bullish reversal setups.
Morning Star vs Other Bullish Reversal Patterns
Morning Star vs Bullish Engulfing
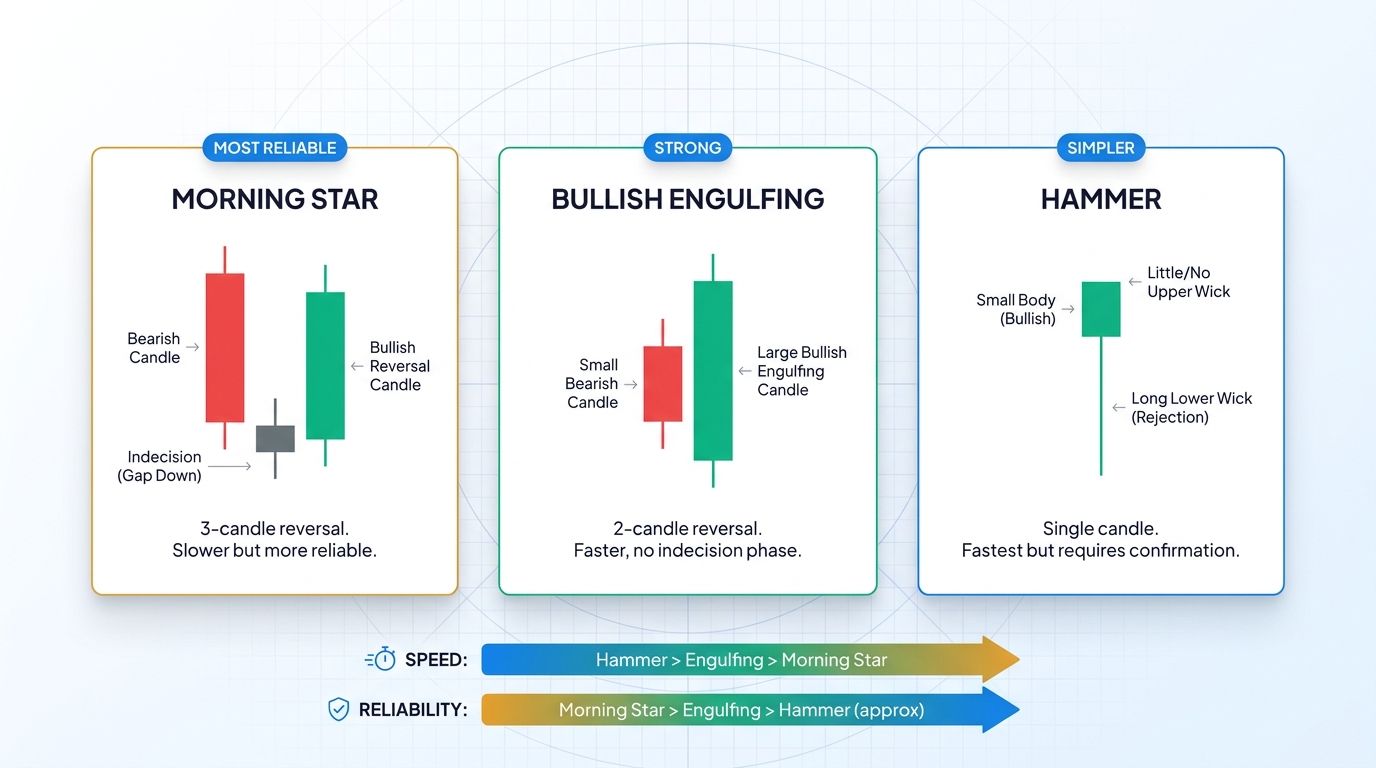
The morning star vs bullish engulfing comparison comes up constantly because both are bullish reversals involving a bearish candle followed by a bullish one. The difference is the middle candle. Bullish engulfing is a two-candle pattern where a large bullish candle fully engulfs the prior bearish candle in a single session. It triggers earlier, which means less drawdown from the signal point. The cost is that it skips the indecision phase, so false signals are common in choppy markets. Morning star is slower because it adds an indecision pause, but that pause is exactly what filters out noise.
Morning Star vs Hammer
Hammer is a single-candle reversal with a small body near the top and a long lower wick. It is fast to identify but weak as a standalone signal because one candle cannot capture a full handover of control. Morning star confirms across three candles what hammer hints at in one. When a hammer on Day 2 is followed by a strong bullish Day 3, you effectively have a morning star.
Morning Star vs Three White Soldiers
Three white soldiers is formed by three consecutive bullish candles with higher closes. The distinction is the starting point. Morning star begins with a bearish Candle 1, then passes through indecision, then reverses. Three white soldiers does not require a prior bearish candle. Morning star is a cleaner reversal signal; three white soldiers is often a momentum continuation signal.
How to Trade a Morning Star Pattern
A solid morning star trading strategy combines strict pattern rules with risk management and confluence. The rules below keep the edge intact and prevent the common mistake of trading every three-candle shape that looks close enough.
Rule 1: Require a clear downtrend first
A morning star candlestick pattern only works as a reversal if there is a trend to reverse. Scan the last 10 to 20 candles. If price has been making lower highs and lower lows, context is valid. If price is ranging or already extended, any three-candle shape that resembles a morning star is noise.
Rule 2: Confirm Candle 3 closes past Candle 1's midpoint
This is the non-negotiable confirmation rule. A Candle 3 that only recovers 20 to 30 percent of Candle 1's body shows weak buying pressure and often leads to continuation lower. Wait for at least 50 percent recovery; 75 percent or more is a strong signal.
Rule 3: Volume confirmation
Rising volume on Candle 3 compared to Candle 1 adds conviction because it shows real participation behind the reversal. In crypto, compare Candle 3 volume against the average of the prior 10 to 20 candles, not just Candle 1 in isolation.
Rule 4: Use confluence
Morning star signals dramatically improve with confluence. A morning star at a key horizontal support level, with oversold RSI below 30, and a bullish divergence between price and RSI or MACD, is a high-probability long setup. Morning star in isolation should be sized smaller.
Entry, Stop, Target Framework
The morning star reversal offers a clean structure for entry, stop, and target:
- Entry (aggressive): on the close of Candle 3, once the midpoint rule is confirmed.
- Entry (conservative): on a retest of Candle 3's midpoint or Candle 2's high.
- Stop loss: just below the low of Candle 2. If price breaks that low, the pattern is invalidated.
- Target 1: the next swing high or nearest resistance, sized for a minimum 1:2 reward-to-risk.
- Target 2: a prior breakdown level or higher timeframe resistance, typically at 1:3 or better.
- Management: scale out partial profits at Target 1, trail the stop to breakeven, and let the remainder run toward Target 2.
Example: Morning Star at BTC Support
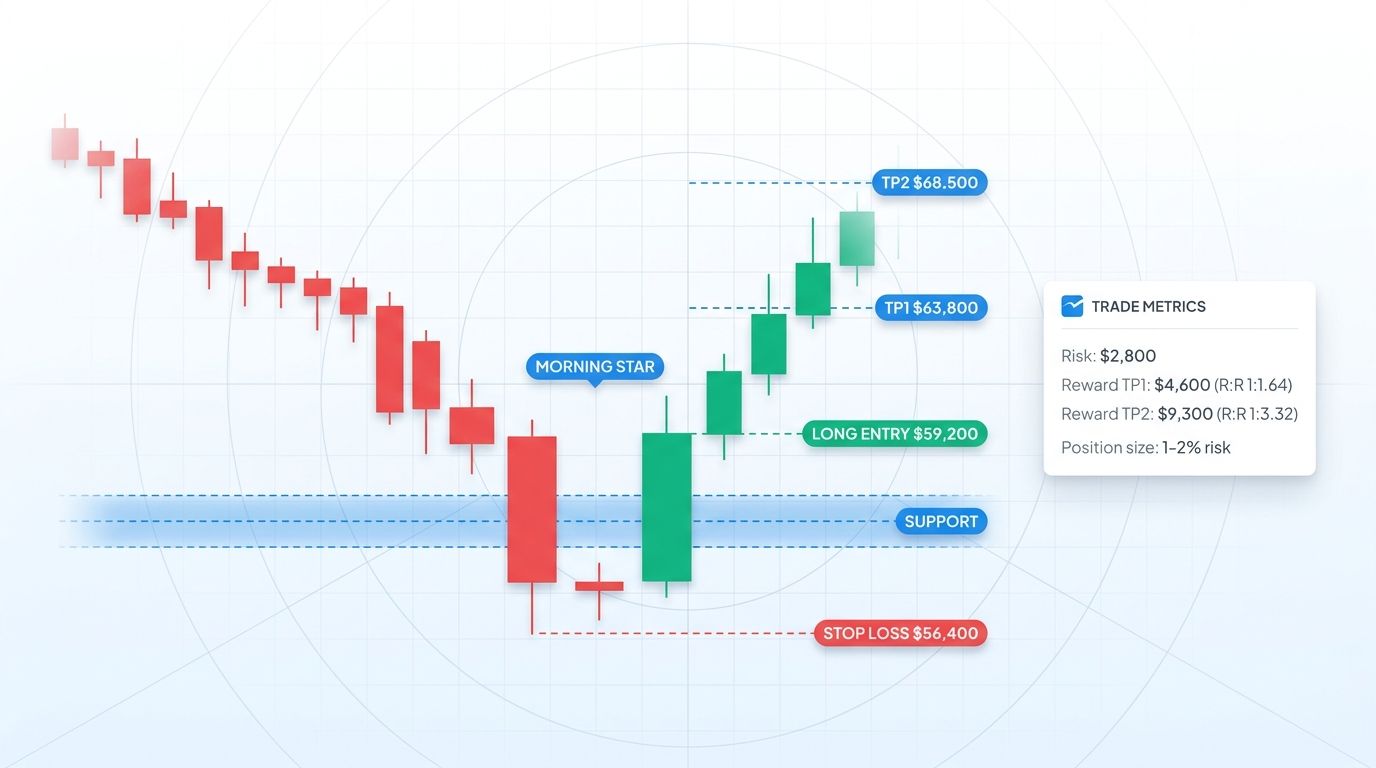
Consider a hypothetical but realistic setup. BTC is in a multi-day downtrend and approaches a weekly support zone around $57,000 after a 12 percent pullback. On the daily chart, three candles form:
- Day 1: a large bearish candle opens at $60,800 and closes at $58,100, a 4.4 percent drop.
- Day 2: a small-bodied doji-like candle near $57,800, low at $56,200, high at $58,400. Sellers pushed but could not close lower.
- Day 3: a strong bullish candle opens at $58,000 and closes at $60,200, above Candle 1's midpoint of roughly $59,450. Volume is 35 percent above the 20-day average.
The trade plan:
- Long entry on the close of Candle 3 at $59,200.
- Stop loss at $56,400, just below Candle 2's low at $56,200.
- Target 1 at $63,800, the prior swing high.
- Target 2 at $68,500, a higher timeframe resistance.
- Position sizing at 1 to 2 percent portfolio risk. With $2,800 risk per coin, a 1 percent risk on a $50,000 account ($500) takes about 0.18 BTC.
This setup offers roughly 1:1.6 reward-to-risk to Target 1 and 1:3.3 to Target 2. Scaling out half at Target 1 and trailing the remainder converts the trade into a classic risk-managed swing.
Common Mistakes When Trading Morning Stars
Even experienced traders leak profits by mishandling the morning star. Avoid these pitfalls:
- Entering before Candle 3 confirms. Anticipating the pattern during Candle 2 chases an unconfirmed shape.
- Ignoring the prior trend. A morning star in a range is not a reversal because there is nothing to reverse.
- Accepting weak Candle 3. If Candle 3 recovers only 20 to 40 percent of Candle 1, win rates drop sharply.
- Trading morning stars on 1-minute and 5-minute charts. Noise dominates and the formation appears without meaning.
- Missing volume confirmation. Low-volume reversals look like morning stars but rarely hold.
- Setting stops too tight. A stop inside Candle 3's body invites random wick hits. Place it below Candle 2's low.
- Shorting counter-trend. Once a valid morning star prints with confluence, the bias is long.
Morning Star Patterns in Crypto Markets
Crypto's 24/7 nature and higher volatility produce far more morning star candidates than traditional markets, but reliability varies dramatically:
- Daily and weekly morning stars on BTC and ETH at strong support: high reliability, often catching multi-week swing lows.
- 4-hour morning stars with volume confirmation and confluence: solid signals for active swing traders.
- 1-hour morning stars: mixed. Require tighter rules, confluence, smaller size.
- 15-minute and lower: many false signals. Most flagged patterns fail.
- Low-cap altcoins: suspect. Thin liquidity distorts candle shapes.
- Weekend morning stars: frequently reverse on Monday when institutional volume returns.
The best practice is to combine a higher timeframe morning star with a lower timeframe entry trigger. A daily morning star aligned with weekly support gives directional bias; a 1-hour or 15-minute pullback within that bias gives a precise entry.
How Altrady Helps You Spot and Trade Morning Star Patterns
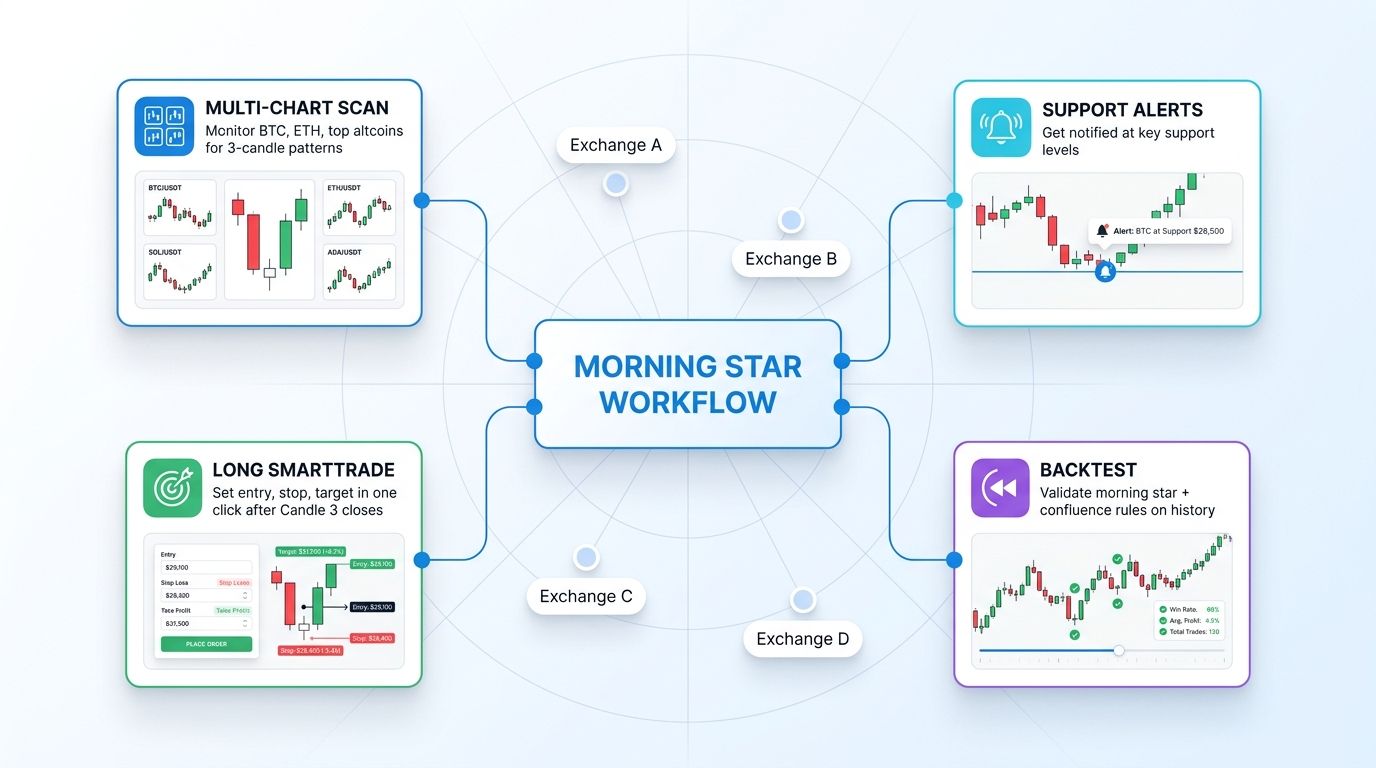
Manually scanning dozens of pairs for a clean morning star is time-consuming. Altrady is a multi-exchange crypto trading terminal built to compress that workflow:
- Multi-chart view lets you scan morning star formations across BTC, ETH, and top altcoins simultaneously.
- Custom alerts at key support levels notify you when price approaches zones where setups are most reliable.
- SmartTrade orders let you set entry, stop loss, and multiple take-profit targets in a single ticket. Once Candle 3 confirms, you execute the full plan in one click.
- Backtest and analytics tools validate morning star plus confluence rules on historical data.
- Paper trading mode lets you rehearse the full entry, stop, and target framework before risking capital.
Start your free trial with Altrady to test the full workflow on your preferred exchanges.
Frequently Asked Questions
Is the morning star pattern reliable?
The morning star is one of the more reliable bullish reversal patterns when it appears at key support after a clear downtrend. Historical studies put win rates in the 60 to 75 percent range when confluence factors like volume confirmation, oversold conditions, and horizontal support are present. Without context, reliability drops significantly. Always wait for Candle 3 to close past Candle 1's midpoint before treating the signal as valid.
What is the difference between a morning star and a bullish engulfing pattern?
The morning star candlestick pattern is a three-candle formation with a distinct indecision phase (Candle 2) before the reversal confirms on Candle 3. Bullish engulfing is a two-candle pattern where a single bullish candle fully engulfs the prior bearish candle, with no indecision pause. Morning star is slower but often more reliable because the middle candle filters out noise. Bullish engulfing triggers earlier but produces more false signals without confluence.
Can a morning star appear without a gap?
Traditional equity morning star patterns often include a gap down before Candle 2 and a gap up before Candle 3. In 24/7 crypto markets, gaps are rare because the market never closes. Most crypto morning stars appear without visible gaps, and that is fine. The structure remains valid as long as Candle 2 has a small body and Candle 3 closes past Candle 1's midpoint.
What timeframe is best for trading morning stars?
Daily and weekly morning stars are the most reliable because they filter noise and capture real sentiment shifts. 4-hour charts work well for active swing traders with strict confluence rules. Below 1-hour, signals become frequent but unreliable. Match the timeframe to your holding period: weekly for position traders, daily for swing traders, 4-hour for active traders.
How do I set a stop loss for a morning star trade?
Place the stop just below the low of Candle 2, the indecision candle. That low is the pattern's invalidation point: if price trades below it, the reversal has failed. A stop just below Candle 2's low is tight enough to keep reward-to-risk favorable and wide enough to avoid normal volatility wicks. Avoid placing the stop inside Candle 3's body, because that range often gets retested before the real move begins.
Conclusion
The morning star candlestick pattern is a three-candle bullish reversal that captures the complete transition from sellers to buyers. Its power comes from the middle indecision candle, which filters out noise that plagues single-candle and two-candle reversal signals. The pattern is most reliable at key support levels after a clear downtrend, with volume confirmation on Candle 3 and confluence from oversold indicators or higher timeframe structure.
Patient traders who wait for Candle 3 to close past Candle 1's midpoint, size positions at 1 to 2 percent risk, and place stops below Candle 2's low consistently extract the best risk-reward from morning star setups. To put this framework into practice without risking capital first, start your free trial with Altrady and use paper trading to rehearse the full entry, stop, and target workflow on real market data.