Bitcoin dominance is one of the most watched metrics in the cryptocurrency market. It measures Bitcoin's share of total crypto market capitalization and serves as a barometer for the entire digital asset ecosystem. Whether you are a seasoned trader or just getting started, understanding bitcoin dominance can give you a significant edge when making portfolio decisions.
As the crypto market matures, bitcoin dominance continues to fluctuate based on market cycles, investor sentiment, regulatory developments, and the rise of new blockchain ecosystems. Knowing how to interpret these shifts can help you time your entries, rotate between assets, and manage risk more effectively. In this guide, we break down everything you need to know about bitcoin dominance and how to use it in your trading strategy.
1. What Is Bitcoin Dominance?
Bitcoin dominance, often abbreviated as BTC.D, represents the percentage of the total cryptocurrency market capitalization that belongs to Bitcoin. It is expressed as a simple ratio: Bitcoin's market cap divided by the total market cap of all cryptocurrencies combined. For example, if Bitcoin's market cap is $1.2 trillion and the total crypto market cap is $2.4 trillion, then bitcoin dominance sits at 50%.
This metric was introduced in the early days of cryptocurrency tracking to provide context for Bitcoin's position relative to the growing number of altcoins. When Bitcoin was the only cryptocurrency, its dominance was effectively 100%. As Ethereum, Litecoin, Ripple, and thousands of other tokens launched, that share began to shrink over time.
Bitcoin dominance is not a price indicator on its own. A rising bitcoin dominance does not necessarily mean that Bitcoin's price is going up. It simply means that Bitcoin is gaining a larger share of the total market relative to altcoins. Conversely, a declining bitcoin dominance can occur even if Bitcoin's price is rising, as long as altcoins are rising faster. This distinction is critical for traders who rely on this metric for decision-making.
Key characteristics of bitcoin dominance include:
- Relative metric: It compares Bitcoin to the entire crypto market, not to fiat currencies
- Market sentiment gauge: Rising dominance typically signals risk-off sentiment in crypto
- Cycle indicator: Dominance tends to follow multi-year patterns tied to halving cycles
- Not a standalone signal: It should always be analyzed alongside price action and volume
2. How Bitcoin Dominance Is Calculated
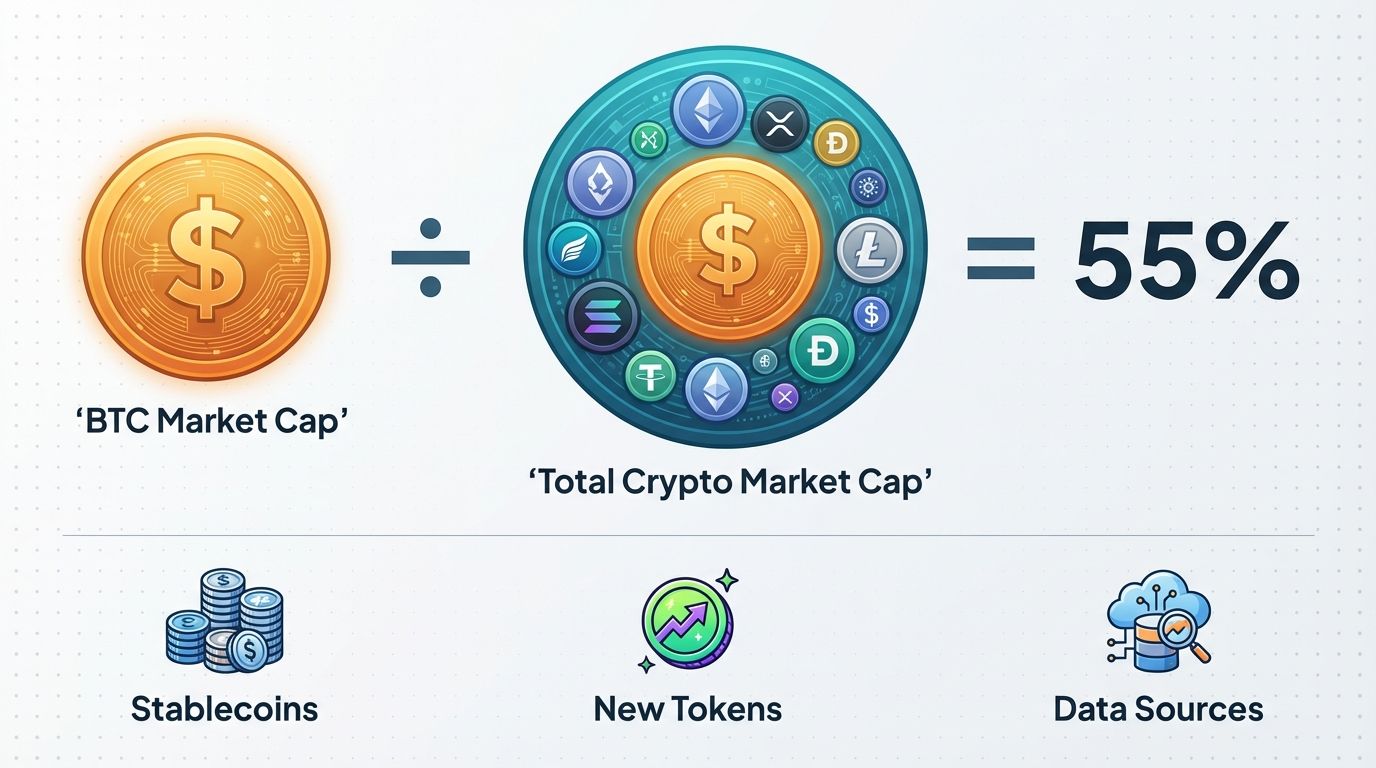
The formula for bitcoin dominance is straightforward on the surface, but the details matter significantly. The basic calculation divides Bitcoin's market capitalization by the total cryptocurrency market capitalization and multiplies by 100 to get a percentage.
BTC Dominance = (Bitcoin Market Cap / Total Crypto Market Cap) x 100
Bitcoin's market cap is calculated by multiplying its current price by the circulating supply of BTC. As of early 2026, there are roughly 19.8 million BTC in circulation out of the 21 million maximum supply. The total crypto market cap includes every listed cryptocurrency and token tracked by the data provider.
However, the way total market cap is measured introduces nuances that traders should understand:
- Stablecoin inclusion: Major data providers like CoinMarketCap and CoinGecko include stablecoins (USDT, USDC, DAI) in the total market cap. Since stablecoins grow with adoption but do not appreciate in value, their expansion can artificially dilute bitcoin dominance
- Token proliferation: Thousands of new tokens launch every month on platforms like Solana, Base, and BNB Chain. Many of these are meme tokens or low-liquidity projects that inflate the total market cap on paper
- Wrapped and derivative tokens: Assets like Wrapped Bitcoin (WBTC) or Bitcoin ETF tokens add complexity. Some providers exclude these to avoid double counting
- Data source differences: CoinMarketCap, CoinGecko, and TradingView may show slightly different dominance figures because each platform tracks a different set of assets and uses different methodologies
For more accurate analysis, some traders prefer to use "real bitcoin dominance," which excludes stablecoins from the total market cap calculation. This adjusted metric gives a cleaner picture of how capital flows between Bitcoin and speculative altcoins without the noise of stablecoin growth.
3. Historical Trends in Bitcoin Dominance
Studying the historical patterns of bitcoin dominance reveals clear cycles that correlate with broader market phases. Understanding these trends helps traders anticipate potential shifts and position their portfolios accordingly.
The 2017 Altcoin Boom
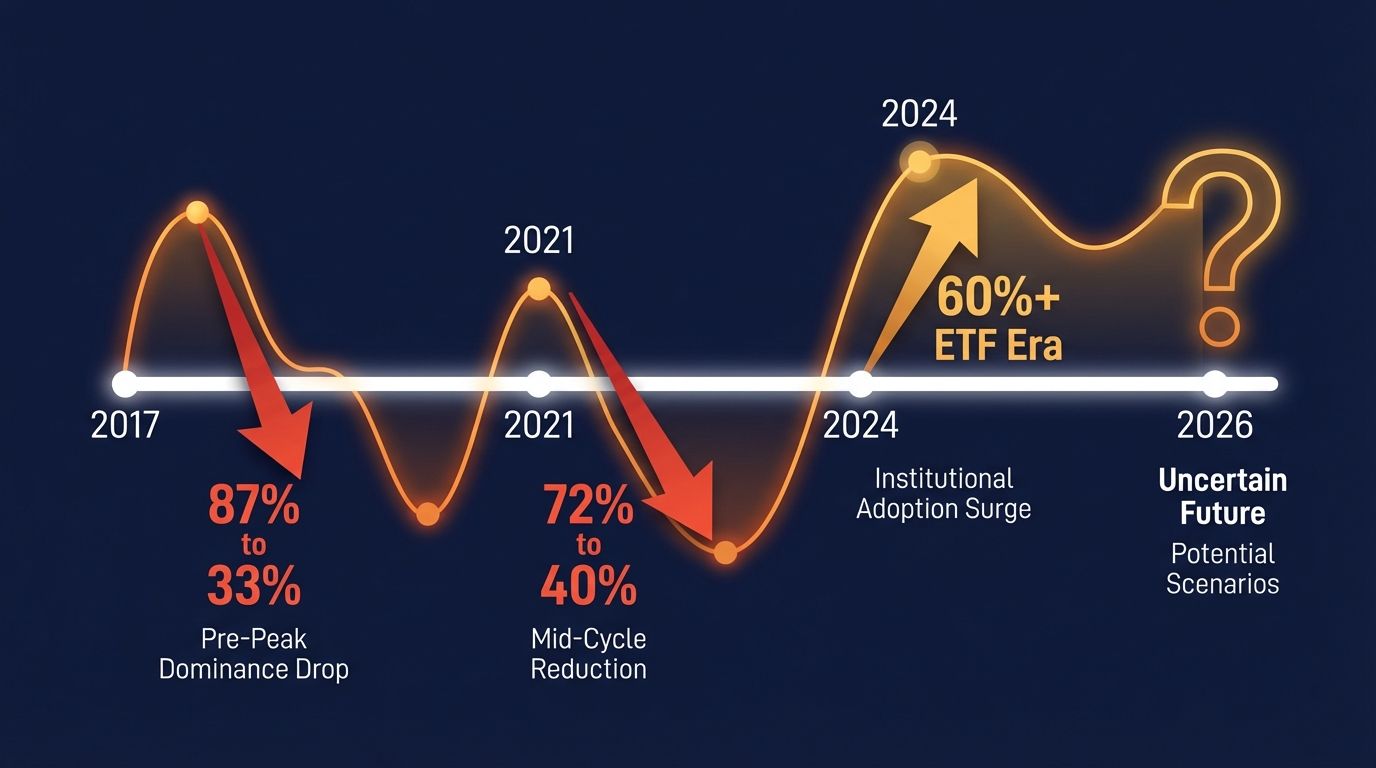
In January 2017, bitcoin dominance stood at approximately 87%. The ICO (Initial Coin Offering) craze that swept through the market during that year changed everything. Thousands of new tokens launched on Ethereum, attracting massive speculative capital. By January 2018, bitcoin dominance had crashed to around 33%, its lowest point in history at that time. This dramatic decline happened even as Bitcoin's price surged from under $1,000 to nearly $20,000, because altcoins were appreciating at an even faster rate. When the bubble burst, dominance gradually climbed back as altcoins lost value more quickly than Bitcoin during the 2018-2019 bear market.
The 2020-2021 DeFi Summer and NFT Boom
Bitcoin dominance peaked at roughly 72% in early 2021 before beginning another significant decline. The explosion of Decentralized Finance (DeFi) protocols on Ethereum, the rise of Solana and Avalanche as alternative Layer 1 platforms, and the NFT mania of mid-2021 drove enormous capital into altcoins. By November 2021, bitcoin dominance had dropped to approximately 40%. Ethereum's growing market share was a primary driver, as the DeFi and NFT ecosystems were built predominantly on its network. This cycle demonstrated that bitcoin dominance declines tend to accelerate during the euphoric phase of bull markets.
The 2024-2025 Bitcoin ETF Era
The approval of spot Bitcoin ETFs in the United States in January 2024 introduced a new dynamic to bitcoin dominance. Institutional capital flowed into Bitcoin through regulated ETF products at an unprecedented rate, pushing bitcoin dominance above 60% by mid-2025. This was notable because it represented a structural shift. Unlike previous cycles where dominance rose primarily during bear markets as altcoins bled, the 2024-2025 period saw dominance climb during a bull market as institutional investors preferred the regulatory clarity and liquidity of Bitcoin over altcoins. By early 2026, the market began to show early signs of a rotation into select altcoins, particularly those tied to real-world assets and AI-driven blockchain projects.
Key Takeaways from Historical Patterns
- Bitcoin dominance tends to rise during early bull markets and bear markets
- Dominance declines sharply during the euphoric altcoin season phase of bull markets
- Each cycle low in dominance has generally been higher than the previous one (33% in 2018 vs. 40% in 2021), suggesting Bitcoin's floor of market share may be rising
- Structural factors like ETFs can override traditional cycle patterns
4. What Rising and Falling Bitcoin Dominance Means for Traders
Interpreting changes in bitcoin dominance requires looking at the metric in context. A rising or falling dominance number tells a different story depending on whether the overall market cap is expanding, contracting, or staying flat.
Scenarios When Bitcoin Dominance Rises
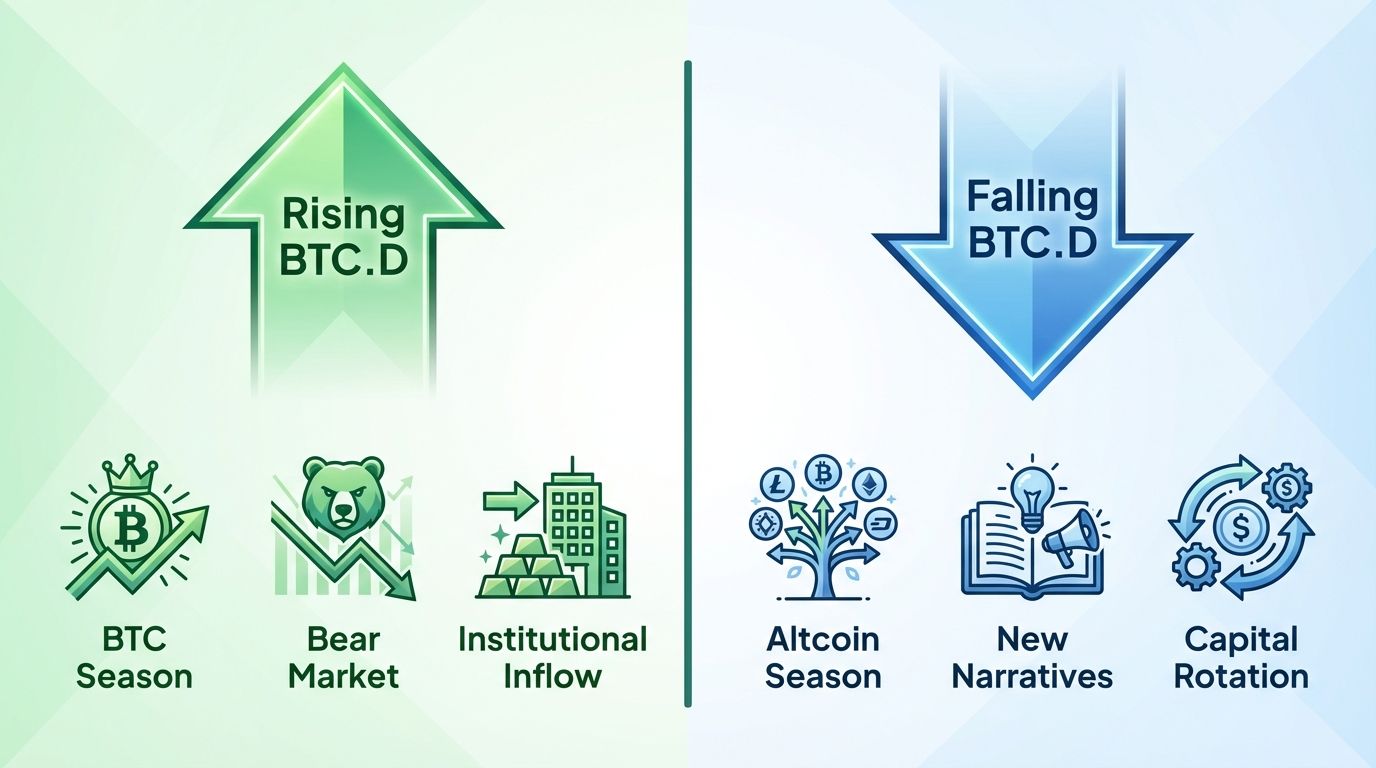
- BTC price up, altcoins flat or down: This is the classic "Bitcoin season" scenario. Capital is concentrating into Bitcoin while altcoins underperform. Traders should consider increasing BTC allocation and reducing altcoin exposure
- BTC price down, altcoins down more: This typically occurs in bear markets. Bitcoin is holding value better than altcoins, acting as a relative safe haven within crypto. Capital preservation becomes the priority
- Institutional inflow: When large institutional players enter through ETFs or direct holdings, they predominantly buy Bitcoin, pushing dominance higher without necessarily hurting altcoin prices
Scenarios When Bitcoin Dominance Falls
- Altcoins rising faster than BTC: This is the hallmark of "altcoin season." Capital is rotating from Bitcoin into altcoins as traders chase higher returns. This is often the most profitable phase for active traders who can identify winning altcoins early
- New sector narrative: The emergence of a hot narrative (DeFi in 2020, NFTs in 2021, AI tokens in 2024) can pull capital away from Bitcoin into specific altcoin sectors
- BTC price flat, altcoins rising: This suggests traders are comfortable with their BTC holdings and are deploying additional capital into altcoins for growth
The most dangerous scenario for traders is when bitcoin dominance rises while the total market cap declines. This combination signals a flight to quality within crypto and often precedes deeper market drawdowns. In contrast, when dominance falls while total market cap rises, it suggests a healthy, broad-based rally that tends to benefit the largest number of assets.
5. Trading Strategies Based on Bitcoin Dominance
Successful crypto traders use bitcoin dominance as one of several tools to guide their portfolio allocation and trade timing. Here are proven strategies that incorporate this metric effectively.
Portfolio Rotation Strategy
The rotation strategy involves shifting capital between Bitcoin and altcoins based on dominance trends. When bitcoin dominance is trending upward and breaking resistance levels on the chart, traders increase their Bitcoin allocation (often to 60-80% of their crypto portfolio). When dominance begins to break down from a peak and starts trending lower, traders gradually rotate capital into high-quality altcoins with strong fundamentals.
Key rules for this strategy:
- Use weekly or monthly timeframes for dominance analysis to avoid noise
- Confirm dominance trends with volume data and total market cap direction
- Rotate gradually rather than making sudden all-or-nothing moves
- Set clear dominance levels as triggers (for example, start rotating into altcoins when BTC.D drops below 55% with confirmation)
Altcoin Season Timing
The altcoin season index and bitcoin dominance work hand in hand. Altcoin season is generally confirmed when bitcoin dominance has been declining for several weeks and 75% or more of the top 50 altcoins are outperforming Bitcoin over a 90-day period. Traders who enter altcoin positions early in this phase can capture significant gains.
Timing signals to watch for:
- Bitcoin dominance breaks below a key support level (often around 50-55%)
- Ethereum's market share begins rising simultaneously
- Trading volume on altcoin pairs increases significantly
- Social media sentiment shifts heavily toward altcoin discussions
- Bitcoin's price consolidates after a major rally, giving altcoins room to catch up
Sector Rotation Within Altcoins
When bitcoin dominance is falling, not all altcoins perform equally. Smart traders break down the altcoin market into sectors (Layer 1, DeFi, gaming, AI, real-world assets, meme coins) and track which sectors are absorbing the most capital. This sector-based approach allows for more targeted positioning rather than broad altcoin exposure.
Risk Management Using Dominance
Bitcoin dominance also serves as a risk management tool. When dominance starts rising sharply from a low point, it often signals that the altcoin party is ending. Traders who use dominance as an exit signal for altcoin positions can preserve profits that would otherwise evaporate during the inevitable correction. Setting alerts at key dominance levels (such as when BTC.D rises above 50% or above 60%) provides an early warning system for portfolio rebalancing.
6. Tools for Tracking Bitcoin Dominance
Monitoring bitcoin dominance effectively requires the right set of tools. Here are the most popular platforms and resources that traders use to track and analyze this metric.
Charting Platforms
- TradingView: The most popular choice for charting BTC dominance. Use the ticker symbol BTC.D to access the dominance chart. You can apply technical analysis tools like trendlines, moving averages, and RSI directly to the dominance chart. TradingView also offers USDT.D (Tether dominance) and ETH.D (Ethereum dominance) for additional context
- Altrady: Offers a comprehensive trading dashboard where you can monitor Bitcoin dominance alongside your actual portfolio positions. The platform allows you to set custom alerts based on dominance changes and combine this data with real-time price action across multiple exchanges
Data Aggregators
- CoinMarketCap: Provides a dedicated bitcoin dominance chart with historical data going back to 2013. Also shows dominance for other major assets like Ethereum and BNB
- CoinGecko: Offers similar dominance data with a slightly different methodology. Comparing both sources can help identify discrepancies caused by different token inclusion criteria
On-Chain Analytics
- Glassnode: Provides on-chain metrics that complement dominance analysis, including Bitcoin's realized cap dominance, which weights market cap by the price at which each coin last moved rather than current spot price
- CryptoQuant: Tracks exchange flows and whale activity for Bitcoin and major altcoins, helping traders understand the capital movements behind dominance shifts
Custom Dashboards and APIs
Advanced traders often build custom dashboards that combine bitcoin dominance with other metrics. By pulling data from CoinGecko or CoinMarketCap APIs, you can create automated alerts and visualizations tailored to your specific strategy. Key metrics to combine with dominance include total crypto market cap, Bitcoin trading volume, Ethereum/Bitcoin ratio (ETH/BTC), and exchange inflow/outflow data.
The most effective approach is to use multiple tools in combination. A charting platform like TradingView for technical analysis of the dominance chart, a trading platform like Altrady for execution and portfolio management, and an on-chain analytics tool for deeper fundamental insights create a robust analytical framework.
Start Trading Smarter with Bitcoin Dominance Insights
Understanding bitcoin dominance gives you a critical edge in navigating the crypto market. Whether the market is shifting toward Bitcoin or entering an altcoin season, having the right tools to track these changes and act on them quickly is essential.
Altrady provides everything you need to monitor bitcoin dominance, manage your portfolio across multiple exchanges, and execute trades with speed and precision. With advanced charting, customizable alerts, and a unified trading dashboard, Altrady helps you stay ahead of market rotations and capitalize on dominance shifts before the crowd catches on. Sign up for a free trial today and experience how professional-grade tools can transform your crypto trading results.
Frequently Asked Questions
What is a good bitcoin dominance level for buying altcoins?
There is no single "perfect" level, but historically, bitcoin dominance above 60-65% has often marked attractive entry zones for altcoins. When dominance is high and begins to show signs of declining, it typically signals the early stages of an altcoin season. However, always confirm with other indicators like total market cap trends, trading volume, and individual altcoin fundamentals before making allocation decisions.
Does bitcoin dominance affect crypto prices directly?
Bitcoin dominance does not directly cause price movements. It is a descriptive metric that reflects the relative distribution of capital between Bitcoin and altcoins. However, changes in dominance can indicate shifts in market sentiment and capital flows that precede significant price moves. Traders use it as a leading indicator to anticipate whether the market favors Bitcoin or altcoins in the near term.
Why has bitcoin dominance been rising since the ETF approvals?
The spot Bitcoin ETF approvals in January 2024 opened the door for institutional investors, pension funds, and wealth managers to gain Bitcoin exposure through familiar, regulated financial products. These investors predominantly buy Bitcoin rather than altcoins because of its regulatory clarity, liquidity, and established track record. This sustained institutional inflow has pushed billions of dollars into Bitcoin specifically, raising its share of total crypto market cap and keeping dominance elevated compared to previous cycle norms.
Can bitcoin dominance reach 100% again?
It is extremely unlikely that bitcoin dominance will return to 100%. The crypto ecosystem now includes thousands of actively traded tokens, a massive stablecoin market (over $200 billion in total supply), and established blockchain platforms like Ethereum with their own thriving ecosystems. Structural factors like stablecoin growth alone ensure that Bitcoin's dominance will likely remain well below historical highs. Most analysts consider 70-75% as a realistic ceiling for future dominance peaks.
How often should I check bitcoin dominance?
For most traders, checking bitcoin dominance on a weekly basis is sufficient. Dominance trends move slowly and unfold over weeks to months, so daily fluctuations add noise without providing actionable insights. The exception is during major market transitions or volatility events, when monitoring dominance on a daily basis can help you react to rapid shifts. Setting alerts at key levels (such as 50%, 55%, 60%, and 65%) is more effective than constant monitoring.