If you’re serious about trading crypto, on-chain analysis is a secret weapon. It lets you see what’s actually happening on the blockchain, not just what the charts say. Think wallet movements, exchange inflows, token flows, dormant coins waking up. That’s the kind of data that gives you an edge.
But here’s the catch: there are a ton of on-chain analytics tools out there. Some are built for speed. Others are geared toward deep-dive research. Some are free, some cost a fortune. The right one for you? That depends on your goals, your trading style, and the kind of data you rely on.
Let’s break it down so you can make a smart, informed decision.
First, What Is On-Chain Analysis?
On-chain analysis is all about extracting signals from the blockchain itself. It looks at things like:
- Wallet activity (Who’s buying? Who’s selling?)
- Transaction volume (Are things heating up or cooling down?)
- Token flows (Are coins moving to exchanges or being locked away?)
- Network growth (How many new addresses are popping up?)
It’s not a replacement for technical analysis or fundamental analysis; it’s a third layer that adds context. While charts show price action and news shows narratives, on-chain data shows what people are actually doing with their assets in real time.
Key Features to Look For in an On-Chain Tool
Before you jump into a subscription or spend hours learning a platform, make sure the tool fits your needs. Here are the essentials to check:
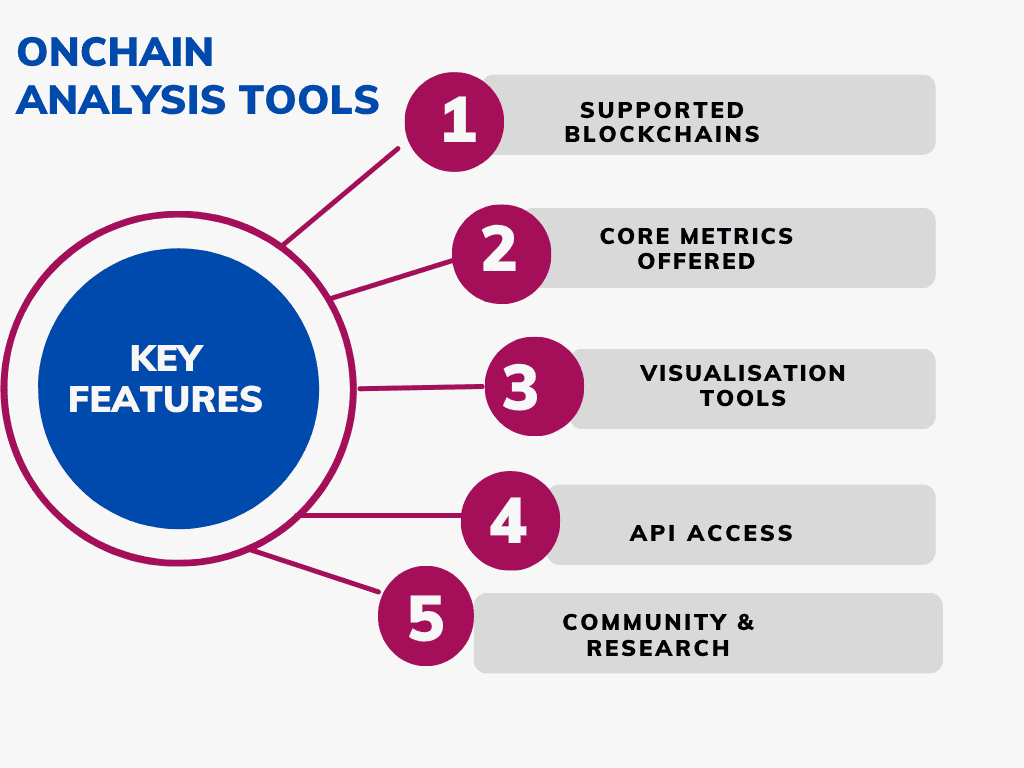
Supported Blockchains
Sounds obvious, but it’s easy to overlook. Not every platform covers every chain. Some are heavy on Bitcoin and Ethereum but light on Solana, Avalanche, or Layer 2s. Make sure the tool actually supports the assets you trade or invest in.
Core Metrics Offered
You want more than just price charts. Look for rich metrics like:
- Active addresses: Shows real user activity.
- Exchange inflows/outflows: Are people depositing to sell or withdrawing to hold
- HODL waves: Tracks how long coins are held before moving.
- MVRV (Market Value to Realized Value): Helps spot overvalued or undervalued conditions.
- Stablecoin Supply Ratio (SSR): A way to measure buying power in the market.
These metrics can help you catch shifts in sentiment before the price reacts.
Visualization Tools
The best tools don’t just give you numbers—they make them usable. That means dashboards, interactive charts, overlays, and alerts. If the data isn’t easy to read or act on, it’s not helping you.
API Access
If you’re running your own models, building dashboards, or feeding data to a trading bot, API access is a must. Some platforms offer full-featured APIs, others restrict them to enterprise users.
Community & Research
Some platforms come with built-in communities or curated insights from analysts. Others offer user-generated dashboards or templates to get you started. This is especially useful if you’re still learning the ropes or want a second opinion before you make a move.
How to Choose Based on Your Trading Style
Not all traders use on-chain data the same way. The right tool for a long-term investor won’t cut it for a high-frequency trader. Here’s how to match tools to your style:
If You’re a Day Trader
Speed is everything. You need real-time alerts, rapid flows to and from exchanges, and short-term indicators that let you act fast. Look for:
- CryptoQuant: Known for clean dashboards and real-time exchange metrics.
- Glassnode Studio (Pro tier): Offers granular, time-sensitive indicators with historical context.
Look for platforms that offer alerts on things like sudden whale movements or large transfers to exchanges. You’re trying to catch moves before they hit the charts.
If You’re Deep Into DeFi
You want a tool that tracks smart contract data, protocol-level insights, liquidity movements, and token behavior across decentralized platforms. Ideal picks:
- IntoTheBlock: Offers DeFi-specific indicators and wallet profiling.
- Dune: Lets you write your own SQL queries on live blockchain data, and browse dashboards built by other users.
If you’re farming yield, swapping on DEXs, or tracking DAO activity, you need more than just address flows; you need transparency into the protocols themselves.
If You’re a Long-Term Investor
Zoom out. You care about market cycles, adoption trends, and big-picture metrics. You’re looking for leading indicators that show where the market might be heading in weeks or months, not hours.
Go with tools that offer:
- Messari: Combines on-chain analytics with deep fundamental research.
- Santiment: Tracks social sentiment, developer activity, and long-term indicators.
- Glassnode (Advanced): Offers macro-level metrics like MVRV and NUPL (Net Unrealized Profit/Loss).
Look for platforms that publish weekly insights or data-backed research reports. These can help you build a conviction-based thesis for the long haul.
If You’re a Quant or Developer
You’re not just consuming data—you’re building strategies or visualizations on top of it. You’ll need:
- Dune: Fully customizable, SQL-based queries, huge community of data analysts.
- Glassnode API: Great for modeling market behaviors programmatically.
- Nansen (Pro tier): Combines wallet labeling and flow analysis, useful for modeling trader cohorts.
Make sure the platform allows for raw data exports, API throttling, and dashboard integrations with tools like Python, Jupyter, or TradingView.
Here’s a quick comparison of top on-chain tools:
| Tool | Key Features | Benefits |
| Glassnode | Extensive metrics; visualization; API | Deep insight; real-time alerts; suited for all user types |
| Nansen | Wallet labeling; DeFi/NFT analytics | Track smart money; manage portfolios; trend discovery |
| CryptoQuant | Exchange/miner flows; alert system | Short-term signals; mining-market links |
| Santiment | On-chain, social & dev analytics | Sentiment analysis; custom triggers |
| Dune | Custom SQL dashboards; multi-chain | Flexible analytics; open-source sharing |
| Messari | Research reports; on-chain metrics | In-depth asset evaluation; data-backed investment decisions |
Final Tips Before You Commit
- Start free: Most platforms offer a limited free tier. Test-drive a few and see which ones actually make sense to you.
- Don’t overcomplicate it: You don’t need 50 charts. Pick 2-3 metrics that align with your style and build from there.
- Stay updated: The crypto space evolves fast. Follow your tool’s blog or X account to catch new features and insights.
- Use alerts: Set up email or Telegram alerts so you don’t have to stare at dashboards all day.
Bottom Line
The best on-chain analysis tool for you is the one that fits your goals, your workflow, and your assets. Whether you’re scalping Bitcoin, aping into DeFi protocols, or stacking ETH for the next cycle, there’s a tool built for that.
Start by identifying the data you actually use to make decisions. Then find the tool that delivers it cleanly, quickly, and consistently. That’s the winning combo.
And remember—on-chain data is powerful, but it’s just one lens. Combine it with solid TA, news awareness, and risk management, and you’ll be way ahead of the average trader.