If you’re serious about crypto trading, relying on price charts alone won’t cut it anymore. Today’s edge comes from data: deep, real-time, on-chain intelligence. That’s where tools like Nansen, Glassnode, and Santiment come in. Each unlocks a different layer of insight: wallet flows, network fundamentals, and social sentiment.
Whether you’re chasing altcoin gems or trying to avoid rug pulls, mastering these platforms can help you trade smarter, not harder. Learn how to use them to sharpen your strategy and spot real opportunities.
How to Use Nansen
Nansen’s packed with powerful analytics that let you decode wallet activity, track top movers, and catch trends before they explode. Here’s how you can plug it into your trading setup:

Get Set Up
- Hit up the Nansen site and pick a plan that suits your hustle.
- Link your wallet (MetaMask, Trust Wallet—you know the drill), or drop your address in to start monitoring your portfolio across 40+ chains.
Dig Into the Tools That Matter
Smart Money Tracker
See what the whales, big funds, and veteran traders are up to. If they’re loading up or dumping a token, you’ll know.
Token God Mode
Go deep on any token—look at wallet distribution, trading volume, and price action. Great for figuring out whether something’s got solid momentum or is just noise.
AI-Powered Signals
Get live alerts when the market shifts, wallets move big chunks, or trends start to pop. All driven by machine learning. Get just the signals that matter.
PnL Tracker
Track your wins (and losses) across wallets and blockchains. Drill down into exactly where you’re crushing it—or where you need to pivot.
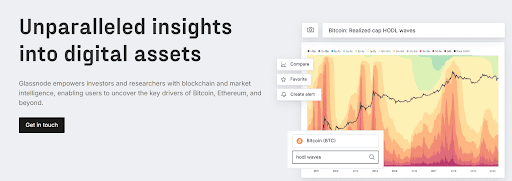
How to Use Glassnode
If you’re serious about trading crypto and want more than just price action, Glassnode is a tool you’ll want in your arsenal. It gives you a direct line to what’s happening on-chain so you can make smarter, data-backed moves. Here’s how to fold it into your routine:
Get on Board
- Head over to Glassnode and create an account. They offer both free and premium tiers depending on how deep you want to go.
- Dive into Glassnode Studio—this is your command center. You’ll get slick dashboards, interactive charts, and powerful workbench tools to start analyzing major assets like BTC and ETH.
Make Sense of the Blockchain Buzz
Explore on-chain metrics like address activity, transaction volume, exchange flows, whale moves, miner earnings, and hash rate. These show you what’s really going on behind the scenes.
Use proprietary indicators such as MVRV, NUPL, Realized Cap, and supply trends to get a pulse on market sentiment. Great for spotting potential turning points.
Customize charts and overlay different metrics to zero in on key patterns and shifts – perfect for building context around market movements.
Stay Ahead of the Curve
- Set up tailored alerts for big on-chain events—whale transactions, liquidity surges, you name it. The moment something moves, you’re in the know.
- Watch Glassnode’s in-house trading signals and forecasts. These use machine learning to crunch data and give predictive insights that actually matter.
Turn Data into Trades
- Time your entries and exits by combining directional indicators with risk metrics. No more chasing pumps—you’ll spot them early.
- Gauge investor mood with behavioral indicators like SOPR and profit ratios. It’s like sentiment analysis with teeth.
- Keep tabs on exchange balances and stablecoin trends to manage exposure and avoid getting blindsided by systemic risks.
Power Up with Advanced Tools
- Backtest strategies using historical data so you're not flying blind.
- Connect via API if you’re running algo strategies or building custom dashboards—ideal for quants and institutional setups.
- Tap into the research hub for expert insights, market updates, and curated reports that help sharpen your strategy.
Example Play:
- Notice Bitcoin outflows from exchanges spike? That could mean accumulation.
- Check MVRV and NUPL to see if we’re in overheated or undervalued territory.
- Set alerts for major wallet shifts or SOPR moves.
- Make your trade.
- Track your positions and retool as the data shifts.
Beyond a charting app, Glassnode is your gateway to understanding how capital is flowing through crypto markets in real time. If you’re trading blind, you’re trading behind. This platform helps you decode the noise and lean into the signals that count.
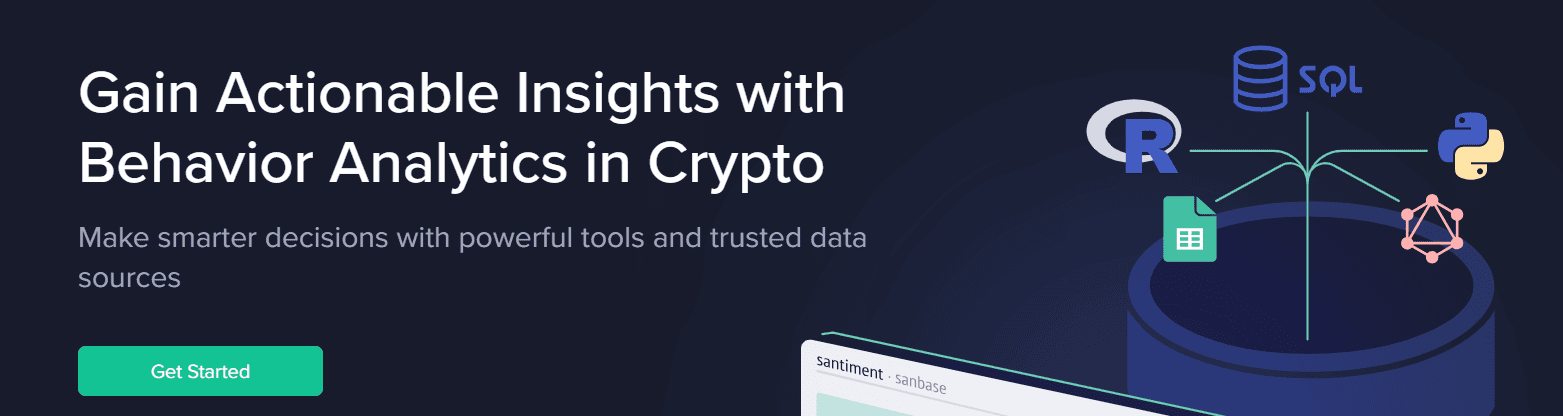
How to Use Santiment
Santiment gives you the full picture—on-chain activity, social sentiment, and dev progress—all in one platform. Here's how to make it part of your trading toolkit:
Get Set Up
- Create an account over on Santiment and choose a plan that suits your needs.
- Hop into Sanbase, the main dashboard, where you’ll find everything from charts and screeners to dev activity trackers.
Scan the Chain
- Track real-time blockchain moves like exchange inflows/outflows, whale wallet behavior, network growth, and token circulation.
- Use metrics like MDIA (Mean Dollar Invested Age) to flag accumulation zones or potential tops. A sharp MDIA dip often means sellers are stepping in.
Decode the Crowd
- Jump into Santiment’s social dashboards to see what the retail crowd’s buzzing about across Twitter, Reddit, and Telegram.
- Watch sentiment swings—positive vs. negative mentions—to spot euphoric peaks or fear-driven lows. These are gold for contrarian plays.
Santiment research shows crowd behavior can be traded against: heavy retail bullishness might be a sign to tread carefully, while panic can signal smart money moving in.
Watch the Builders
- Check project fundamentals by tracking developer activity and GitHub commits.
- Active development can be a strong signal that a token has real staying power, not just hype.
Set Your Triggers
- Build custom alerts for major whale transactions, token movements, or shifts in social chatter.
- Screen and compare assets using Santiment’s dashboards to catch trends, volume moves, or liquidity changes.
Build Smart Strategies
| Strategy | Santiment Feature | Usage Tip |
| Spotting Market Tops | Social Volume, MDIA | Watch for social buzz spikes and MDIA drops before new entries |
| Identifying Entry Points | Sentiment, Whale Behavior | When retail fear meets whale buys, get ready to pounce |
| Tracking Volatility Movers | Social+ Exchnage Data | Set alerts to catch sudden mood shifts or big wallet moves |
| Project Deep Dives | Developer Activity | Filter projects by ongoing development, not just headlines |
Sample Workflow
- Run a scan for trending assets with high whale activity and negative sentiment.
- Dive into on-chain and social dashboards to confirm the setup.
- Set alerts for any large moves or sentiment spikes.
- Execute your trade on your exchange of choice.
- Monitor positions and pivot as the landscape shifts.
Santiment helps you understand what’s really driving the market. If you want to trade ahead of the crowd, this is how you stay one step ahead.
Bottom Line
Using Nansen, Glassnode, and Santiment, whether separately or together, gives crypto traders a powerful edge. Nansen offers real-time insights into smart money movements, Glassnode breaks down on-chain fundamentals, and Santiment tracks social and sentiment trends.
If you combine these tools, you can make more informed decisions based on wallet behavior, network health, and market psychology. The real advantage lies in connecting the dots: when all three signals align, they can reveal high-probability opportunities or early warning signs.