Let’s be honest: price charts only show you part of the story. If you’re relying purely on technical analysis to guide your crypto trades, you’re flying half-blind.
The professional traders are digging deeper. They’re using on-chain metrics to track what’s actually happening on the blockchain itself, where real activity, sentiment, and capital flows live.
Understanding and using on-chain data isn’t just a flex. It’s what separates advanced traders from the rest of the crowd blindly chasing candles.
Here’s how you can use on-chain analysis to trade smarter, spot moves earlier, and stay ahead of the herd.
What Exactly Are On-Chain Metrics?
On-chain metrics are data points pulled straight from the blockchain—unfiltered, transparent, and verifiable. Think of them as the raw heartbeat of a network. They show how much money is moving, who’s active, what whales are up to, and whether the network is healthy or sick.
Unlike technical analysis, which only looks at price action, or sentiment analysis, which can be swayed by hype, on-chain metrics are grounded in hard, on-chain facts. You’re not just seeing price movement; you’re seeing why it’s moving.
Key On-Chain Metrics You Need to Know
Let’s break down the most essential metrics you should have in your toolbox.
1. Active Addresses
This shows how many unique wallet addresses are transacting on the network during a set period.
- Bullish when rising: More users means more network adoption. If it lines up with rising prices and other metrics, that’s a solid green light.
- Bearish when falling: A sharp drop can signal falling interest or usage, a potential red flag before a price decline.
2. Transaction Volume
This tracks how much value is being transferred on-chain.
- High volume + rising prices = legit demand. That’s confirmation that the market move is real.
- Rising prices + low volume? Caution. It could be a weak or manipulated move.
Always compare volume spikes with major news or events—sometimes it's just noise, other times it's the real driver.
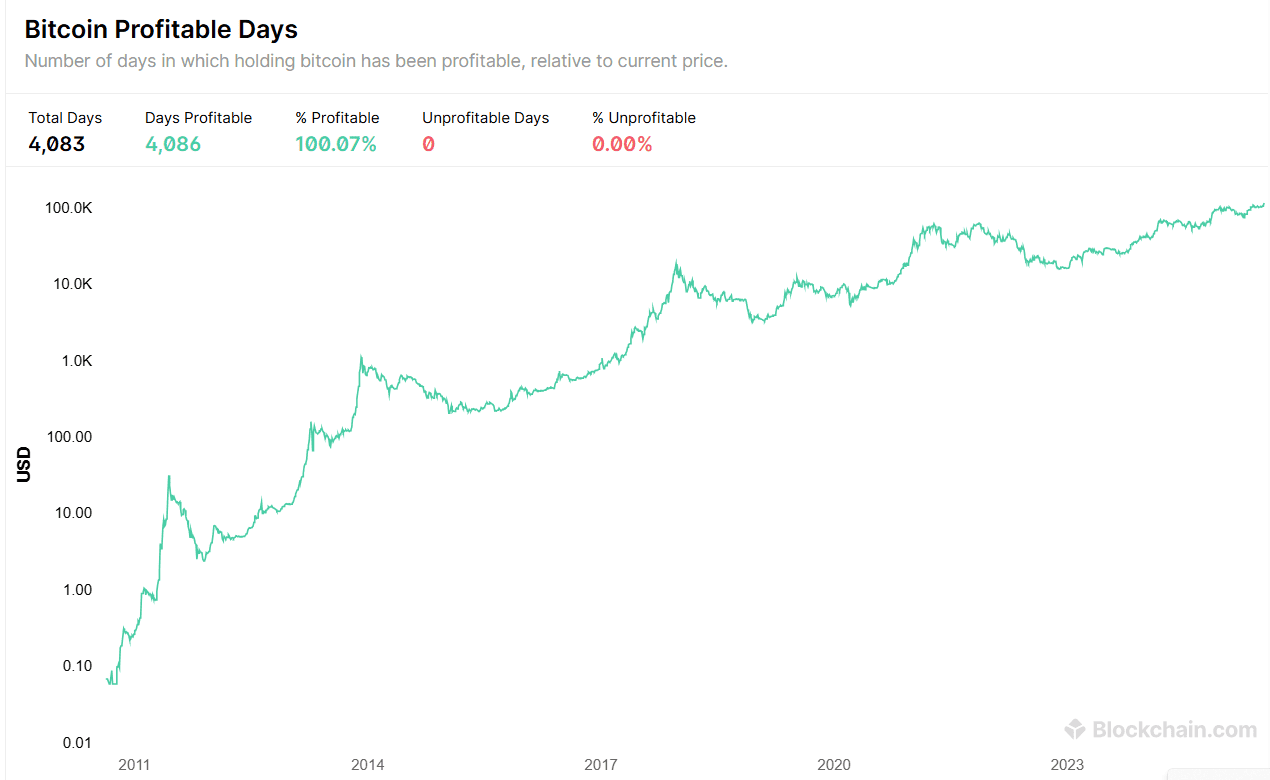
Source: Blockchain.com
3. Exchange Flows (Inflows/Outflows)
This one’s key for timing moves.
- High inflows: People are sending coins to exchanges, often to sell. Watch for incoming sell pressure.
- High outflows: Coins moving off exchanges suggest holders are tucking them away. That’s usually bullish and implies accumulation.
Used correctly, this can be your early warning system before big pumps or dumps.
4. Supply Distribution
This tells you how tokens are spread across holders, from whales to retail.
- Heavy whale concentration: Be careful. A few large wallets can tank the price with a single move.
- Broad, decentralized distribution: That’s healthier for price stability and long-term sustainability.
Some traders even track whale wallets directly to front-run moves—more on that in a minute.
5. Total Value Locked (TVL)
TVL measures the amount of crypto staked in DeFi protocols or smart contracts.
- Rising TVL = growing trust in the ecosystem. It means people are locking up assets and using the network.
- Sudden TVL drops = panic. It could be fear, a rug pull, or a smart contract exploit. Either way, time to pay attention.
TVL is especially important if you’re trading DeFi tokens or protocols.
6. Profit/Loss Metrics: NUPL and MVRV
Let’s talk about how deep into profit or pain the market is.
NUPL (Net Unrealized Profit/Loss): Measures whether coins are sitting in profit or loss.
High profits across the network? Some might start selling.
Deep unrealized losses? Most won’t sell—they’re already wrecked and waiting for a bounce.
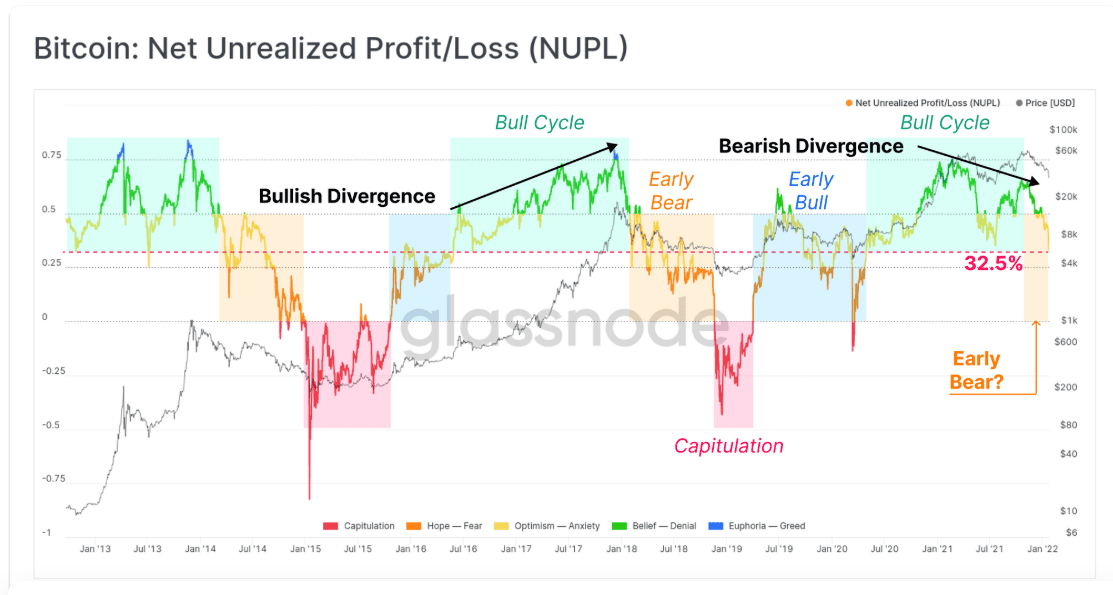
Source: Glassnode
MVRV Ratio (Market Value / Realized Value):
- Below 1: Asset could be undervalued—possibly a buying opportunity.
- Above 1.5–2: Watch out. The market may be overheated.
Great tools for finding good entry points—or knowing when to exit before the top.
7. Whale and Smart Money Activity
Whales move markets. Track wallets known for making smart moves or holding large amounts of crypto:
- Accumulation by whales = bullish. They tend to load up before rallies.
- Large transfers to exchanges = danger. Could signal incoming sells.
Tools like Nansen and Glassnode let you watch these addresses in real time. It’s like seeing what the big boys are up to behind the curtain.
8. Other Indicators That Matter
- Hash Rate: For proof-of-work chains like Bitcoin, a rising hash rate means stronger network security and confidence.
- NVT Ratio: Think of it like a P/E ratio for crypto. High NVT means price might be too high relative to transaction volume (overvalued). Low NVT might suggest a good entry.
How to Use On-Chain Metrics the Right Way
Here’s the thing: No single metric gives you the full picture. You need to combine them.
Context Is Everything
A spike in exchange inflows might mean a sell-off—or just someone reallocating assets. Always dig deeper.
Look for Confluence
When multiple metrics point in the same direction—like rising active addresses, surging volume, and high outflows—that’s your green light. Confluence builds conviction.
Watch for Fake Signals
Some data can be misleading. Exchanges move assets internally. Bots inflate activity. Don’t take every number at face value—check the source when possible.
Combine With TA & Fundamentals
On-chain analysis is powerful, but don’t ditch technical or fundamental analysis. The best strategies blend all three. Think of it as having a 360° view of the market.
Pro Tools for On-Chain Analysis
If you’re serious about this, use the right tools. Here are some top-tier platforms:
- Glassnode: Beautiful visualizations, alerts, and deep metric libraries.
- CryptoQuant: Great for exchange flow tracking and miner metrics.
- Nansen: Known for wallet labeling and tracking smart money.
- Dune Analytics: Create custom dashboards from raw on-chain data.
- Etherscan / BscScan: For hands-on wallet tracking and token flow.
Most of these have free tiers, but the real alpha’s often behind the paywall.
Final Tips to Stay Ahead
- Stay updated: Set alerts. On-chain trends can shift fast, especially during volatility.
- Think in probabilities: These metrics don’t guarantee anything—they tilt the odds in your favor.
- Keep learning: New metrics and dashboards are popping up all the time. Stay curious and keep evolving.
Key Takeaways
On-chain metrics give you a clear edge in crypto trading. While most traders chase charts and headlines, you’ll be reading the network’s heartbeat in real time. That’s the power of on-chain data—it’s honest, transparent, and full of signals most people never see.
Master it, and you’re not just reacting to the market—you’re anticipating it. Now go pull some wallets, check the flows, and trade like you know what you’re doing.