According to its name, the Commodity Channel Index (CCI) was created to show overbought and oversold levels of commodities. Today, though, it’s also a valuable technical analysis tool that helps cryptocurrency traders, providing a clearer view of price movements.
Read below and learn more about the CCI, how it works, and how you can use it to your benefit in your cryptocurrency trading strategy.

What is The Commodity Channel Index (CCI) Indicator
Developed in the 1980s, the Commodity Channel Index (CCI) measures the variation in the price of an asset from its statistical average. As a momentum-based oscillator, CCI helps traders identify potential trend strength and reversals.
The CCI indicator’s fundamental theory is that commodities move in cycles, with highs and lows coming at periodic intervals.
You can rely on the CCI to show you the dominant trend on the longer-term chart, while on a shorter-term chart, it’ll indicate pullbacks and generate trade signals.
You can adapt the CCI to various timeframes. For day trading, the 20-period CCI is quite common, while 50 or 100 periods are recommended for longer timeframes.
On a trading chart, the CCI is displayed as a line that oscillates above and below a zero line. The CCI can also be plotted as two horizontal lines drawn at the +100 and -100 levels, which indicate the overbought and oversold baselines.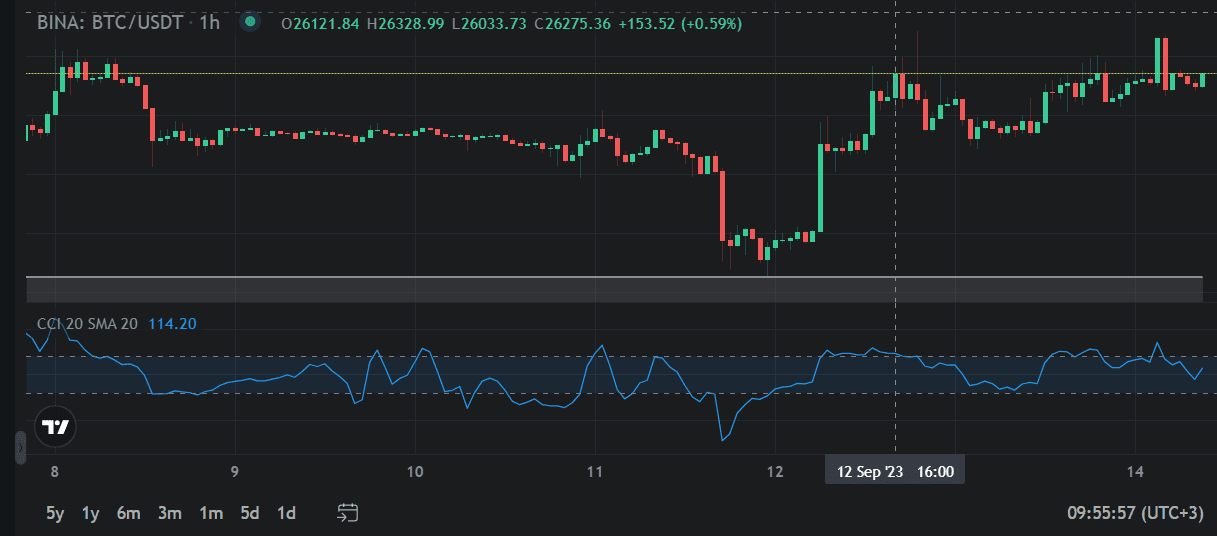
How Does the CCI Work?
The CCI is calculated based on this formula:
CCI = (Typical Price - SMA) / (0.015 * Mean Deviation)
Where:
Typical Price (TP) is the average of the high, low, and close prices for a chosen timeframe.
SMA stands for Simple Moving Average, which is the average of the Typical Prices over a specified period.
Mean Deviation is the mean absolute deviation of the typical prices from their SMA over the same period.
0.015 = a constant that scales the CCI to fit within a range of -100 to +100
The most common period used for CCI calculations is 20, but you can adjust it to your trading strategy.
Interpreting CCI Values
The CCI indicator produces readings that fall within a range of values, with zero as the central point. Here's how to interpret these values effectively:
- Overbought signal: when CCI crosses above +100, it suggests that the cryptocurrency is in an uptrend and is overbought; this is a sell signal.
- Oversold signal: when CCI crosses below -100, it shows that the cryptocurrency is in a downtrend and is oversold; this is a buy signal.
Applying the Commodity Channel Index (CCI) Indicator’s Values for The Crypto Market
Apart from the overbought and oversold conditions, here’s how the CCI helps cryptocurrency traders:
Uncover trend strength
When the CCI is above zero, it indicates that the price is in an uptrend and that it’s above its average. The higher the CCI, the stronger the uptrend. When the CCI is below zero, it indicates that the price is in a downtrend and that it’s below its average. The lower the CCI, the stronger the downtrend.
Spot trend reversals
When the CCI diverges from the price, it can indicate a possible trend reversal as follows:
- Positive Divergence: when an asset’s price makes lower lows while the CCI indicator forms higher lows, it indicates a positive divergence, meaning a potential bullish divergence (reversal) would occur.
- Negative Divergence: when an asset’s price forms higher highs while the CCI indicator records lower highs, it indicates a negative divergence, which may signal a bearish reversal.
*Important note: the CCI can often give false or poor signals for this reason: values either above or below 100 that signal a new trend can come as a late signal; the price could have already had its run and is already starting to correct. That’s why is better to use the CCI in conjunction with other technical indicators.
How to Couple the CCI With Other Technical Indicators
Here are some technical indicators that, when combined with CCI, can improve your technical analysis:
-
Moving Averages
Combining CCI with moving averages can help you identify trends and potential reversals more accurately. For instance, when CCI crosses above +100 and is supported by a moving average crossover, it strengthens the signal for a potential downturn. Or if a crypto asset’s price is below a falling moving average and the CCI is below zero, it indicates a strong bearish trend. -
Relative Strength Index (RSI)
When you use the RSI alongside CCI, it can validate potential buy or sell signals. For example, if CCI indicates an overbought condition, and RSI confirms it by crossing above 70, it reinforces the likelihood of a price correction. -
Bollinger Bands
Bollinger Bands consist of a middle band (usually a simple moving average) and two outer bands that represent price volatility. When CCI moves into one of the extremes, either above +100 or below -100, and prices also touch the upper or lower Bollinger Band, it serves as a strong confirmation for potential trend reversals.

Conclusion
If you understand how to interpret CCI indicator values, you can gain valuable insights into potential trend reversals, overbought or oversold conditions, and divergence patterns. It’s always better to combine the CCI indicator with other technical indicators to polish up your trading strategies.
Additionally, use Altrady – the all-in-one trading platform that makes crypto trading easier and helps you boost the potential for high rewards. If you want to start looking at and evaluating CCI signals, make an Altrady account, select an exchange, and enable the Commodity Channel Index indicator.