Whether using simple or more complex mathematical formulas, technical indicators provide a unique perspective on the strength and direction of price action and are usually represented in a graphical form above or below an asset's price chart.
Anyone can then compare this indicator with the corresponding price chart of the crypto asset. At Altrady, we help crypto traders effectively utilize all types of technical indicators.
This guide provides a practical overview of the four main categories of indicators, with a focus on their application in the cryptocurrency market.
Here’s a list of the types of technical indicators.

The 4 Types of Technical Indicators
Trend Indicators: Identifying, Following, and Reversing the Direction of the Crypto Market
Trend indicators closely inspect the direction and strength of a trend by comparing prices to a predetermined baseline. They are crucial in crypto due to the market's strong trending periods.
Trend indicators help traders identify the direction of a market as well as potential reversal points by providing insight into how prices are changing relative to their average fluctuation.
- When prices are above the average, this indicates a bullish trend,
- Conversely, prices below the average, suggests a bearish trend.
Crypto markets are known for their strong trends, both bullish and bearish. Trend indicators can help identify these trends early and avoid getting caught on the wrong side
Trend indicators are:
- Simple Moving Averages (SMA): These indicators are used to identify trends and reversals, and to set up support and resistance levels.
- Exponential Moving Averages (EMA): Similar to SMA, but Exponential Moving Averages are more responsive to price fluctuations.
- Parabolic SAR: Used to find potential reversals in the market price direction, and identify suitable exit and entry points.
- Moving Average Convergence Divergence: MACD is used to reveal changes in the strength, direction, momentum, and duration of a trend in a Crypto’s price.
Simple Moving Averages (SMA)
The Simple (or Smoothed) Moving Average (SMA) calculates the average price of an asset over a specified period, smoothing out price fluctuations.
Crypto traders often use SMAs to identify trends and potential entry or exit points.
Exponential Moving Averages (EMA)
The Exponential Moving Average (EMA) is a more responsive indicator than the SMA, meaning it gives more weight to recent price data, painting a more vivid picture of the current market conditions.
Parabolic Stop and Reverse (Parabolic SAR):
The indicator uses a trailing stop and reverse method, also known as “SAR,” and its calculation is based on the asset’s price and time and tends to rise gradually. 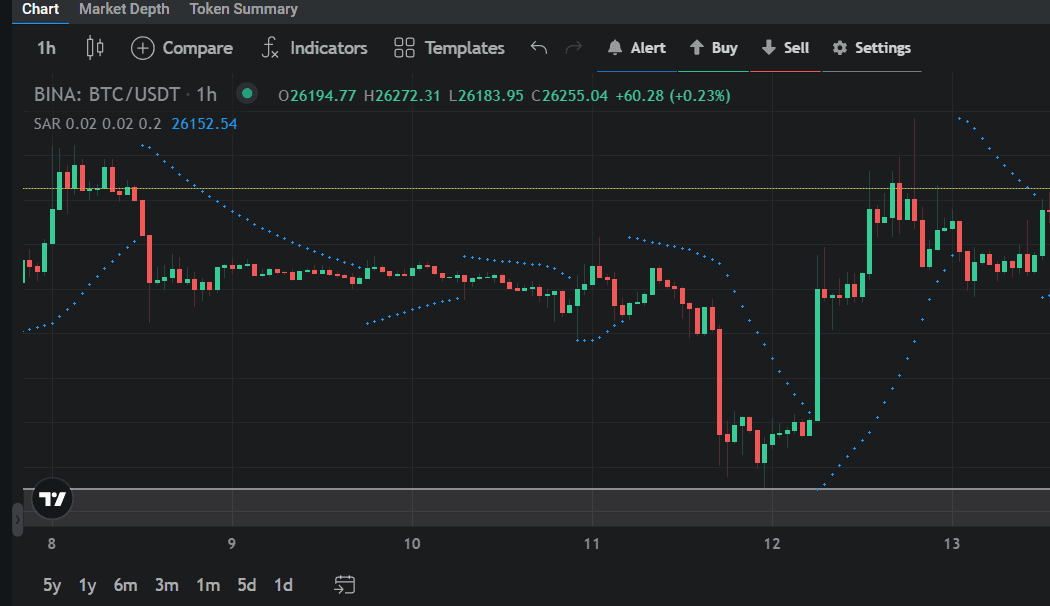
Moving Average Convergence Divergence (MACD)
The Moving Average Convergence Divergence (MACD) is a versatile indicator that combines trend-following and momentum elements. It consists of three components:
- MACD Line: The MACD Line represents the difference between the 12-period and 26-period EMA.
- Signal Line: The Signal Line is a 9-period EMA of the MACD Line. It helps confirm trend changes and provides entry and exit signals.
- Histogram: On a chart, the MACD Histogram shows the difference between the MACD Line and the Signal Line. It helps traders visualize the strength of a trend.

|
Useful tips:
|
Momentum indicators
These technical indicators are used to identify the speed of price movement by comparing the current closing price to previous closes.
Momentum indicators only show if the price is trending up or down and if it is considered overbought or oversold based on past price ranges.
By themselves alone, momentum indicators don’t provide too much valuable information and are usually used in combination with other indicators, like Moving Averages.
Due to crypto's volatility, momentum indicators can be particularly useful for identifying overbought/oversold conditions, which can precede sharp reversals
Let’s explore the most representative momentum indicators.
Stochastic Oscillator
The Stochastic Oscillator is used to predict price turning points by comparing the closing price to its price range, helping traders identify potential trend reversals when the crypto asset is oversold or overbought.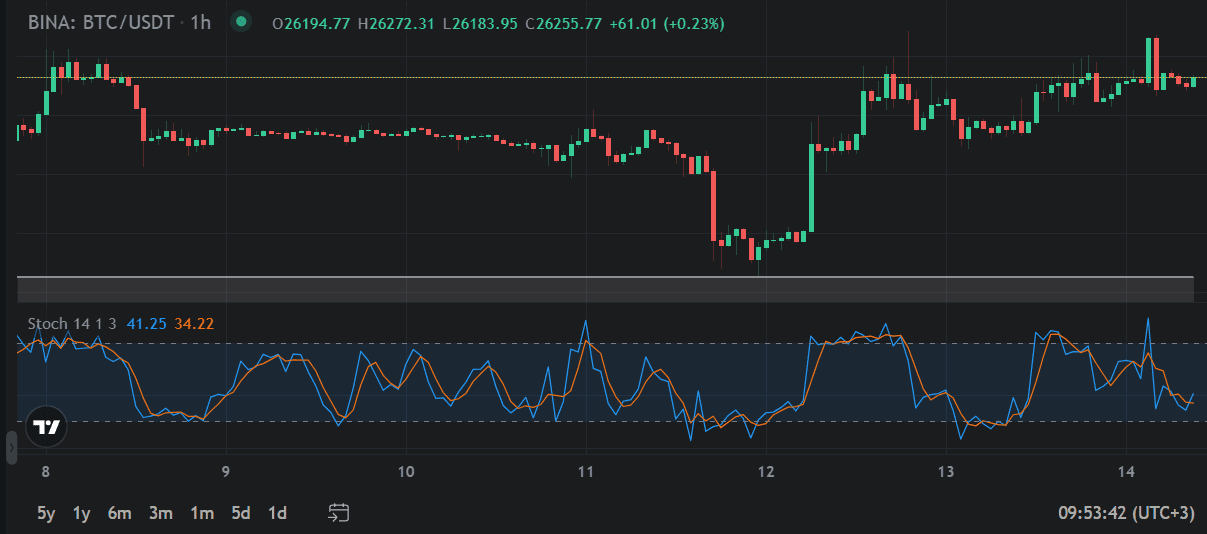
The CCI is used to identify price reversals, price extremes, and trend strength, designed to help traders identify overbought (values going below -100) and oversold (values going over +100) conditions in a particular asset. 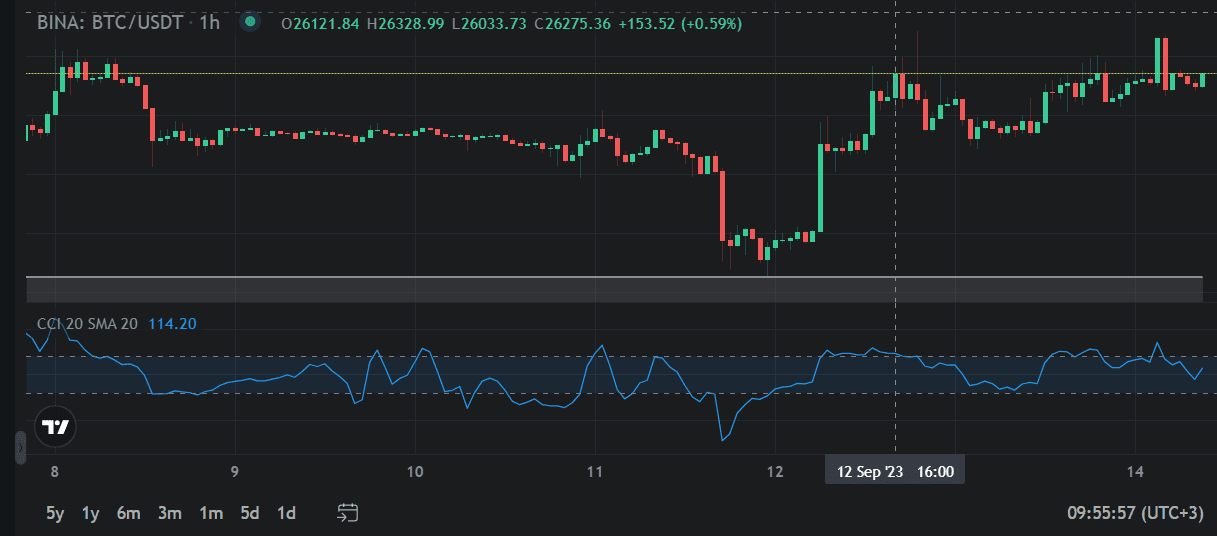
Relative Strength Index (RSI):
This oscillator is used to evaluate the overbought or oversold conditions of the crypto market, as well as potential price reversals.
The RSI compares the average gain and average loss over a specified period of time, usually 14 periods.
|
Useful tips:
|
Volatility Indicators
Volatility is a defining characteristic of crypto. Volatility indicators help traders assess risk and set appropriate stop-losses. These technical indicators measure the rate of price movement, regardless of direction.
Bollinger bands
Bollinger bands measure the highest or lowest price, by comparing them to previous trades.
It is used to identify breakouts from consolidation or trading ranges, helping traders assess the volatility and potential price range of crypto-assets.

Average True Range
The Average True Range (ATR) measures market volatility and how much an asset moves by taking into account the trading range of an asset during a specific period.
It is used to assess the degree of price volatility to set stop-loss orders and determine position sizes.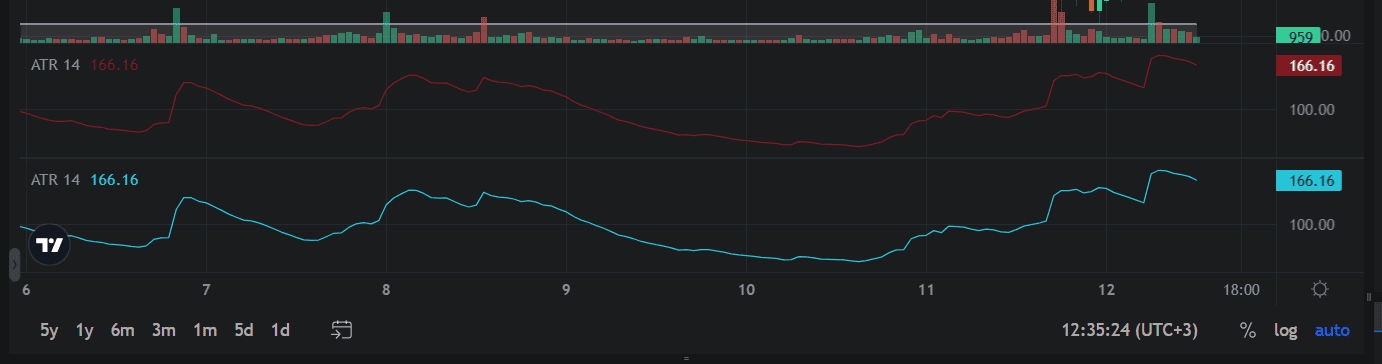
Standard Deviation
Standard Deviation measures the degree of variation or dispersion of returns from the average (mean) return of an asset or portfolio over a specific period of time.
It is used to measure expected risk and to translate certain price movements.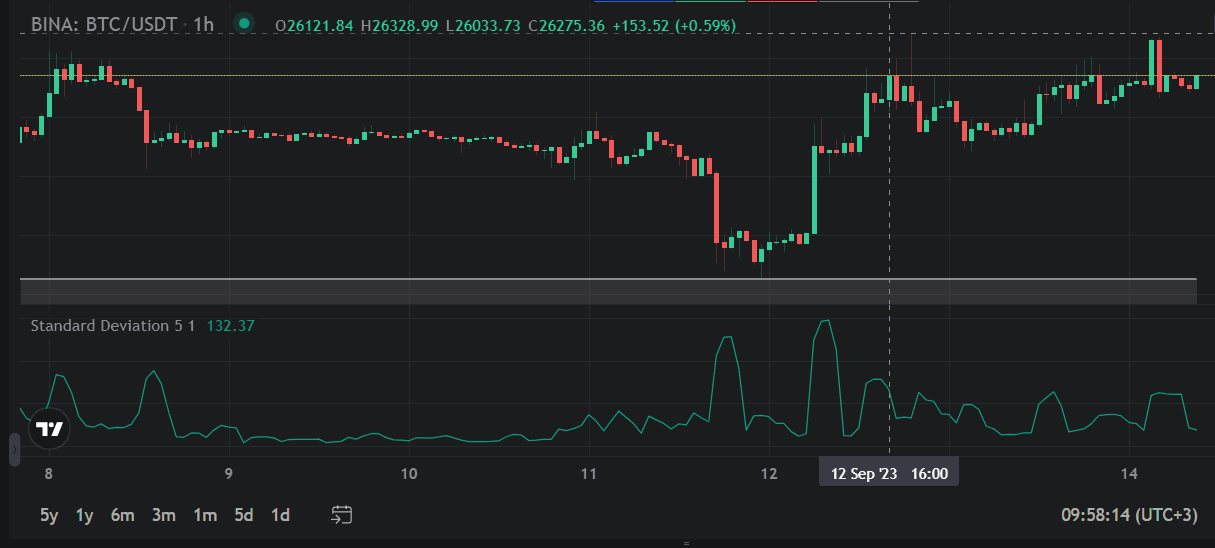
|
Useful resources:
|
Volume Indicators
Volume analysis in crypto can be complex due to the fragmented nature of the market (multiple exchanges). However, this metric still represents a worthy source of information to address this market.
The following technical indicators measure the strength of a trend based on the volume of shares traded.

On-Balance Volume (OBV):
The OBV measures the level of accumulation or distribution, by comparing volume to price. It is used to identify trends, support and resistance levels, and divergences.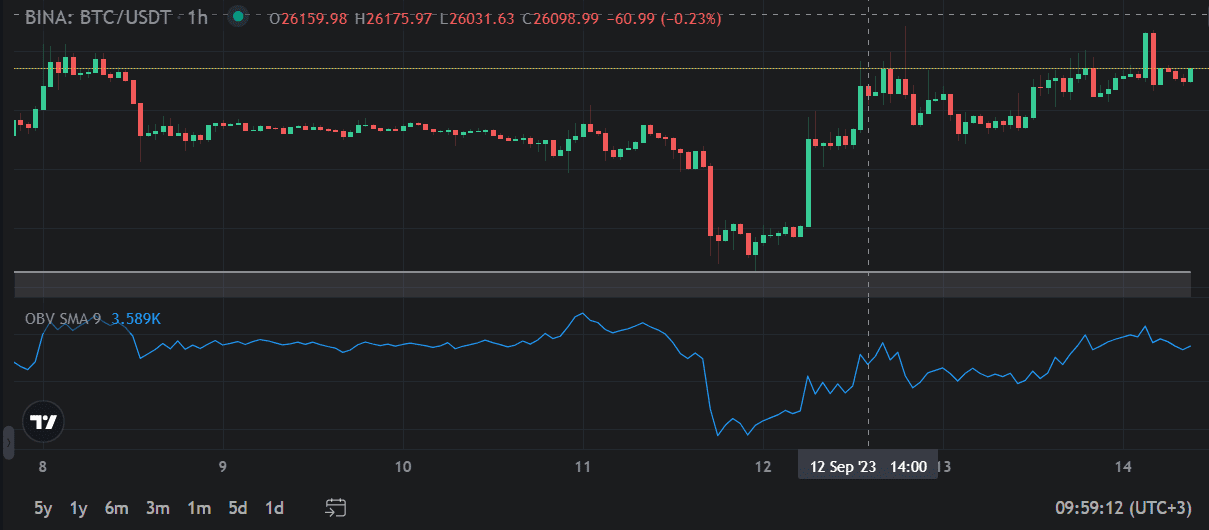
Volume Rate of Change
Volume Rate of Change (VROC) is a technical indicator that measures the percentage change in volume over a given period of time.
It is used to confirm trends, signal reversals, and spot breakouts. It also highlights increase in volume, a situation that happens at market tops, bottoms, or breakouts.
|
Quick notes:
|
3 Main Functions of Technical Indicators
Indicators serve three broad functions:
- To alert: Indicators act as a signal, notifying traders they should study and assess price action more closely. The alert could indicate traders to look for a break of support or watch for a resistance breakout.
- To confirm Some indicators can confirm what other technical analysis tools indicate. For instance, a corresponding moving average crossover could confirm a breakout on the price chart.
- To predict: Technical indicators can be used to predict the direction of future prices. Based on price patterns that tend to repeat, technical indicators can predict a similar future price outcome. A common example is carefully looking at price patterns by combining trend, momentum, and volume indicators.

Extra Tips for Novice Traders
Key principles for a winning trading strategy as a novice trader:
- Define clear trading goals: After getting to know more about technical indicators, you should define your trading goals and risk tolerance. Decide if you’re looking for short-term gains or rather long-term investments and how much risk are you willing to take.
- Choose and combine the right technical indicators: First, figure out your trading style—whether you're a day trader, swing trader, or long-term investor. If you’re a day trader, you’d want indicators that generate many trading signals in a day (e.g., the ATR).
Based on this, choose and use more technical indicators in tandem to build a successful strategy. For example, you might use moving averages to identify trends and RSI to confirm momentum.
- Backtest Your Strategy: Before risking your capital, backtest your strategy using historical data. This step will help you gauge its effectiveness and make necessary adjustments.
- Rely on a user-friendly platform like Altrady: Altrady streamlines your trading process, helps you manage risk and increases profitability with simple and quick automation tools.
Common Mistakes Novices Should Be Aware
- Using only trend indicators during a sideways market.
- Ignoring volume confirmation when using momentum indicators.
- Failing to adjust volatility indicator settings for crypto's high volatility.
- Relying solely on indicators and neglecting fundamental analysis of crypto projects.
Conclusion
Understanding the different types of technical indicators is crucial for success in crypto trading. Altrady provides the tools to apply all these indicator types, from customizable charting to automated alerts and backtesting. Start your free trial and explore the power of informed technical analysis.