Volume and volatility indicators stand out as critical components in analyzing crypto market dynamics and trends. In this comprehensive guide, we delve deep into the intricacies of volume and volatility indicators, shedding light on how they influence trading strategies and market perception.
What are Volume and Volatility Indicators
Both volume and volatility indicators create trading opportunities. Volatility moves the price and is usually accompanied by more volume, which means there’s more liquidity.

Volume in Crypto Trading
In crypto trading, volume represents the total number of shares or contracts traded in a specific crypto asset during a given time frame, usually a day. Volume indicators offer insights into the strength of a trend and its direction. By looking at volume, traders get a glimpse into the market's heartbeat, understanding whether a price movement is supported by a robust buying or selling interest.
*Tip: low volume periods aren’t typically recommended for trading since the price might range, leading to either low profitable trades or negative ones.
Volatility in Crypto Trading
Volatility measures the degree of price fluctuations in an asset over time, indicating when a market is more volatile and more volume is entering it. High volatility indicates significant price swings, while low volatility suggests relative price stability.
Volatility indicators are based on the premise that volatility reflects uncertainty and risk. That’s why traders and investors closely monitor volatility to gauge risk and potential profit opportunities.
Volatility indicators can help you measure the range and speed of price movements, identify potential breakouts or breakdowns, and adjust your risk management strategies.
Common Volume and Volatility Indicators
On-Balance Volume (OBV)
On-balance volume (OBV) measures the cumulative buying and selling pressure in a market, based on the idea that volume precedes price. Changes in volume can signal upcoming price changes too.
For instance, when the prices for a crypto asset go up, this is when the OBV increases. When prices go down, the volume decreases, signaling a possible reversal or weakness.
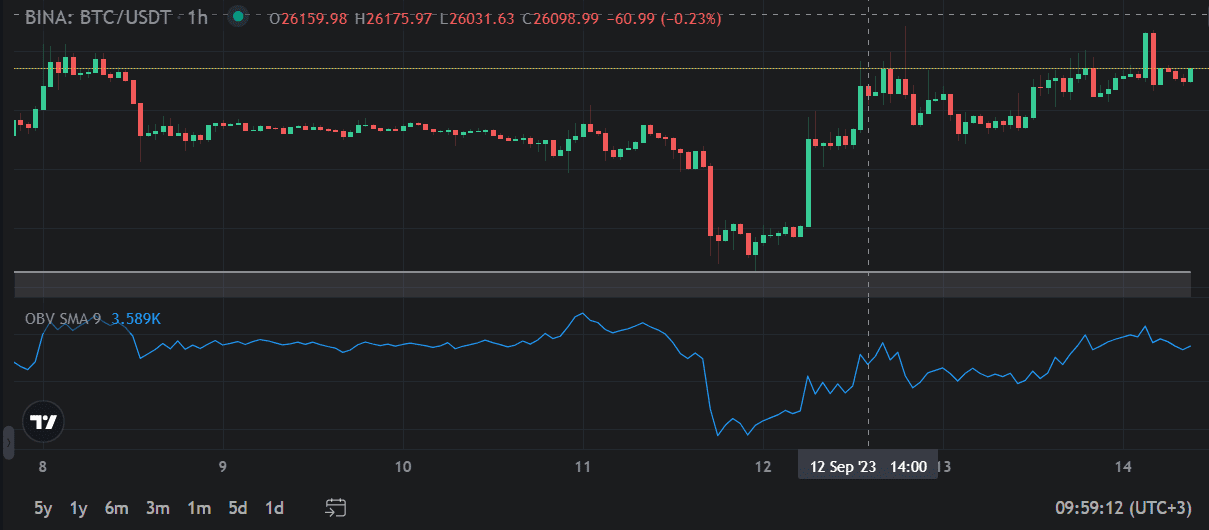
Based on the 24-hour closing price, the On-Balance Volume calculating formula subtracts volume on days when the volume decreases and adds volume on the days the volume increases.
Average True Range (ATR)
The Average True Range calculates the average range of price movements over a specified time frame (usually 14 days, but the time frame can also be changed to a daily, weekly, or monthly basis).
The ATR calculates the average range between the daily high and low prices, showing the crypto market’s level of volatility.
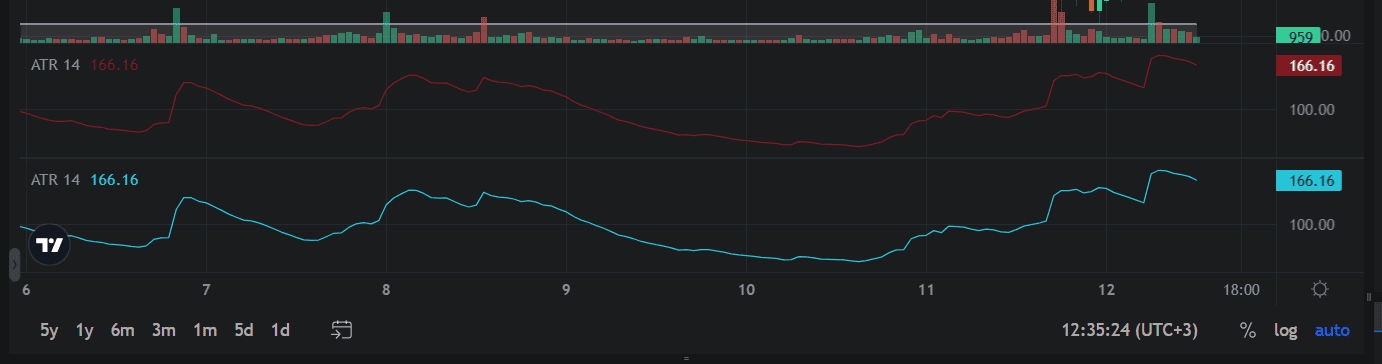
A higher ATR suggests greater volatility, which is usually an indicator for traders to set their stop-loss orders higher because there’s a high chance for the market to make a recovery. Conversely, during times of lower volatility, traders would choose a smaller stop loss figure as the chances of a quick recovery from a market are low.
Bollinger Bands
Bollinger Bands are a volatility indicator that show potential price breakouts and reversals. By assessing previous trades, Bollinger Bands indicate how high or how low prices can go.
Bollinger Bands are represented by a middle band (Simple Moving Average or SMA) and two outer bands that are standard deviations away from the middle band.
The bands help traders interpret price interactions as follows: when the price touches or crosses the upper band, it’s an indicator that the price is overbought or that there’s an upward momentum; when the price touches or crosses the lower band, it’s a sign that the price is oversold or that there is downward momentum.

So, the bands expand when volatility increases or contract when the price is more stable.
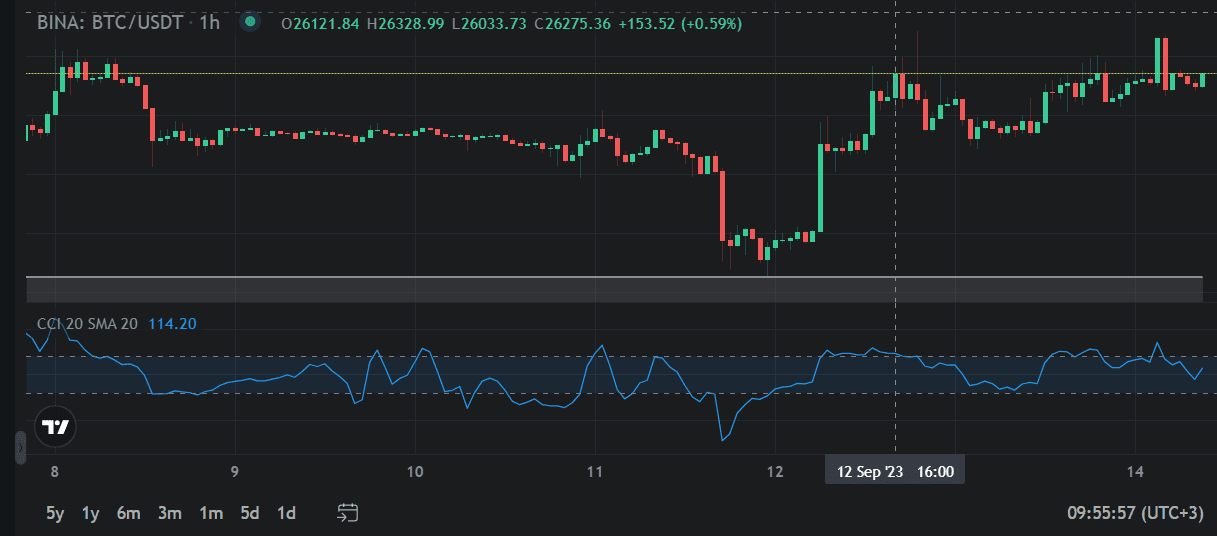
Commodity Channel Index (CCI)
The Commodity Channel Index identifies cyclical turns or trend reversals, measuring the difference between the current price and the historical average price of a security or commodity.
CCI’s core concept is that prices tend to move around their average over time.
CCI also signals overbought and oversold levels: CCI values above +100 indicate that the price is well above its historical average, so a crypto asset may be overbought; CCI values below -100, show that the price is well below its historical average and a crypto asset may be oversold.
How to Use Volume and Volatility Indicators for Crypto Trading
Volume and volatility indicators can provide valuable insights into the crypto market behavior and psychology.
General guidelines on how to use volume and volatility indicators:
- Look for divergences between volume/volatility indicators and price action. For example, if the price is making higher highs but the volume/volatility indicators are making lower highs, this could indicate a weakening trend or a potential reversal.
- Assess whether there are convergences (connections) between volume/volatility indicators and price action. For instance, if the price is breaking out of a consolidation pattern and the volume/volatility indicators are also breaking out, this could indicate a strong trend continuation or initiation.
- Look for extremes in volume/volatility indicators. For example, if the volume/volatility indicators are reaching unusually high or low levels, this could indicate an overbought or oversold condition or a climax point.
- Check if there are changes in volume/volatility indicators. For example, if the volume/volatility indicators are shifting from low to high or vice versa, this could signal a change in market sentiment.

The Bottom Line
Key takeaways:
- volume indicators can help you identify trading opportunities, confirm price trends, spot reversals, and gauge market sentiment;
- volatility indicators can help you measure the range and speed of price movements, identify potential breakouts or breakdowns, and adjust your risk management strategies.
Both volume and volatility indicators are powerful tools that can help you analyze the crypto market dynamics and enhance your trading performance.
However, you should use them wisely and cautiously, along with other technical analysis methods. You can combine volume and volatility indicators with trend lines, chart patterns, candlestick formations, etc., to confirm or cancel your trading signals.
Additionally, use Altrady platform to streamline your trading process! Get instant alerts and notifications, so you can boost your trading journey and reduce risks.