One of the oldest and most conventional indicators in technical analysis, the On-Balance-Volume (OBV) indicator helps you gauge the strength of trends in the cryptocurrency market. By using the OBV, you can confirm or identify price trends, spot divergences, and detect breakouts when trading cryptocurrencies.
Here’s everything you need to know about On-Balance-Volume, its advantages, and how to read its values to make better-informed trading decisions.

What is the On-Balance Volume Indicator
The origins of the On-Balance Volume go way back to the 1960s when Joseph Granville first introduced the idea that volume precedes price. OBV’s main theory relies on the fact that institutional investors are more likely to buy or sell assets before the rest of the market and this can be seen in the volume of their transactions (a concept also known as smart money).
That means that changes in volume can signal potential changes in price, especially when they diverge from the prevailing trend. You can apply the valuable insights the OBV offers to any asset, whether it's a stock, a commodity, or, in your case, a cryptocurrency.
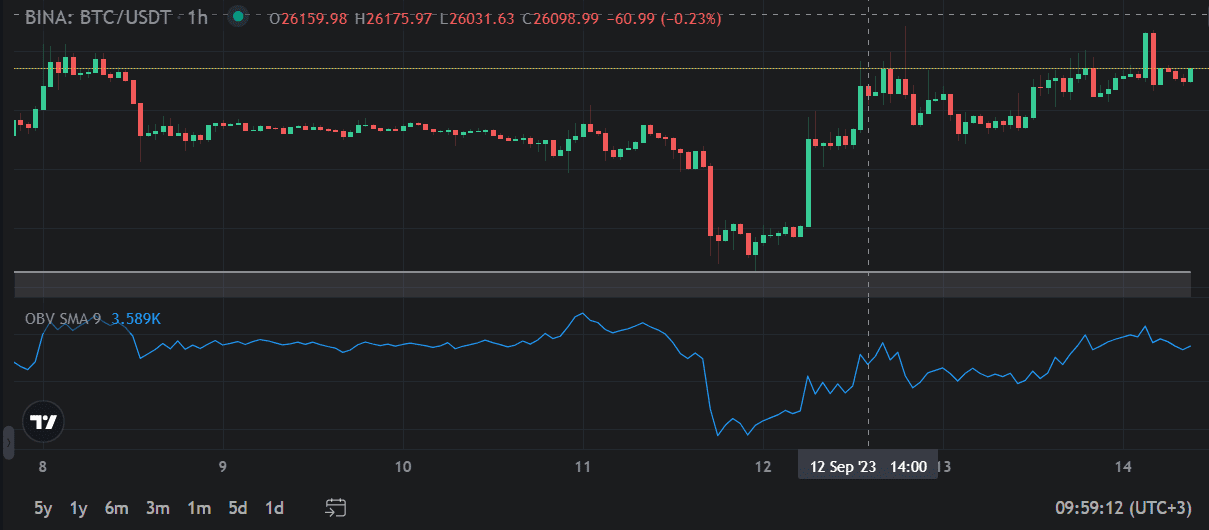
How Does the OBV Work?
The On-Balance Volume indicator tracks an asset’s cumulative volume, taking into account whether the price is moving up or down.
Here's the calculation formula for the OBV:
OBV is calculated by adding or subtracting the volume of each trading period depending on whether the price closed higher or lower than the previous period. The formula is:
OBV = OBVprev + volume * sign(close - closeprev)
where:
- OBVprev is the previous OBV value
- volume is the current trading volume
- close is the current closing price
- ‘closeprev’ is the previous closing price
- sign(x) is a function that returns 1 if x is positive, -1 if x is negative, and 0 if x is zero
The result is a cumulative total volume that moves up or down with the price trend.
Interpreting OBV Values
- A rising OBV: buyers are more active than sellers, and the volume is seen as “accumulation”; expect prices to move higher.
- A falling OBV: sellers are more active than buyers, and the volume is viewed as "distribution"; expect prices to fall.
When the OBV indicator is rising while the price is also rising, you can take this as confirmation of the bullish trend. Similarly, when the OBV indicator is falling while the price is also falling, this would translate into confirmation of the bearish trend.
*Useful tips:
It’s recommended that you use OBV when a crypto asset’s price is trending upwards or downwards; the OBV won’t give valuable info when an asset’s price is ranging.
Always check the indicator’s timeframe; for example, ensure TradingView’s default selection is the same as the chart, so you won’t analyze a daily OBV on a weekly chart.
OBV’s Practical Applications When Trading Crypto Assets
Here’s how the On-Balance Volume helps you when trading cryptocurrencies:
Identify trend reversals
One of the primary uses of the OBV indicator is spotting potential trend reversals. When the OBV diverges from the price action, it signals an impending reversal.
For instance:
If the cryptocurrency's price is making higher highs, but the OBV is making lower highs, it suggests weakening buying pressure and a possible trend reversal to the downside.
If the price is making lower lows, but the OBV is making higher lows, it indicates diminishing selling pressure and a potential trend reversal to the upside.
Confirm trend strength
The OBV indicator is also valuable for confirming if a trend is strong enough. When the OBV aligns with the price direction, it reinforces the conviction behind that trend. Traders often look for the following scenarios:
bullish confirmation: if the cryptocurrency's price is rising, and the OBV is also on an upward trajectory, it reinforces the bullish sentiment, making it a good time to consider long positions.
bearish confirmation: if the price is going down, and the OBV is also in a downward trend, it reaffirms the bearish sentiment, suggesting potential short opportunities.
Divergence analysis
A divergence between the OBV and price action can provide valuable clues about potential market shifts. Traders often pay close attention to:
bullish divergence: when the price is making lower lows, but the OBV is making higher lows, it signals potential upward momentum and a buying opportunity.
bearish divergence: if the price is making higher highs, but the OBV is making lower highs, it hints at weakening buying pressure and a potential sell-off.
How to Couple the On-Balance-Volume With Other Technical Indicators
You should consider combining OBV with other technical indicators to create a strong crypto trading strategy.
Common combinations include using the OBV with:
Moving Averages
Moving averages are excellent companions to OBV. such as the Simple Moving Average (SMA) or Exponential Moving Average (EMA), can help smooth out price data and confirm trends. When OBV aligns with moving averages, it reinforces the trend’s strength level.
For example, when the OBV and Moving Averages show a bearish divergence, it hints at a good exit point for a long position or an entry point for a short position.
Relative Strength Index (RSI)
RSI measures the speed and change of price movements and can help identify overbought or oversold conditions. When RSI confirms OBV signals, it can enhance the precision of your trading decisions.
For instance, if the OBV shows a bearish divergence while the RSI also shows bearish signals, it means that there is strong selling pressure and a high probability of a price decrease.
Bollinger Bands
Bollinger Bands provide insights into price volatility and potential breakouts. When OBV aligns with Bollinger Bands, it can help identify periods of low volatility followed by potential explosive price movements.
For example, if both the OBV line and the price are above the middle band, it confirms an uptrend. If both are below the middle band, it confirms a downtrend.

Conclusion
Successful trading requires a comprehensive approach, and the OBV indicator can be a valuable piece of that puzzle.
By understanding how to interpret OBV signals, you can identify trend reversals, confirm trend strength, and make informed trading choices.
The On-Balance Volume is easy to interpret and you can apply it to any time frame and crypto asset. To make things even easier, use Altrady and start checking OBV signals. If you’re a novice trader, you can access Altrady’s free trading courses, and join an expert trading community.
Start your free trial!
FAQ
What is the On-Balance Volume (OBV) indicator in crypto trading?
On-Balance Volume (OBV) is a volume based indicator that tracks cumulative buying and selling pressure by adding volume on up closes and subtracting volume on down closes. The goal is to judge whether volume is supporting the current price move, because strong trends usually show participation through volume.
How do traders use OBV to confirm a trend?
OBV is often used as a trend confirmation tool. When price is rising and OBV is also rising, it suggests accumulation and supports the bullish trend. When price is falling and OBV is also falling, it suggests distribution and supports the bearish trend. When OBV does not agree with price direction, it can warn that the trend is weakening.
What does OBV divergence mean?
OBV divergence happens when price and OBV move in different directions. If price makes higher highs while OBV makes lower highs, buying pressure may be fading and a downside reversal becomes more likely. If price makes lower lows while OBV makes higher lows, selling pressure may be fading and an upside reversal becomes more likely. Divergence is a clue, so it works best when followed by confirmation.
When does OBV work best, and when is it less useful?
OBV tends to work best in trending conditions where volume can clearly confirm direction. It is usually less useful in choppy, ranging markets because volume signals can become noisy and the OBV line can swing without producing clean follow-through.
Which indicators pair well with OBV?
OBV is commonly paired with moving averages to confirm trend direction, RSI to add momentum or overbought and oversold context, and Bollinger Bands to help spot breakout conditions. The purpose of combining indicators is to reduce false signals and improve timing through confluence.