An intuitive and user-friendly trading tool, the Parabolic SAR has gained great popularity among crypto traders. It’s quite easy to understand the Parabolic SAR’s signals: it tells you when a prevailing trend is close to an end and ready to change its course.
Apart from that, Parabolic SAR’s advantages are the fact that it can be used in any timeframe and has a high prediction accuracy.
Read below and delve into all the essential details about the Parabolic SAR indicator, how it works, and how you can harness its potential to enhance your crypto trading strategies.

What is The Parabolic SAR Indicator
As a trend-following indicator, Parabolic SAR is a technical analysis tool used to identify potential trend reversals in an asset’s price. The name "Stop and Reverse" aptly describes its primary function – indicating when a prevailing trend may stop and reverse its direction.
Parabolic SAR is based on the idea that an asset’s price moves in a parabolic curve during a strong trend, and that reversing the curve’s direction can signal a change in the trend.
How Does the Parabolic SAR Work?
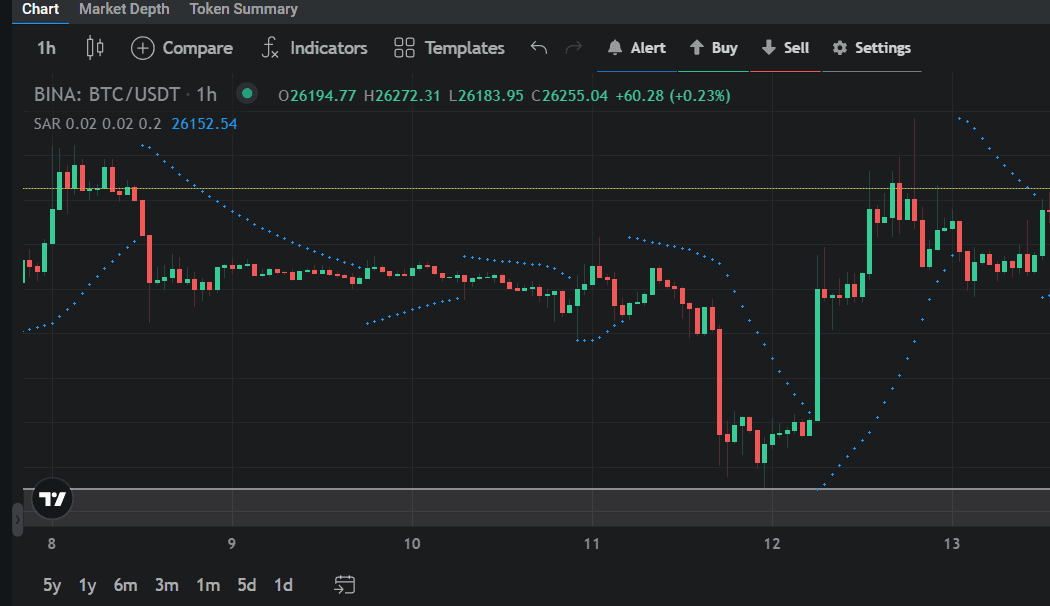
It’s very easy to notice the Parabolic SAR indicator on a trading chart; it appears as a series of dots above or below the price bars, depending on whether the trend is up or down.
The Parabolic SAR indicator acts as a dynamic trailing stop, which means that it adjusts its level according to the price movement. The indicator starts with a low value (called the acceleration factor) and increases it gradually every time it reaches a new extreme point (the highest high or the lowest low), up to a maximum value. For this reason, this indicator is thought to be more sensitive to price changes and closer to the price action.
The Parabolic SAR is calculated using the following formula:
SARn = SARn-1 + AF × (EPn-1 - SARn-1)
Here's what each variable represents:
- SARn: The current SAR value
- SARn-1: The previous SAR value
- AF (Acceleration Factor): a constant that starts at a low value and gradually increases as the trend continues; by default, the AF is set at 0.02.
- EPn-1 (Extreme Point): the highest high or lowest low in the previous period, depending on the trend’s direction.
How to Interpret Parabolic SAR Values
The key element of trading cryptocurrencies with the Parabolic SAR is recognizing when the dots cross over price. When this happens, you can consider it as a sign of reversal and a potential buy or sell signal.
Here's how to interpret the Parabolic SAR's signals:
Uptrend: when the Parabolic SAR dots are below the price, it suggests that the asset is in an uptrend; this is a bullish signal, indicating that traders should consider buying.
Downtrend: when the Parabolic SAR dots are above the price, it signifies a downtrend; this is a bearish signal, suggesting that traders should consider selling.
Trend reversal: when the dots switch from being above to below the price (or vice versa), it signals a potential trend reversal; you can use this signal to close your existing positions and open new ones in the opposite direction.
Practical Applications of Parabolic SAR in the Crypto Market
The Parabolic SAR has 3 main practical applications when trading crypto assets:
-
Easily spot entry and exit points
As a trader, you can assess the SAR dots and decide to enter or exit a position, so you can capture profits and minimize losses. The signals are simple: when the SAR dots flip from being above the price to below it, it’s usually a signal to enter a long position; when they switch from below to above, it shows a good time to exit the trade. -
Set stop-loss orders
Using a technique known as the "trailing stop," the Parabolic SAR allows you to secure gains without prematurely exiting a winning trade. In an uptrend, you should place a stop-loss order just below the SAR dots, while in a downtrend, you can set the stop-loss order above the dots to protect your capital in case of an unexpected trend reversal. -
Find and confirm trends
One of the key benefits of the Parabolic SAR is the fact that it helps you identify trends. When the SAR dots are below the price, it indicates an uptrend, and when they are above the price, it signals a downtrend. This simple yet effective visual cue can help you make timely decisions and take a position that aligns with the prevailing trend.
You can also use this indicator as a trend confirmation tool if you combine its signals with other technical indicators.
Combining Parabolic SAR With Other Technical Indicators
Using the Parabolic SAR (Stop and Reverse) indicator in conjunction with other technical indicators can be an effective approach for crypto trading.
Here are some common combinations:
Parabolic SAR with MACD
You can use the Parabolic SAR to look for a crossover of the dots and the price and confirm the signals with the help of the Moving Averages Convergence Divergence (MACD). For example, if the price crosses above the Parabolic SAR dots, indicating a possible uptrend reversal, you should wait for the MACD to cross above the zero line or the signal line, before entering a long position. Similarly, if a crypto asset’s price goes below the Parabolic SAR dots, indicating a possible downtrend reversal, you should wait for the MACD to cross below the zero line or the signal line before entering a short position.
Parabolic SAR with Relative Strength Index (RSI)
The trading strategy works similarly to the MACD indicator. When the Parabolic SAR shows a possible uptrend reversal, you should wait for the Relative Strength Index (RSI) to cross above 50 before entering a long position. Conversely, if a crypto asset’s price goes below the Parabolic SAR dots, indicating a possible downtrend reversal, you should wait for the RSI to cross below 50 before entering a short position.
Parabolic SAR with Stochastic Oscillator
The Stochastic Oscillator helps identify potential reversal points. When you notice the Parabolic SAR changes direction, you can take a look and see if the Stochastic Oscillator confirms it with a crossover in overbought or oversold territory. Combining these two indicators will bring an additional confirmation of the trade signal.

Conclusion
Key takeaways:
- you can use Parabolic SAR to identify changing trends and decide if you should enter or exit your position
- it helps you stay out of the market and keep you on the sidelines when it shows instability
That said, the Parabolic SAR indicator is a valuable tool in the toolkit of any crypto trader.
If you want to navigate the often turbulent waters of cryptocurrency markets with even more confidence, use Altrady – your one-stop shop for anything related to crypto trading.
Make an Altrady account and start assessing Parabolic SAR signals! Choose one or more exchanges, and enable the Parabolic SAR indicator. Remember to simultaneously look closely at other indicators to confirm its clues. Enjoy Altrady’s easy-to-use tools, automation, and other valuable features!